MaCH: Using Sequence and Genotype Data to Estimate Haplotypes
and Unobserved Genotypes
Yun Li,1Cristen J. Willer,2Jun Ding,2Paul Scheet,3and Gonc-alo R. Abecasis2
1Department of Genetics, Department of Biostatistics, University of North Carolina, Chapel Hill, North Carolina 2Center for Statistical Genetics, Department of Biostatistics, University of Michigan School of Public Health, Ann Arbor, Michigan
3Department of Epidemiology, University of Texas M.D. Anderson Cancer Center, Houston, Texas
Genome-wide association studies (GWAS) can identify common alleles that contribute to complex disease susceptibility. Despite the large number of SNPs assessed in each study, the effects of most common SNPs must be evaluated indirectly using either genotyped markers or haplotypes thereof as proxies. We have previously implemented a computationally efficient Markov Chain framework for genotype imputation and haplotyping in the freely available MaCH software package. The approach describes sampled chromosomes as mosaics of each other and uses available genotype and shotgun sequence data to estimate unobserved genotypes and haplotypes, together with useful measures of the quality of these estimates. Our approach is already widely used to facilitate comparison of results across studies as well as meta-analyses of GWAS. Here, we use simulations and experimental genotypes to evaluate its accuracy and utility, considering choices of genotyping panels, reference panel configurations, and designs where genotyping is replaced with shotgun sequencing. Importantly, we show that genotype imputation not only facilitates cross study analyses but also increases power of genetic association studies. We show that genotype imputation of common variants using HapMap haplotypes as a reference is very accurate using either genome-wide SNP data or smaller amounts of data typical in fine-mapping studies. Furthermore, we show the approach is applicable in a variety of populations. Finally, we illustrate how association analyses of unobserved variants will benefit from ongoing advances such as larger HapMap reference panels and whole genome shotgun sequencing technologies.Genet. Epidemiol. 34:816–834, 2010. r2010 Wiley-Liss, Inc.
Key words: imputation; haplotyping; sequencing
Additional Supporting Information may be found in the online version of this article.
Correspondence to: Gonc-alo R. Abecasis, Department of Biostatistics, University of Michigan School of Public Health, 1415 Washington
Heights, Ann Arbor, MI 48109. E-mail: [email protected] Received 10 August 2010; Accepted 13 August 2010
Published online 5 November 2010 in Wiley Online Library (wileyonlinelibrary.com). DOI: 10.1002/gepi.20533
INTRODUCTION
Most ongoing genome-wide association studies (GWAS) rely on a commercial SNP genotyping panel that directly assays only a small fraction of SNPs in the human genome [Carlson et al., 2003; The International HapMap Consortium 2005]. In these scans, the majority of SNPs in the genome must be evaluated indirectly using one or more of the genotyped SNPs as proxies [Barrett and Cardon, 2006; Pe’er et al., 2006]. Despite the ability of individual genome-wide association scans to identify common alleles that make large contributions to disease risk and a subset of the loci with smaller effect [Hirschhorn and Daly, 2005], many alleles that contribute to complex disease can only be identified through the meta-analysis of multiple genome-wide scans [for specific examples, see Lettre et al., 2008; Sanna et al., 2008; Willer et al., 2008, 2009]. Although it is possible to assign SNPs genotyped in each study as proxies for SNPs genotyped in the other studies [Carlson et al., 2004; de Bakker et al., 2005; Lin et al., 2004; Nicolae, 2006; Zaitlen et al., 2007], meta-analyses of GWAS conducted in this manner would be cumbersome because of the limited overlap between the different commercial panels and
because different choices of proxies for a particular SNP might lead to somewhat different conclusions.
GENOTYPE IMPUTATION
shared haplotype stretches are identified correctly, imputed genotypes will be accurate unless they have been disrupted by gene conversion or mutation events.
INITIAL EVALUATION OF IMPUTED
GENOTYPES AND HAPLOTYPES
Here, we systematically evaluate the genotype imputa-tion approach outlined in the paragraph above using our Markov Chain Haplotyping algorithm (MaCH 1.0; see Appendix for implementation details). To estimate haplo-types, our approach starts by randomly generating a pair of haplotypes that is compatible with observed genotypes for each sampled individual. These initial haplotype estimates are then refined through a series of iterations. In each iteration, a new pair of haplotypes is sampled for each individual in turn using a Hidden Markov Model (HMM) that describes the haplotype pair as an imperfect mosaic of the other haplotypes. Model parameters that characterize the probability of change in the mosaic pattern between every pair of consecutive markers and the probability of observing an imperfection in the mosaic at each specific point are also updated. After many iterations (typically 20–100), a consensus haplotype can be constructed by merging the haplotypes sampled in each round.
HAPLOTYPING
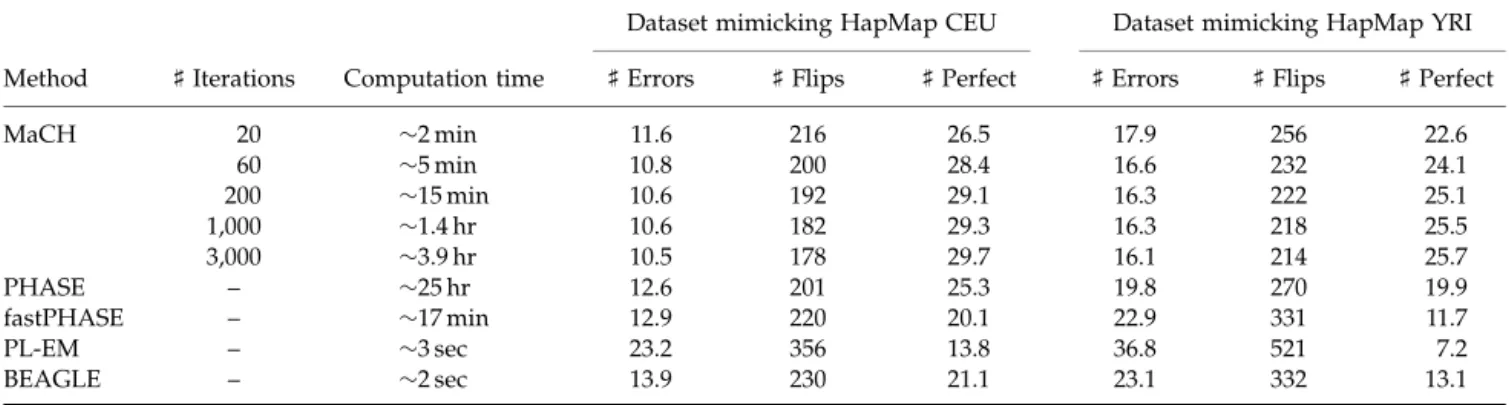
Our approach was inspired by the Markov models commonly used for pedigree analysis [for examples, see Abecasis et al., 2002; Kruglyak et al., 1996; Lander and Green, 1987] and shares several features with other HMMs used to describe sampled haplotypes as a mosaic of a set of reference haplotypes [Daly et al., 2001; Li and Stephens, 2003; Mott et al., 2000; Stephens and Scheet, 2005a]. In order to evaluate its performance, we simulated two sets of 100 1 Mb regions that mimic the degree of linkage disequilibrium (LD) in the HapMap CEU and YRI samples
[Schaffner et al., 2005]. In each region, we simulated genotypes for 200 markers, ascertained to mimic HapMap I allele frequency patterns [Marchini et al., 2006], in 90 individuals with 2% of the genotypes missing at random. We then used our method to reconstruct individual haplotypes and tallied three measures of haplotyping quality [Marchini et al., 2006]: (1) the number of incorrectly imputed missing genotypes, (2) among heterozygous sites, the number of consecutive sites that are phased incorrectly with respect to each other (this is the number of ‘‘flips’’ required to transform estimated haplotypes into the true haplotypes, after masking incorrectly imputed sites), and (3) the number of perfectly inferred haplotypes. The three measures were averaged over all 100 regions and the results are summarized in Table I. For comparison, the table also includes results for PHASE [Stephens and Scheet, 2005b; Stephens et al., 2001] and fastPHASE [Scheet and Stephens, 2006], two state of the art haplotyping algorithms [Marchini et al., 2006], and for BEAGLE [Browning, 2006] and PL-EM [Qin et al., 2002], two alternative haplotyping algorithms that are very computationally efficient. Table I clearly shows that our method is competitive in all three measures: our method results in slightly fewer incorrectly imputed genotypes, requires slightly fewer flips to transform imputed haplotypes into the true haplotypes, and produces slightly more correctly inferred haplotypes over the entire 1 Mb stretch than PHASE, which was the second best method. Furthermore, note that estimates of haplotypes and missing genotypes obtained in 5–20 min using our method are comparable in quality to those produced by PHASE runs averaging1 day.
GENOTYPE IMPUTATION FOR UNTYPED MARKERS
Encouraged by these initial results, we proceeded to apply our method to impute genotypes for untyped markers in the Finland United States Investigation of NIDDM genetics (FUSION) GWAS [Scott et al., 2007].
TABLE I. Quality of haplotypes and missing genotypes estimates
Dataset mimicking HapMap CEU Dataset mimicking HapMap YRI
Method ]Iterations Computation time ]Errors ]Flips ]Perfect ]Errors ]Flips ]Perfect
MaCH 20 2 min 11.6 216 26.5 17.9 256 22.6
60 5 min 10.8 200 28.4 16.6 232 24.1
200 15 min 10.6 192 29.1 16.3 222 25.1
1,000 1.4 hr 10.6 182 29.3 16.3 218 25.5
3,000 3.9 hr 10.5 178 29.7 16.1 214 25.7
PHASE – 25 hr 12.6 201 25.3 19.8 270 19.9
fastPHASE – 17 min 12.9 220 20.1 22.9 331 11.7
PL-EM – 3 sec 23.2 356 13.8 36.8 521 7.2
BEAGLE – 2 sec 13.9 230 21.1 23.1 332 13.1
The table summarizes results from the analysis of two sets of 100 simulated 1 Mb regions. The two sets reflect the degree of LD in the
HapMap CEU and YRI samples, respectively. In each region,200 markers were ascertained to mimic HapMap allele frequency spectra and
2% missing data was introduced at random. The data were then analyzed with one of five haplotypers (MaCH, PHASE, fastPHASE, PL-EM and BEAGLE) and the quality of haplotype solutions and imputed genotypes evaluated. The number of missing genotypes imputed
incorrectly (] Errors), the number of switches in haplotype phase required to convert the estimated haplotypes into the simulated
haplotypes (]Flips) and the number of perfectly estimated haplotypes (]Perfect) was recorded. Averages of these three quantities are
Since a previous analysis suggested LD patterns in the HapMap CEU and in FUSION are similar [Willer et al., 2006], we used genotypes for 290,690 autosomal markers with allele frequency45% in the Illumina 317K SNP chip and haplotypes for 2.5M polymorphic markers in the phased HapMap CEU chromosomes as input. After running the haplotyping procedure described above, we estimated the most likely genotype at each position (taking a majority vote across all iterations) and the expected number of copies of the minor allele at each position (a fractional value between 0 and 2) for each individual. We obtained similar results running the haplotyping proce-dure for 50–100 iterations or using only a smaller number of iterations (10–20) to estimate model parameters and then calculating maximum likelihood estimates for the missing genotypes and allele counts. Different chromo-somes were analyzed in parallel and, overall, imputing genotypes for 2,335 unrelated individuals took o2 days for each of the largest chromosomes on a 2006 vintage 2.40 GHz Pentium Xeon processor. In total, we imputed genotypes for 2,266,562 SNPs per individual. On average, our method used stretches of150 kb from the HapMap CEU panel to reconstruct haplotypes for individuals in the FUSION sample.
IMPUTATION IN THE FUSION
GENOMEWIDE ASSOCIATION
STUDY
To evaluate the quality of imputed genotypes, we contrasted our estimates of the most likely genotypes and the expected number of copies of the minor allele with actual genotype data for three sets of markers: 521 SNP markers in a region of chromosome 14 previously examined to fine-map a candidate linkage region [Willer et al., 2006], 1,234 SNP markers selected to augment coverage of the Illumina 317K panel in regions surround-ing 222 candidate genes [Gaulton et al., 2008] and 12,702 markers with MAFo5% not included in the set of 290,690 markers used for imputation. We expected the last two panels of markers to be harder to impute, because they represent SNPs that are not well tagged by the Illumina 317K SNP chip or that have lower MAF. We observed that 98.60% of imputed alleles matched actual genotyped alleles in the fine-mapping panel, 96.24% in the candidate gene panel, and 98.73% in the low MAF SNP panel. Furthermore, the average r2 between imputed genotypes
and actual genotypes was 90.4, 79.1, and 74.0% in the three SNP panels, respectively. This represents an improvement of 14–39% compared to the best available single marker tags, which provided an averager2of 76.5, 52.8, and 35.5% in the three SNP panels, respectively.
MEASURES OF IMPUTATION
QUALITY
Our Markov Chain produces three estimates of imputa-tion quality and these can be used to focus analyses on subsets of high-quality genotypes. First, it produces a quality score that estimates the accuracy of each imputed genotype and is simply the proportion of iterations where the final imputed genotype (by taking a majority vote
across all iterations) was selected. Second, it produces an overall measure of the accuracy of imputation for each marker, which is the genotype quality score averaged across all individuals. Finally, by comparing the distribu-tion of sampled genotypes in each iteradistribu-tion with the estimated allele counts that result from averaging over all iterations, it produces an estimate of the r2 between imputed and true genotypes (seeMethodsfor more details). Quality measures for individual genotypes were good predictors of imputation accuracy (Supplementary Figure 1, Right Panel) and show that most imputed genotypes are called with a high degree of confidence (Supplementary Figure 1, Left Panel). For example, as measured by their quality scores, the top 95% of genotypes had average quality scores of 98.9% and actually matched experimental genotypes 98.6% of the time. Most of the errors affect a single allele so that, when measured on a per allele basis, concordance increases to 99.3%.
To avoid preferential removal of rare genotypes or alleles at each marker, we recommend using theper marker quality scores to select a subset of imputed SNPs for analysis, instead of theper genotypequality scores. Overall, we saw a correlation of 0.77 between the estimated and actual accuracy of imputed genotypes for each marker. We also saw a correlation of 0.84 between ther2estimated by our method and the actualr2
that resulted from comparing experimentally derived allele counts with their imputed estimates. Figure 1 shows the ROC curve [Pepe, 2003] for the two quality measures, showing that the estimatedr2
measure is a more effective way to identify poorly
0.0 0.2 0.4 0.6 0.8 1.0
0.0
0.2
0.4
0.6
0.8
1.0
Assessment of Quality Measures for Imputed Data
Proportion of good SNPs excluded ( r2 > .5)
Propor
tion of bad SNPs e
xcluded (
r
2 < .2)
Estimated r2 Estimated accuracy
imputed markers. In the FUSION GWAS scan [Scott et al., 2007], we used an r2 threshold of 0.30 to decide which markers were well imputed and should be included in further analyses, and which were not. At this threshold, we expect to remove 70% of poorly imputed markers (those wherer2with experimental genotypes iso20%) but only 0.50% of better imputed markers (those wherer2with experimental genotypes is450%).
IMPUTATION OF STRONGLY
ASSOCIATED SNPS
The results summarized so far compare a variety of imputed genotypes with experimentally derived counter-parts. However, a more interesting comparison focuses on
imputed genotypes that appear to show strong evidence for association, as those might motivate further down-stream experiments. To evaluate the accuracy of imputed genotypes for these ‘‘strongly associated SNPs,’’ we compared imputed and experimental genotypes in regions that were only selected for follow-up genotyping after imputation (for example, because imputed genotypes resulted in strong evidence for association but nearby genotyped markers did not). Table II summarizes the comparison of allele frequencies, association test statistics, and individual genotype calls between imputed genotypes and actual genotypes later determined by genotyping. Overall, it is clear that even among these strongly associated SNPs imputation provided accurate estimates of the true P-values. The largest observed discrepancies were for rs17384005, rs11646114, and rs4812831, which
TABLE II. Comparison of imputed and experimental genotypes for a subset of SNPs showing strong association in FUSION [Scott et al., 2007]
FUSION allele frequency
Analysis of imputed data
Analysis of actual genotypes
Max.r2
w/GWAS SNPs
Imputed vs.
Actual genotypes,r2 Observed
allelic
SNP Imputed Genotyped P-value OR P-value OR Actual Estimated concordance
rs12910827 0.035 0.033 2.5106
2.57 6.3106
2.20 0.39 0.843 0.720 0.994
rs1449725 0.579 0.573 5.3106 1.33 1.1105 1.31 0.90 0.965 0.977 0.990
rs17081352 0.075 0.078 7.3106 1.70 5.5106 1.68 0.87 0.989 0.954 1.000
rs11616188 0.502 0.545 1.5105 1.40 4.8105 1.27 0.27 0.755 0.585 0.919
rs10837766 0.138 0.152 1.5105 1.49 8.6105 1.40 0.46 0.822 0.930 0.975
rs11036627 0.080 0.071 1.7105 1.67 1.9105 1.66 0.75 0.876 0.901 0.987
rs17384005 0.175 0.149 1.9105 1.84 .011 1.15 0.11 0.241 0.309 0.874
rs7750445 0.138 0.158 2.0105 1.47 4.1105 1.41 0.50 0.836 0.965 0.977
rs2267339 0.640 0.643 2.8105 1.33 4.5106 1.34 0.72 0.951 0.873 0.990
rs17356414 0.580 0.715 3.0105 1.30 8.0104 1.25 0.34 0.562 0.920 0.878
rs1800774 0.664 0.696 3.9105 1.39 7.3106 1.35 0.29 0.861 0.617 0.972
rs175200 0.476 0.479 6.6105
1.28 5.5105
1.28 0.85 0.989 0.976 0.997
rs6103716 0.371 0.371 7.3105
1.28 4.8105
1.29 0.33 0.996 0.978 0.999
rs13297268 0.059 0.062 7.5105
1.72 9.0105
1.65 0.28 0.973 0.916 0.998
rs11646114 0.119 0.092 9.1105
1.66 .0020 1.38 0.13 0.687 0.512 0.956
rs2021966 0.609 0.603 9.1105
1.32 2.6104
1.25 0.46 0.811 0.769 0.937
rs1270874 0.231 0.224 1.4104
1.33 3.9104
1.30 0.24 0.933 0.954 0.988
rs4812831 0.165 0.129 1.6104
1.53 .0055 1.28 0.45 0.587 0.516 0.944
rs4402960 0.683 0.681 1.7104
1.27 1.2104
1.28 1.00 0.994 1.026 0.998
rs9402346 0.669 0.646 4.5104 1.26 .0014 1.22 0.62 0.881 0.915 0.965
rs10019985 0.629 0.619 4.8104 1.25 4.2104 1.25 0.66 0.990 0.953 0.998
rs2466291 0.579 0.618 6.3104 1.26 .0016 1.22 0.47 0.829 0.830 0.935
rs1409184 0.671 0.646 8.2104 1.26 .0011 1.22 0.58 0.865 0.873 0.963
rs8079544 0.091 0.106 8.9104 1.50 .013 1.27 0.22 0.707 0.731 0.961
rs1801282 0.165 0.165 9.5104 1.31 .0011 1.30 1.00 0.999 1.002 1.000
rs3802177 0.372 0.371 9.9104 1.23 .0012 1.22 1.00 0.996 1.015 0.999
The table shows a comparison of the results from analysis of imputed data with results for actual genotyping for a subset of the SNPs that
reached aP-value ofo103in our analysis of the FUSION data. Successive columns include SNP name, estimated allele frequency in
FUSION cases and controls, using either imputed data or actual genotype data,P-value and odds ratio for association test comparing allele
frequencies in cases and controls using imputed genotypes,P-value and odds ratio for association test comparing allele frequencies in cases
and controls using experimentally derived genotypes,r2between the best single marker tag in the GWAS panel and this SNP,r2between
imputed and observed genotypes (actualr2and estimated from our method as a measure of imputation quality) and, finally, proportion of
alleles matching between imputed and actual genotypes. Note that because these are all imputed SNPs that show strong association in the
FUSION data, they are subject to a ‘‘winner’s curse’’ effect. Thus, SNPs where imputation resulted in inflatedP-values were more likely to
be selected for follow-up in this analysis. Not all imputed SNPs showing association at this significance level were genotyped experimentally. Rather, a subset of SNPs was selected for genotyping either because (a) they showed substantially stronger evidence for association than other nearby genotyped SNPs and stronger evidence for association than nearby imputed SNPs or (b) they were selected to
improve coverage of the genome in and around 222 candidate genes [Gaulton et al., 2008]. All SNPs with aP-valueo103
were also the three markers for which our imputation approach estimated lower r2 with actual genotypes. Imputation is particularly useful because it allows evidence for association at SNPs with no reliable proxies to be evaluated more accurately. For instance, after imputation, averager2increased from 0.22 to 0.66 in the set of SNPs whose best genotyped proxy hadr2o0.30 and from 0.33 to 0.75 in the set of SNPs whose best genotyped proxy had r2o
0.5 [for specific examples of disease susceptibility loci that would be missed without imputa-tion, see Li et al., 2009b].
USING IMPUTATION TO ESTIMATE
PAIRWISE DISEQUILIBRIUM
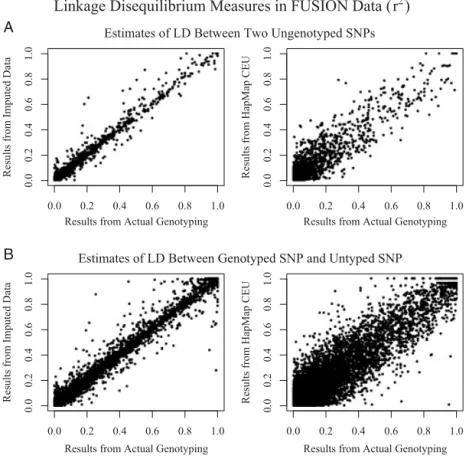
Remarkably, we observed that imputed genotypes could also be used to obtain very accurate estimates of LD between pairs of untyped markers, or of LD between a genotyped marker and an untyped marker. As shown in Figure 2, estimates of LD between two SNPs obtained using imputed data are much closer to the results obtained by actually genotyping the two SNPs than estimates obtained by looking up the two markers in the HapMap CEU database (Supplementary Figure 2 shows a similar comparison for D’ estimates). Even with some imprecision in estimates of individual genotypes, the increased sample
size compensates to reduce variation in the estimated LD measures.
COMPARISON OF DIFFERENT
GENOTYPING PLATFORMS
Our experience with the FUSION GWAS, summarized above, shows that imputation can be an effective way to estimate unobserved genotypes and/or allele counts. These genotypes can then be used in a variety of downstream analyses, including logistic regression analyses for discrete traits and linear regression analyses for quantitative traits, and to facilitate meta-analysis of studies based on different platforms. A key issue when consider-ing imputation-based approaches is whether similarly accurate estimates of unobserved data points can be obtained with different genotyping panels or in different populations [Clark and Li, 2007], and to evaluate this we conducted two additional experiments.
In the first experiment, we used genotype data generated by the International HapMap Consortium. We considered each of the HapMap samples in turn and masked available genotypes so as to mimic an experiment using one of several commercially available chips. For example, to evaluate the Affymetrix 500K SNP chip, we marked genotypes for all markers that are not on the chip as missing for the individual being considered. We then
A
B
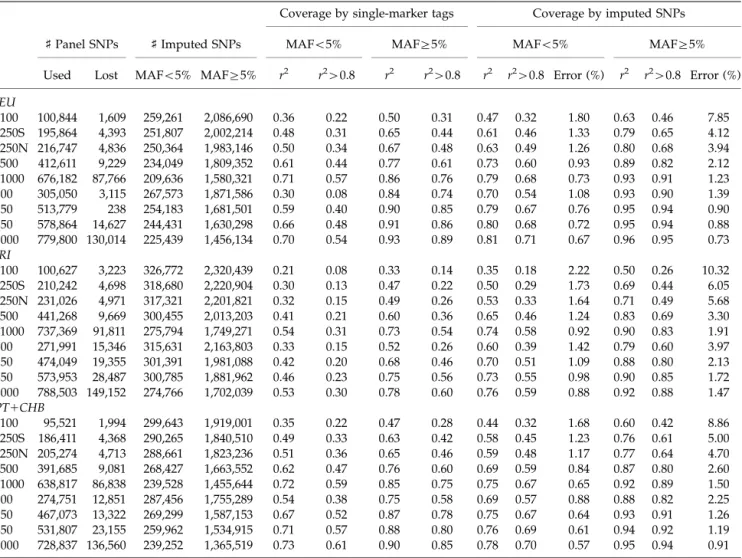
used haplotypes for the remaining individuals on the same HapMap analysis panel (either YRI, CEU, or JPT1CHB) to impute the missing genotypes. The results are summarized in Table III and clearly show that a large number of SNPs can be imputed very accurately using any of the commercially available panels (e.g. with r240.80 to experimental genotypes) and that, compared to relying on single marker tagging, imputation results in improved coverage of the genome.
Depending on the commercial panel and population being investigated, coverage of HapMap SNPs (proportion of SNPs withr240.80) increased by 10–30% for low MAF
alleles (MAFo5%) and by 10–20% for more common alleles (MAF45%). In agreement with this result, the
average r2 between each untyped SNP and imputed genotypes was up to 40% higher on average when using imputed genotypes than when using the best available single marker proxy. Imputation remained valuable even for panels with 1 million directly genotyped SNPs. In practice, the results shown in Table III are likely to represent an upper bound on the performance of our method in real settings, because additional errors will result from discrepancies in genotyping protocols between individual laboratories and the HapMap and from differences in LD patterns between the HapMap and the samples being studied. Nevertheless, they suggest our method is likely to be helpful for a variety of currently available commercial SNP panels.
TABLE III. Coverage of the Phase II HapMap with commercial genotyping panels, before and after imputation
Coverage by single-marker tags Coverage by imputed SNPs
]Panel SNPs ]Imputed SNPs MAFo5% MAFZ5% MAFo5% MAFZ5%
Used Lost MAFo5% MAFZ5% r2 r240.8 r2 r240.8 r2 r240.8 Error (%) r2 r240.8 Error (%)
CEU
A100 100,844 1,609 259,261 2,086,690 0.36 0.22 0.50 0.31 0.47 0.32 1.80 0.63 0.46 7.85
A250S 195,864 4,393 251,807 2,002,214 0.48 0.31 0.65 0.44 0.61 0.46 1.33 0.79 0.65 4.12
A250N 216,747 4,836 250,364 1,983,146 0.50 0.34 0.67 0.48 0.63 0.49 1.26 0.80 0.68 3.94
A500 412,611 9,229 234,049 1,809,352 0.61 0.44 0.77 0.61 0.73 0.60 0.93 0.89 0.82 2.12
A1000 676,182 87,766 209,636 1,580,321 0.71 0.57 0.86 0.76 0.79 0.68 0.73 0.93 0.91 1.23
I300 305,050 3,115 267,573 1,871,586 0.30 0.08 0.84 0.74 0.70 0.54 1.08 0.93 0.90 1.39
I550 513,779 238 254,183 1,681,501 0.59 0.40 0.90 0.85 0.79 0.67 0.76 0.95 0.94 0.90
I650 578,864 14,627 244,431 1,630,298 0.66 0.48 0.91 0.86 0.80 0.68 0.72 0.95 0.94 0.88
I1000 779,800 130,014 225,439 1,456,134 0.70 0.54 0.93 0.89 0.81 0.71 0.67 0.96 0.95 0.73
YRI
A100 100,627 3,223 326,772 2,320,439 0.21 0.08 0.33 0.14 0.35 0.18 2.22 0.50 0.26 10.32
A250S 210,242 4,698 318,680 2,220,904 0.30 0.13 0.47 0.22 0.50 0.29 1.73 0.69 0.44 6.05
A250N 231,026 4,971 317,321 2,201,821 0.32 0.15 0.49 0.26 0.53 0.33 1.64 0.71 0.49 5.68
A500 441,268 9,669 300,455 2,013,203 0.41 0.21 0.60 0.36 0.65 0.46 1.24 0.83 0.69 3.30
A1000 737,369 91,811 275,794 1,749,271 0.54 0.31 0.73 0.54 0.74 0.58 0.92 0.90 0.83 1.91
I300 271,991 15,346 315,631 2,163,803 0.33 0.15 0.52 0.26 0.60 0.39 1.42 0.79 0.60 3.97
I550 474,049 19,355 301,391 1,981,088 0.42 0.20 0.68 0.46 0.70 0.51 1.09 0.88 0.80 2.13
I650 573,953 28,487 300,785 1,881,962 0.46 0.23 0.75 0.56 0.73 0.55 0.98 0.90 0.85 1.72
I1000 788,503 149,152 274,766 1,702,039 0.53 0.30 0.78 0.60 0.76 0.59 0.88 0.92 0.88 1.47
JPT1CHB
A100 95,521 1,994 299,643 1,919,001 0.35 0.22 0.47 0.28 0.44 0.32 1.68 0.60 0.42 8.86
A250S 186,411 4,368 290,265 1,840,510 0.49 0.33 0.63 0.42 0.58 0.45 1.23 0.76 0.61 5.00
A250N 205,274 4,713 288,661 1,823,236 0.51 0.36 0.65 0.46 0.59 0.48 1.17 0.77 0.64 4.70
A500 391,685 9,081 268,427 1,663,552 0.62 0.47 0.76 0.60 0.69 0.59 0.84 0.87 0.80 2.60
A1000 638,817 86,838 239,528 1,455,644 0.72 0.59 0.85 0.75 0.75 0.67 0.65 0.92 0.89 1.50
I300 274,751 12,851 287,456 1,755,289 0.54 0.38 0.75 0.58 0.69 0.57 0.88 0.88 0.82 2.25
I550 467,073 13,322 269,299 1,587,153 0.67 0.52 0.87 0.78 0.75 0.67 0.64 0.93 0.91 1.26
I650 531,807 23,155 259,962 1,534,915 0.71 0.57 0.88 0.80 0.76 0.69 0.61 0.94 0.92 1.19
I1000 728,837 136,560 239,252 1,365,519 0.73 0.61 0.90 0.85 0.78 0.70 0.57 0.95 0.94 0.91
For each platform, the table lists the number of SNPs in the platform that overlap with the phased HapMap chromosomes (release 21a). The number of SNPs that were not in the phased HapMap are also listed, most of these were monomorphic. This number is followed by the
number of SNPs that we attempted to impute, either with minor allele frequencyo5% or45%. We did not attempt to impute singletons.
Coverage statistics using conventional single-marker tagging are provided and refer to the maximumr2between a HapMap SNP not on the
IMPUTATION IN DIVERSE
POPULATIONS
In a second experiment, we evaluated the performance of our method in 927 samples from 52 populations in the Human Genome Diversity Project (HGDP). In a previous evaluation of tag SNP portability, these 927 samples were genotyped for 1,864 SNPs in 32 autosomal regions (average minor allele frequency 0.15–0.24, depending on population) [Conrad et al., 2006]. The regions were selected to represent regions of high and low LD across the genome. Each region spanned330 kb, including a central ‘‘core’’ region of90 kb, where60 SNPs were attempted, and two120 kb flanking regions on either side, where12 SNPs were attempted. To evaluate the performance of genotype imputation across these diverse populations, we selected a thinned marker set including 872 SNPs spaced10 kb apart across all 32 regions. We then used these SNPs to impute genotypes for the remaining 992 SNPs and evaluated our approach.
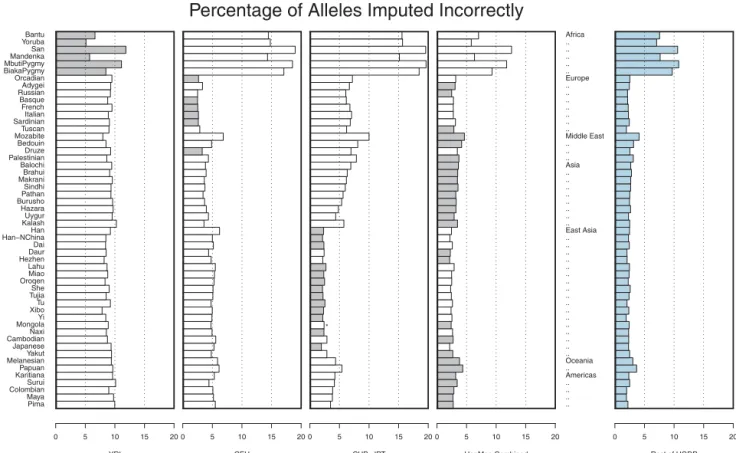
Figure 3 shows the proportion of incorrectly imputed alleles in each of the populations. Results are presented using a single HapMap analysis panel as a reference (either the CEU, YRI, or CHB1JPT) or using all HapMap samples as a larger reference panel. For each of the populations, the reference panel that resulted in the smallest overall error rate is highlighted. Overall, African samples were the most difficult to impute, with error rates
ranging between 5.13% for the Yoruba and 11.86% for the San when the HapMap YRI panel was used as a reference. In other parts of the world, we generally observed that the HapMap CEU provided a good reference panel for European populations and that the HapMap CHB1JPT provided a good reference panel for East Asian popula-tions, resulting in error rates of o3.34 and o2.89%, respectively. Outside Europe and East Asia, when imputa-tion was applied to populaimputa-tions from the Middle East, Central and South Asia, the Americas or Oceania, it was generally better to use the combined HapMap sample as a reference than to use any single HapMap analysis panel as a reference. It is interesting to note that, in all cases, combining the three HapMap panels into a single reference set was either the best option or the second best option. Furthermore, in situations where this combined reference panel reduced imputation accuracy, it resulted in an average increase of only 0.15% in error rates. Our results are consistent with those of Huang et al. [Huang et al., 2009] who showed, in a smaller subset of HGDP populations and a different set of genotyped SNPs, that combined reference panels could outperform panels that included only one population. The figure also illustrates that, when a large number of individuals are genotyped in study samples, it may be possible to bypass the HapMap reference panel altogether. In the last panel, rather than using the HapMap genotypes to impute missing data, we used a combined dataset including all other HGDP populations.
Percentage of Alleles Imputed Incorrectly
Pima Maya ColombianSurui KaritianaPapuan MelanesianYakut Japanese CambodianNaxi MongolaYi XiboTu TujiaShe OroqenMiao Lahu HezhenDaur Dai Han NChinaHan KalashUygur Hazara BurushoPathan Sindhi MakraniBrahui Balochi PalestinianDruze Bedouin MozabiteTuscan SardinianItalian French Basque Russian Adygei Orcadian BiakaPygmyMbutiPygmy MandenkaSan YorubaBantu
YRI
0 5 10 15 20
CEU
0 5 10 15 20
CHB+JPT
0 5 10 15 20
*
HapMap Combined
0 5 10 15 20
Africa .. .. .. .. .. Europe .. .. .. .. .. .. .. Middle East .. .. .. Asia .. .. .. .. .. .. .. .. East Asia .. .. .. .. .. .. .. .. .. .. .. .. .. .. .. .. .. Oceania .. Americas .. .. .. ..
Rest of HGDP
0 5 10 15 20
Figure 4 focuses on the estimatedr2between imputed and observed allele counts. In each stripe, accuracy of imputation is assessed using a different reference panel. Superimposed in pink is the coverage that would be provided by single marker tagging approaches. Broadly, it is clear that imputation using an appropriate reference panel will improve coverage. Using an inappropriate reference panel (for example using the HapMap CEU to impute genotypes for one of the African populations), can result in imputed genotypes and allele counts that are not as strongly correlated with the true genotypes as the best available single marker tag but, even then, the loss appears to be small. Importantly—in all cases—combining the three HapMap panels resulted in substantial improve-ments in coverage over single marker tagging—suggesting that this might be a cautious approach when the choice of reference panel is unclear. Combining the three HapMap panels is also a good choice for genotype imputation in admixed populations [Mathias et al., 2010] where, depend-ing on the ancestry of each stretch of the genome, the best matching haplotype will likely originate from a different HapMap reference panel. Our conclusion that the combined panel is a sensible reference for all populations facilitates practical decision making on the choice of reference panel. The conclusion is also supported by Huang et al. [Huang et al., 2009]. Although their aim was to find an optimal population-specific reference panel for each HGDP sample, their Figure 6 shows that a combined panel, including all HapMap
haplotypes is the best compromise choice, in the sense that it performs almost optimally in each of the 39 HGDP populations examined. In the future, we expect that imputation methods that weigh the different reference panels could further improve imputation quality.
IMPACT OF IMPUTATION ON
POWER OF ASSOCIATION STUDIES
Our evaluation of imputed genotypes in the FUSION, HapMap, and HGDP samples clearly shows that imputa-tion can be very accurate in a variety of populaimputa-tions. In this way, we believe it will be an important tool for combining results across studies that rely on different marker panels. To investigate whether using imputed genotypes might also improve power in individual studies, we carried out a simulation experiment. As previously described [Schaffner et al., 2005], we simulated 10,000 chromosomes for a series of 1 Mb regions. Within each region, simulated LD patterns mimicked the HapMap CEU or YRI [Schaffner et al., 2005]. We then used a subset of 120 simulated chromosomes to generate a region specific ‘‘HapMap.’’ As described in the methods, we then picked the minor allele for a randomly selected polymorphic site in each region as the ‘‘disease suscept-ibility allele’’ and simulated a set of 500 case and 500 control individuals using the remaining chromosomes.
Coverage at r
2Threshold .8
Pima Maya ColombianSurui KaritianaPapuan MelanesianYakut Japanese CambodianNaxi MongolaYi XiboTu TujiaShe OroqenMiao Lahu HezhenDaur Dai Han NChinaHan Kalash Uygur Hazara BurushoPathan Sindhi MakraniBrahui Balochi PalestinianDruze Bedouin Mozabite Tuscan SardinianItalian French Basque RussianAdygei Orcadian BiakaPygmyMbutiPygmy Mandenka San YorubaBantu
YRI
0 20 40 60 80
*
CEU
0 20 40 60 80
CHB + JPT
0 20 40 60 80
*
HapMap Combined
0 20 40 60 80
Africa .. .. .. .. .. Europe .. .. .. .. .. .. .. Middle East .. .. .. Asia .. .. .. .. .. .. .. .. East Asia .. .. .. .. .. .. .. .. .. .. .. .. .. .. .. .. .. Oceania .. Americas .. .. .. ..
Rest of HGDP
0 20 40 60 80
The susceptibility allele varied in frequency between 2.5 and 50%, with larger simulated effect sizes assigned to rarer alleles to ensure comparable power in a hypothetical fully genotyped sample. We also simulated 2,000 datasets where the disease allele had no effect to calibrate region-wide type I error rates for each approach.
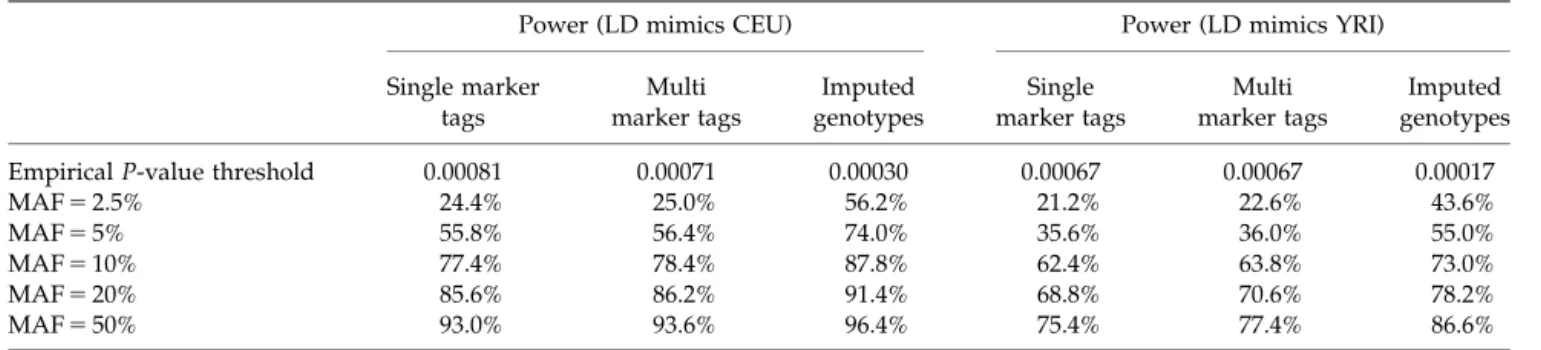
To analyze each region, we thinned SNPs in the simulated HapMap to match the density and allele frequency spectrum of the Phase II HapMap [The International HapMap Consortium, 2007]. Using the thinned data, we selected a panel of 100 tag SNPs for each region that included the 90 tag SNPs with the largest number of proxies and 10 additional SNPs selected at random among the remaining tags. This approach resulted in panels that captured 78% of the common variants (MAF45%) in the simulated CEU HapMap, similar to the real life performance of the Illumina 317 K SNP genotyp-ing chip. Finally, we analyzed each of the simulated datasets using the selected marker panel and one of three analysis strategies: (a) single marker chi-squared associa-tion tests, (b) single and multi-marker associaassocia-tion tests [Pe’er et al., 2006] as suggested by the PLINK [Purcell et al., 2007] program based on the simulated HapMap, or (c) tests using imputed allele counts for all the markers in the simulated HapMap. Results are summarized in Table IV. The first row in the table shows the significance thresholds used for each analysis (since approaches (b) and (c) both increase the total number of tests, note that the P-value threshold increases slightly when multi-marker tests are used and increases further when imputation is used). Subsequent rows summarize power for markers of different allele frequencies. In populations with strong LD, it is clear that for common susceptibility alleles the single marker tests provide high power and that imputation or multi-marker analyses provide only small gains in power.
However, for rarer alleles (such as those with frequencies
o5%), imputation can provide dramatic increases in power. For instance, power increased from 24.4 to 56.2% when the disease allele frequency was 2.5% and imputa-tion was used in the panel with CEU-like LD. As large genome scans and meta-analyses that are well-powered to evaluate rarer variants with modest effects are completed, we believe that imputation will become an increasingly important primary analysis and there are now examples of confirmed disease susceptibility loci that would have been missed without genotype imputation [Li et al., 2009b].
PRACTICAL CONSIDERATIONS
A key ingredient for any imputation-based approach is to ensure that alleles are consistently labeled across studies. In our evaluation of FUSION and HGDP samples, using the HapMap as a reference, we were fortunate that a subset of the HapMap individuals were genotyped in each study for quality control. Contrasting the genotypes for these quality control samples with those generated by the HapMap Consortium made the usually laborious process of ensuring consistent allele labeling across labs much easier. We strongly recommend that all labs conducting GWAS genotype a small number of HapMap individuals for this purpose.
Another practical consideration arises when integrating data from studies that use diverse genotyping platforms. Superficially, it is tempting to first impute missing genotypes in each sample and to then conduct a pooled analysis of all available data. However, this is almost never a good idea, as illustrated by a particularly extreme case where a set of cases and controls have been genotyped on two different plat-forms and a marker of interest has been genotyped in cases
TABLE IV. Imputed genotypes result in increased power
Power (LD mimics CEU) Power (LD mimics YRI)
Single marker tags
Multi marker tags
Imputed genotypes
Single marker tags
Multi marker tags
Imputed genotypes
EmpiricalP-value threshold 0.00081 0.00071 0.00030 0.00067 0.00067 0.00017
MAF52.5% 24.4% 25.0% 56.2% 21.2% 22.6% 43.6%
MAF55% 55.8% 56.4% 74.0% 35.6% 36.0% 55.0%
MAF510% 77.4% 78.4% 87.8% 62.4% 63.8% 73.0%
MAF520% 85.6% 86.2% 91.4% 68.8% 70.6% 78.2%
MAF550% 93.0% 93.6% 96.4% 75.4% 77.4% 86.6%
The table summarizes results from the analysis of two sets of 100 simulated 1 Mb regions. For each region, we generated a simulated
HapMap including200 SNPs and used this panel to pick 100 tag SNPs that provided good coverage of the region (averager20.8 in CEU,
0.6 in YRI). We then simulated and analyzed a series of case control studies, each with 500 cases and 500 controls. Association tests were
carried out at each tag SNP marker (‘‘Single Marker Tags’’), initially. These results were then augmented with the analysis of multi-marker tags as suggested by PLINK [Pe’er et al., 2006; Purcell et al., 2007] (‘‘Multi Marker Tags’’) or with the analysis of imputed genotypes (‘‘Imputed Genotypes’’). In each case, we first simulated and analyzed 2,000 null (20 per region) datasets by assigning a pair of random
chromosomes to each case and control. These analysis were used to establish the empiricalP-value threshold that, when applied to the most
significant result in each region, resulted in a type I error rate of 5%. Then, for each tabulated minor allele frequency (MAF), we simulated 500 case-control datasets (5 per region, 500 cases and 500 controls each) where a variant with the specified MAF was associated with
susceptibility. Power refers to the proportion of replicates where the topP-value exceeds the empiricalP-value threshold. Note that the
susceptibility variant was picked at random among all simulated SNPs with the requisite MAF and was not necessarily included in the tag SNP set or in the markers ascertained for each region specific HapMap. To ensure comparable power across varying MAF, we increased
genotype relative risk for rarer SNPs. Specifically, we set GRR52.500, 2.020, 1.715, 1.530, and 1.440 for SNPs with MAF52.5, 5, 10, 20 and
50%, respectively. These settings correspond to 80% power for single marker tests when the susceptibility variant is typed and aP-value
but must be imputed in controls. If the marker of interest cannot be well predicted by flanking markers, imputation will default to suggesting that the genotype distribution at that marker matches the reference panel—but this could be a very poor assumption if the reference panel and study sample have drifted apart, potentially resulting in spurious association. Even if the marker can be well predicted by flanking markers, it is possible that the reference panel and the case sample used different genotyping assays that, for technical reasons such as the presence of a polymorphism that overlaps assay primers, give consistently distinct results—again resulting in spurious association. To avoid these sources of spurious association, we recommend that, when analyzing genotype data generated using different platforms, different versions of the same platform, or using the same platform but with experiments carried out at different labs, an initial round of association analysis should be carried out using data from each platform/version/site combination. The results from this initial round of analysis can then be meta-analyzed, minimizing the risk of artifacts. This recommendation does preclude analyses where all cases are genotyped at one site, and all controls are genotyped at a different site.
In the experiments described so far, we illustrated the accuracy of genotype imputation that relies on existing resources (such as the Phase II HapMap) and genotyping technologies (including a variety of commercial genotyping chips). It is likely that both these resources and technolo-gies will continue to evolve rapidly and it is interesting to consider how these developments might impact imputa-tion-based approaches. For example, it is clear that genotyping chips of the future will be able to examine an ever larger number of tag SNPs in a cost-effective manner. Extrapolating from Table III, it is clear these should provide improved genomic coverage, eventually allowing investi-gators to impute nearly all HapMap SNPs with near perfect accuracy. Nevertheless, it is also clear from Table III that when coupled with imputation-based analyses even relatively low-density SNP chips can provide excellent coverage of the genome in populations with LD patterns similar to the CEU, JPT, and CHB. Thus, we expect the main advantages of new higher-density chips will be in the study of populations with less extensive LD, such as the YRI, and in the analysis of rarer variants.
THE FUTURE: LARGER REFERENCE
PANELS
Another interesting possibility to consider is the impact of larger HapMap reference panel on imputation or, similarly, the utility of using extra genotype data on a subset of individuals in a study to aid imputation in the remaining individuals in the study. To evaluate these possibilities, we generated a reference panel with varying numbers of Finnish individuals (between 30 and 500, see Table V) and used these reference panels to impute genotypes for 521 SNPs in an independent set of 500 individuals from the FUSION study of type II diabetes. Imputation accuracy and genomic coverage increase noticeably with the larger reference panels, with overall discrepancy rates between typed and untyped alleles as low as 0.40% when a reference panel of 500 unrelated individuals is available. One of the reasons for this increase in accuracy is that the length of haplotypes
shared between individuals in the reference panel and those in the study sample increases gradually as the size of the reference panel increases. For example, mosaic frag-ments used to reconstitute the FUSION samples using the individuals in the 500-sample reference panel were slightly
41 Mb long on average. These long stretches are easier for our Markov model to identify and are also likely to descend from a more recent common ancestor. This means they will have undergone fewer rounds of gene conversion and mutation, which gradually erode haplotype simila-rities and reduce the quality of our imputed genotypes. Overall, our results suggest that either genotyping a number of the study samples for markers of interest or increasing the size of the public reference panels will greatly improve the quality of genotype imputation.
THE FUTURE: COMBINING
IMPUTATION WITH NEW
SEQUENCING TECHNOLOGIES
With the rapid development of very high-throughput re-sequencing technologies [Bentley, 2006], it is oft proposed that genotyping-based approaches will soon become outdated. Re-sequencing-based approaches capture var-iants that are absent from public databases including, potentially, population specific variants. Our haplotyping approach can use whole genome re-sequencing data as input. In this setting, it uses information from individuals with similar haplotypes to reconstruct patterns of variation in regions where deep coverage is not available. In principle, the approach could be useful to help describe regions that, due to chance, are poorly covered in a particular sequencing experiment or to allow for econom-ical evaluation of many individuals. To evaluate the possibilities, we simulated data for ten 1 Mb regions and simulated shotgun sequence data for each region. We simulated reads that were only 32 base pairs long and with a per base-pair error rate of 0.2%. Very roughly, these correspond to the performance of early versions of next generation re-sequencing technologies; newer versions of these technologies can generate longer and more accurate reads and should thus outperform the simulations presented here. We then re-sequenced between 100 and 400 individuals at different depths and used our approach to reconstruct haplotypes and genotypes for each indivi-dual. Note that the simulated reads are typically too short to include useful information on phase (because they will generally include only zero or one sites that truly differ from the reference sequence). In addition, given the large number of bases examined, they will also suggest a large number of false polymorphic sites. To control false-positive variant calls, it is imperative to confirm true polymorphic sites either by examining overlapping similar reads from the same individual or, potentially, from other individuals who share a similar haplotype.
characterized4,000 polymorphic sites across the sampled individuals - 4 the SNP density of the Phase II HapMap. Even relatively light shotgun re-sequencing provided very accurate haplotypes for each individual. For example, when 400 individuals were sequenced at 4
depth, there were only 18.97 errors per individual on average (over 1,000,000 base-pairs). Across980,000 sites that were monomorphic in the population only 82 false polymorphisms were called on average. Accuracy was also excellent at sites that were polymorphic in the population. For example, 3,558 of the 3,641 simulated polymorphic sites with MAF40.5% were identified and, at these sites, alleles were called with an accuracy of 99.93% (see Tables VI and VII). For any given depth, imputed accuracy increased with the number of sequenced individuals (for example, accuracy at sites with MAF
40.5% was98.8% when 100 individuals were sequenced
at 2 coverage but increased to 99.7% when 400 individuals were sequenced at the same depth; the number of errors per individual decreased similarly from 106.3 per individual to 40.3 per individual). In addition, the depth required to achieve a given accuracy decreased as the number of sequenced individuals increased: achieving
99.9% accuracy for sites with population MAF 40.5% requires8 depth for 100 individuals, 6 depth in 200 individuals and only 4 depth in 400 individuals. In each case, note that error rates are higher at heterozygous sites than at homozygous sites. Again, performance of the approach with larger numbers of individuals improves because the mosaic fragments described by our model increase in length and, thus, become easier to find. This is also reflected in the accuracy of estimated haplotypes, which—when compared with simulated haplotypes— have 1 switch per 50 kb when 100 individuals are examined, but1 switch per 500 kb when 400 individuals are examined. We expect that combining shotgun re-sequencing of whole genomes with imputation-based approaches such as ours will allow economical association studies that evaluate SNP variation in large numbers of individuals even more exhaustively than is currently possible. Furthermore, we expect that whatever the characteristics of the re-sequencing technology used, it will be possible to improve the quality of estimated genotypes and haplotypes at each site by combining information across individuals, rather than simply in-creasing the depth at which each individual is sequenced. TABLE V. Effect of increasing reference panel size on imputation accuracy
Genotypic matching error rates
]Reference
panel size
Major allele homozygote
(%)
Heterozygote (%)
Minor allele
homozygote (%) Overall (%)
Allelic matching error (%)
Mean r2(%)
Median r2(%)
All SNPs
30 2.18 16.43 16.27 5.56 2.95 84.7 94.6
60 1.23 7.99 8.44 2.54 1.31 91.5 97.5
100 0.95 4.31 5.48 1.73 0.88 93.6 98.2
200 0.56 3.17 3.25 1.03 0.52 96.1 98.8
500 0.46 1.96 2.41 0.79 0.40 97.1 99.1
Best single SNP tag r2o0.5
30 3.54 46.55 43.96 11.00 5.94 63.5 66.2
60 2.09 28.29 25.64 5.73 2.99 76.4 82.5
100 1.93 14.17 19.32 3.89 2.00 82.0 87.9
200 1.35 11.96 13.19 2.68 1.37 87.5 91.3
500 1.04 6.76 9.06 2.00 1.02 91.0 94.6
MAFZ20%
30 3.18 10.14 11.92 6.96 3.74 85.4 94.7
60 1.83 4.03 5.50 3.13 1.62 92.7 97.7
100 1.32 2.75 3.63 2.15 1.10 95.2 98.7
200 0.82 1.68 2.36 1.30 0.66 97.0 98.9
500 0.69 1.31 1.60 1.01 0.51 97.7 99.2
MAFo20%
30 1.07 23.47 21.80 3.99 2.06 83.9 94.3
60 0.56 12.43 12.16 1.88 0.96 90.0 96.7
100 0.54 6.05 7.84 1.26 0.64 91.5 97.4
200 0.26 4.83 4.38 0.72 0.36 94.9 98.7
500 0.20 2.68 3.44 0.54 0.27 96.4 98.9
To evaluate the impact of a larger reference panel on the accuracy of genotype imputation, we used different numbers of individuals from the FUSION study genotype for markers on the Illumina 317K SNP chip and also 521 SNPs on a candidate region of chromosome 14 [Willer et al., 2006] to impute genotypes for an independent set of 500 FUSION individuals on whom only the Illumina 317K SNP chip genotypes
were available. The imputation procedure converged after300 rounds with panel size530 and 60,200 rounds with panel size5100, and
o100 rounds for panel sizes5200 or 500 individuals. Imputed genotypes were compared with experimental genotypes to determine
accuracy at the genotype and allele level and to evaluate ther2between true and imputed genotypes. Imputation accuracy measures are
T ABLE VI. Accuracy of imputed genotypes using shotgun sequence data as input 20,3 58 po lymorphic sites, segr ega ted acc or ding to po pulation fr equenc y 1,00 0,00 0 bases 979, 642 monom orphic sites 1671 6 sites with MA F o .5% 510 sites with M A F 0.5–1% 425 sites w ith MA F 1–2% 590 sites with MA F 2–5% 21 16 sites with MA F 4 5% Sequencin g dept h T otal investm ent A
verage length (in
T ABLE VII. Accuracy of imputed genotypes using shotgun sequence data as input, additional quality metrics 20,358 po lymorphic sites, segr ega ted acc or ding to popula tion fr equenc y 16,7 16 sites with MA F o 0.5% 510 sites with MA F 0.5–1% 425 sites with MA F 1–2% 590 sites with MAF 2–5% 21 16 sites with MAF 4 5% Sequenci ng dept h T otal investm ent All allelic acc uracy (%) Het allelic accu racy (%)
Dosage 2 r
(%) All allelic accu racy (%) H et alleli c accura cy (%) Dosag e r 2 (%) All allelic acc uracy (%) Het allelic accu racy (%)
Dosage 2 r
(%) All allelic accura cy (%) H et alleli c accura cy (%) Dosag e r 2 (%) All allelic acc uracy (%) Het allelic accu racy (%)
Dosage 2 r
DISCUSSION
In summary, we have described and evaluated a very effective model for haplotyping and genotype imputation in whole genome studies. The idea of genotype imputation is not new and was outlined as early as 2006 [Scheet and Stephens, 2006]. Here, we evaluate the practical perfor-mance of imputation based on a variety of genotyping platforms and populations, using both simulations and real data. We show that our model leads to imputed genotypes whose quality improves as more data becomes available, either because a larger reference panel is used or because study samples are genotyped in finer detail. Similarly, haplotype estimates improve in quality as more individuals are genotyped. Furthermore, we have intro-duced novel approaches for the analysis of short read shotgun sequencing data, which is likely to become extremely important as human geneticists move beyond chip-based genotyping to resequencing (as in the 1,000 Genomes Project, whose initial design was partly based on the simulations summarized in our Table VI, see http:// www.1000genomes.org for more details).
Other approaches for genotype imputation have been developed independently [Marchini et al., 2007; Servin and Stephens, 2007]. We expect that our results demon-strating the utility of larger reference panels, showing that the three HapMap analysis panels can be combined to better impute genotypes in populations that are genetically distant from the HapMap analysis panels, illustrating the ability of imputation-based approaches to estimate LD between untyped markers, and comparing the relative performance of imputation-based approaches for different commercial marker panels will apply when these alter-native approaches for genotype imputation are used. The approaches differ in the precise details of how they search for shared haplotype stretches and also in the efficiency of their computational implementations. For example, whereas [Marchini et al., 2007] rely on recombination rates generated by the HapMap Consortium and assume a uniform mutation/error rate for all markers, we estimate ‘‘recombination rates’’ within each dataset and allow ‘‘mutation rates’’ to vary. These parameters capture not only intrinsic characteristics of the markers and regions being examined, but also—for example—the genetic distance between the samples being imputed and the reference panel (which can impact apparent ‘‘recombina-tion rates’’) and differences in genotyping protocols between the two samples (which can impact apparent ‘‘mutation rates’’).
We expect that, in small samples, the use of external recombination rate estimates (as in IMPUTE) might be beneficial, but that with large sample sizes or in the presence of genotyping error our approach, which uses available data to model ‘‘recombination’’ and ‘‘mutation’’ rates should become advantageous. We performed two sets of preliminary comparisons of MaCH and IMPUTE. In the first experiment, we applied IMPUTE [Marchini et al., 2007] to the FUSION GWAS data for chromosome 14 and estimated genotypes for 521 previously genotyped mar-kers [Willer et al., 2006]. Genotypes estimated by IMPUTE and MaCH were identical in 99.2% of cases. In the cases where the two estimates differed, IMPUTE matched experimental genotypes 44.6% of the time, MaCH matched experimental genotypes 52.3% of the time, and both estimates were wrong 3.06% of the time. For the second
experiment, we applied IMPUTE to the HGDP data of Conrad et al. [2006]. Table VIII tabulates the proportion of markers imputed withr240.80 in each population using
TABLE VIII. MaCH vs. IMPUTE in the HGDP populations
Population Continental group
Best MaCH (%)
Best IMPUTE (%)
Bantu Africa 42.64 42.64
BiakaPygmy Africa 33.06 33.17
Mandenka Africa 51.31 50.71
MbutiPygmy Africa 29.74 30.44
San Africa 25.81 25.91
Yoruba Africa 52.42 53.93
Colombian Americas 58.06 57.46
Karitiana Americas 49.19 49.09
Maya Americas 67.14 66.43
Pima Americas 54.54 53.73
Surui Americas 45.56 45.36
Balochi Central South Asia 65.42 64.31
Brahui Central South Asia 66.63 65.02
Burusho Central South Asia 69.56 69.46
Hazara Central South Asia 69.05 68.15
Kalash Central South Asia 67.14 64.92
Makrani Central South Asia 69.56 67.44
Pathan Central South Asia 67.04 67.14
Sindhi Central South Asia 67.54 66.23
Uygur Central South Asia 70.77 69.35
Cambodian East Asia 65.83 64.52
Dai East Asia 62.90 62.60
Daur East Asia 64.42 64.92
Han East Asia 69.25 69.46
Han-NChina East Asia 63.21 62.00
Hezhen East Asia 65.42 65.02
Japanese East Asia 67.54 66.73
Lahu East Asia 60.69 61.09
Miao East Asia 62.80 61.69
Mongola East Asia 64.92 65.83
Naxi East Asia 62.30 62.10
Oroqen East Asia 69.76 69.35
She East Asia 62.80 63.10
Tu East Asia 67.24 66.94
Tujia East Asia 63.41 63.21
Xibo East Asia 65.12 64.72
Yakut East Asia 70.67 69.86
Yi East Asia 63.71 62.20
Adygei Europe 69.25 67.04
Basque Europe 73.39 72.68
French Europe 71.47 71.27
Italian Europe 70.67 70.26
Orcadian Europe 64.01 64.52
Russian Europe 72.58 71.88
Sardinian Europe 67.94 67.94
Tuscan Europe 64.01 64.92
Bedouin Middle East 63.71 62.40
Druze Middle East 66.73 66.83
Mozabite Middle East 63.71 63.51
Palestinian Middle East 67.94 66.03
Melanesian Oceania 56.75 56.15
Papuan Oceania 52.12 49.50
For each of the 52 HGDP populations, we picked the reference panel
(CEU, JPT1CHB, YRI, or three combined) that resulted in the
highest coverage (measured byr2
either MaCH or IMPUTE (in each case, we selected the HapMap reference panel that provided the best imputed genotypes). Overall, the two methods perform similarly. MaCH slightly outperforms IMPUTE in 37 out of 52 populations, slightly underperforms in 13 populations and the two methods are tied in the remaining two popula-tions. Our results are consistent with other published comparisons [Biernacka et al., 2009; Pei et al., 2008], which include detailed comparisons of the performance of MaCH and IMPUTE with each other and with alternative imputation approaches such as BEAGLE and fastPHASE. Our method uses an HMM to describe genetic variation along each haplotype. It is clear that when HMM models are applied to genetic data, many opportunities for identifying computational efficiencies exist [Abecasis et al., 2002; Gudbjartsson et al., 2000; Idury and Elston, 1997; Kruglyak and Lander, 1998; Lander and Green, 1987]. In the methods section we describe several optimizations that we have already implemented, includ-ing a general strategy for reducinclud-ing memory requirements for the Baum algorithm [Baum, 1972; Wheeler and Hughey, 2000]. We expect that further efficiencies will be forthcoming. Our model is implemented in the MaCH package (freely available with C11source code from our website, see http://www.sph.umich.edu/csg/abecasis/ mach/). Our implementation can be used to carry out all the analyses described in this paper. Specifically, it can estimate haplotypes, impute missing genotypes in a variety of populations, using the HapMap sample or another set of densely genotyped individuals as a reference, analyze shotgun re-sequencing data from high-throughput technologies now being developed, and carry out simple tests of association.
ACKNOWLEDGMENTS
We thank Mike Boehnke, Karen Mohlke, and the other FUSION investigators for helpful discussions. This re-search was supported by rere-search grants from the NIMH, NHLBI, and the NHGRI to GRA.
REFERENCES
Abecasis GR, Cherny SS, Cookson WO, Cardon LR. 2002. Merlin— rapid analysis of dense genetic maps using sparse gene flow trees. Nat Genet 30:97–01.
Barrett JC, Cardon LR. 2006. Evaluating coverage of genome-wide association studies. Nat Genet 38:659–662.
Baum LE. 1972. An inequality and associated maximization technique in statistical estimation for probabilistic functions of Markov processes. Inequalities 3:1–8.
Bentley DR. 2006. Whole-genome re-sequencing. Curr Opin Genet Dev 16:545–552.
Biernacka JM, Tang R, Li J, McDonnell SK, Rabe KG, Sinnwell JP, Rider DN, de Andrade M, Goode EL, Fridley BL. 2009. Assessment of genotype imputation methods. BMC Proc 3:S5.
Browning SR. 2006. Multilocus association mapping using variable-length Markov chains. Am J Hum Genet 78:903–913.
Burdick JT, Chen WM, Abecasis GR, Cheung VG. 2006. In silico method for inferring genotypes in pedigrees. Nat Genet 38: 1002–1004.
Carlson CS, Eberle MA, Rieder MJ, Smith JD, Kruglyak L, Nickerson DA. 2003. Additional SNPs and linkage-disequilibrium analyses are necessary for whole-genome association studies in humans. Nat Genet 33:518–521.
Carlson CS, Eberle MA, Rieder MJ, Yi Q, Kruglyak L, Nickerson DA. 2004. Selecting a maximally informative set of single-nucleotide polymorphisms for association analyses using linkage disequili-brium. Am J Hum Genet 74:106–120.
Clark AG, Li J. 2007. Conjuring SNPs to detect associations. Nat Genet 39:815–816.
Conrad DF, Jakobsson M, Coop G, Wen X, Wall JD, Rosenberg NA, Pritchard JK. 2006. A worldwide survey of haplotype variation and linkage disequilibrium in the human genome. Nat Genet 38: 1251–1260.
Daly MJ, Rioux JD, Schaffner SE, Hudson TJ, Lander ES. 2001. High-resolution haplotype structure in the human genome. Nat Genet 29:229–232.
de Bakker PI, Yelensky R, Pe’er I, Gabriel SB, Daly MJ, Altshuler D. 2005. Efficiency and power in genetic association studies. Nat Genet 37:1217–1223.
Gaulton KJ, Willer CJ, Li Y, Scott LJ, Conneely KN, Jackson AU, Duren WL, Chines PS, Narisu N, Bonnycastle LL, Luo J, Tong M, Sprau AG, Pugh EW, Doheny KF, Valle TT, Abecasis GR, Tuomilehto J, Bergman RN, Collins FS, Boehnke M, Mohlke KL. 2008. Comprehensive association study of type 2 diabetes and related quantitative traits with 222 candidate genes. Diabetes 57: 3136–3144.
Gudbjartsson DF, Jonasson K, Frigge ML, Kong A. 2000. Allegro, a new computer program for multipoint linkage analysis. Nat Genet 25:12–13.
Hirschhorn JN, Daly MJ. 2005. Genome-wide association studies for common diseases and complex traits. Nat Rev Genet 6:95–108. Huang L, Li Y, Singleton AB, Hardy JA, Abecasis G, Rosenberg NA, Scheet P. 2009. Genotype-imputation accuracy across worldwide human populations. Am J Hum Genet 84:235–250.
Idury RM, Elston RC. 1997. A faster and more general hidden Markov model algorithm for multipoint likelihood calculations. Hum Hered 47:197–202.
Kruglyak L, Daly MJ, Reeve-Daly MP, Lander ES. 1996. Parametric and nonparametric linkage analysis: a unified multipoint approach. Am J Hum Genet 58:1347–1363.
Kruglyak L, Lander ES. 1998. Faster multipoint linkage analysis using Fourier transforms. J Comput Biol 5:1–7.
Lander ES, Green P. 1987. Construction of multilocus genetic linkage maps in humans. Proc Natl Acad Sci USA 84:2363–2367. Lettre G, Jackson AU, Gieger C, Schumacher FR, Berndt SI, Sanna S,
Eyheramendy S, Voight BF, Butler JL, Guiducci C, Illig T, Hackett R, Heid IM, Jacobs KB, Lyssenko V, Uda M, Boehnke M, Chanock SJ, Groop LC, Hu FB, Isomaa B, Kraft P, Peltonen L, Salomaa V, Schlessinger D, Hunter DJ, Hayes RB, Abecasis GR, Wichmann HE, Mohlke KL, Hirschhorn JN. 2008. Identification of ten loci associated with height highlights new biological pathways in human growth. Nat Genet 40:584–591.
Li H, Handsaker B, Wysoker A, Fennell T, Ruan J, Homer N, Marth G, Abecasis G, Durbin R. 2009a. The Sequence Alignment/Map format and SAMtools. Bioinformatics 25:2078–2079.
Li H, Ruan J, Durbin R. 2008. Mapping short DNA sequencing reads and calling variants using mapping quality scores. Genome Res 18:1851–1858.
Li N, Stephens M. 2003. Modeling linkage disequilibrium and identifying recombination hotspots using single-nucleotide poly-morphism data. Genetics 165:2213–2233.
Li Y, Willer CJ, Sanna S, Abecasis GR. 2009b. Genotype imputation. Annu Rev Genomics Hum Genet 10:387–406.
Lin S, Chakravarti A, Cutler DJ. 2004. Exhaustive allelic transmission disequilibrium tests as a new approach to genome-wide associa-tion studies. Nat Genet 36:1181–1188.
Marchini J, Howie B, Myers S, McVean G, Donnelly P. 2007. A new multipoint method for genome-wide association studies by imputation of genotypes. Nat Genet 39:906–913.
Markianos K, Daly MJ, Kruglyak L. 2001. Efficient multipoint linkage analysis through reduction of inheritance space. Am J Hum Genet 68:963–977.
Mathias RA, Grant AV, Rafaels N, Hand T, Gao L, Vergara C, Tsai YJ, Yang M, Campbell M, Foster C, Gao P, Togias A, Hansel NN, Diette G, Adkinson NF, Liu MC, Faruque M, Dunston GM, Watson HR, Bracken MB, Hoh J, Maul P, Maul T, Jedlicka AE, Murray T, Hetmanski JB, Ashworth R, Ongaco CM, Hetrick KN, Doheny KF, Pugh EW, Rotimi CN, Ford J, Eng C, Burchard EG, Sleiman PM, Hakonarson H, Forno E, Raby BA, Weiss ST, Scott AF, Kabesch M, Liang L, Abecasis G, Moffatt MF, Cookson WO, Ruczinski I, Beaty TH, Barnes KC. 2010. A genome-wide association study on African-ancestry populations for asthma. J Allergy Clin Immunol 125:336–346.
Mott R, Talbot CJ, Turri MG, Collins AC, Flint J. 2000. A method for fine mapping quantitative trait loci in outbred animal stocks. Proc Natl Acad Sci USA 97:12649–12654.
Nicolae DL. 2006. Testing untyped alleles (TUNA)-applications to genome-wide association studies. Genet Epidemiol 30:718–727. Pe’er I, de Bakker PI, Maller J, Yelensky R, Altshuler D, Daly MJ. 2006.
Evaluating and improving power in whole-genome association studies using fixed marker sets. Nat Genet 38:663–667.
Pei YF, Li J, Zhang L, Papasian CJ, Deng HW. 2008. Analyses and comparison of accuracy of different genotype imputation methods. PLoS One 3:e3551.
Pepe MS. 2003. The Statistical Evaluation of Medical Tests for Classification and Prediction. Oxford, UK: Oxford University Press. Purcell S, Neale B, Todd-Brown K, Thomas L, Ferreira MAR, Bender D, Maller J, de Bakker PIW, Daly MJ, Sham PC. 2007. PLINK: a toolset for whole genome association and population-based linkage analyses. Am J Hum Genet 81:559–575.
Qin ZS, Niu T, Liu JS. 2002. Partition-ligation-expectation-maximization algorithm for haplotype inference with single-nucleotide poly-morphisms. Am J Hum Genet 71:1242–1247.
Sanna S, Jackson AU, Nagaraja R, Willer CJ, Chen WM,
Bonnycastle LL, Shen H, Timpson NJ, Lettre G, Usala G, Chines PS, Stringham HM, Scott LJ, Dei M, Lai S, Albai G, Crisponi L, Naitza S, Doheny KF, Pugh EW, Ben-Shlomo Y, Ebrahim S, Lawlor DA, Bergman RN, Watanabe RM, Uda M,
Tuomilehto J, Coresh J, Hirschhorn JN, Shuldiner AR,
Schlessinger D, Collins FS, Davey Smith G, Boerwinkle E, Cao A, Boehnke M, Abecasis GR, Mohlke KL. 2008. Common variants in the GDF5 region are associated with variation in human height. Nat Genet 40:198–203.
Schaffner SF, Foo C, Gabriel S, Reich D, Daly MJ, Altshuler D. 2005. Calibrating a coalescent simulation of human genome sequence variation. Genome Res 15:1576–1583.
Scheet P, Stephens M. 2006. A fast and flexible statistical model for large-scale population genotype data: applications to inferring missing genotypes and haplotypic phase. Am J Hum Genet 78:629–644. Scott LJ, Mohlke KL, Bonnycastle LL, Willer CJ, Li Y, Duren WL,
Erdos MR, Stringham HM, Chines PS, Jackson AU, Prokunina-Olsson L, Ding CJ, Swift AJ, Narisu N, Hu T, Pruim R, Xiao R, Li XY, Conneely KN, Riebow NL, Sprau AG, Tong M, White PP, Hetrick KN, Barnhart MW, Bark CW, Goldstein JL, Watkins L, Xiang F, Saramies J, Buchanan TA, Watanabe RM, Valle TT, Kinnunen L, Abecasis GR, Pugh EW, Doheny KF, Bergman RN, Tuomilehto J, Collins FS, Boehnke M. 2007. A genome-wide association study of type 2 diabetes in Finns detects multiple susceptibility variants. Science 316:1341–1345.
Servin B, Stephens M. 2007. Imputation-based analysis of association studies: candidate regions and quantitative traits. PLoS Genet 3:e114.
Stephens M, Scheet P. 2005a. Accounting for decay of linkage disequilibrium in haplotype inference and missing-data imputa-tion. Am J Hum Genet 76:449–462.
Stephens M, Scheet P. 2005b. Accounting for decay of linkage disequilibrium in haplotype inference and missing-data imputa-tion. Am J Hum Genet 76:449–462.
Stephens M, Smith NJ, Donnelly P. 2001. A new statistical method for haplotype reconstruction from population data. Am J Hum Genet 68:978–989.
The International HapMap Consortium. 2005. The International HapMap Project. Nature 437:1299–1320.
The International HapMap Consortium. 2007. A second generation human haplotype map of over 3.1 million SNPs. Nature 449:851–861. Wheeler R, Hughey R. 2000. Optimizing reduced-space sequence
analysis. Bioinformatics 16:1082–1090.
Willer CJ, Scott LJ, Bonnycastle LL, Jackson AU, Chines P, Pruim R, Bark CW, Tsai YY, Pugh EW, Doheny KF, Kinnunen L, Valle TT, Bergman RN, Tuomilehto J, Collins FS, Boehnke M. 2006. Tag SNP selection for Finnish individuals based on the CEPH Utah HapMap database. Genet Epidemiol 30:180–190.
Willer CJ, Sanna S, Jackson AU, Scuteri A, Bonnycastle LL, Clarke R, Heath SC, Timpson NJ, Najjar SS, Stringham HM, Strait J, Duren WL, Maschio A, Busonero F, Mulas A, Albai G, Swift AJ, Morken MA, Narisu N, Bennett D, Parish S, Shen H, Galan P, Meneton P, Hercberg S, Zelenika D, Chen WM, Li Y, Scott LJ, Scheet PA, Sundvall J, Watanabe RM, Nagaraja R, Ebrahim S, Lawlor DA, Ben-Shlomo Y, Davey-Smith G, Shuldiner AR, Collins R, Bergman RN, Uda M, Tuomilehto J, Cao A, Collins FS, Lakatta E, Lathrop GM, Boehnke M, Schlessinger D, Mohlke KL, Abecasis GR. 2008. Newly identified loci that influence lipid concentrations and risk of coronary artery disease. Nat Genet 40:161–169.
Willer CJ, Speliotes EK, Loos RJF, Li S, Lindgren CM, Heid IM, Berndt SI, Elliott AL, Jackson AU, Lamina C, Lettre G, Lim N, Lyon HN, McCarroll SA, Papadakis K, Qi L, Randall JC, Roccasecca RM, Sanna S, Scheet P, Weedon MN, Wheeler E, Zhao JH, Jacobs LC, Prokopenko I, Soranzo N, Tanaka T, Timpson NJ, Almgren P, Bennett A, Bergman RN, Bingham SA, Bonnycastle LL, Brown M, Burtt NP, Chines P, Coin L, Collins FS, Connell JM, Cooper C, Smith GD, Dennison EM, Deodhar P, Elliott P, Erdos MR, Estrada K, Evans DM, Gianniny L, Gieger C, Gillson CJ, Guiducci C, Hackett R, Hadley D, Hall AS, Havulinna AS, Hebebrand J, Hofman A, Isomaa B, Jacobs KB, Johnson T, Jousilahti P, Jovanovic Z, Khaw KT, Kraft P, Kuokkanen M, Kuusisto J, Laitinen J, Lakatta EG, Luan J, Luben RN, Mangino M, McArdle WL, Meitinger T, Mulas A, Munroe PB, Narisu N, Ness AR, Northstone K, O’Rahilly S, Purmann C, Rees MG, Ridderstrale M, Ring SM, Rivadeneira F, Ruokonen A, Sandhu MS, Saramies J, Scott LJ, Scuteri A, Silander K, Sims MA, Song K, Stephens J, Stevens S,
Stringham HM, Tung YC, Valle TT, Van Duijn CM,
Vimaleswaran KS, Vollenweider P, Waeber G, Wallace C, Watanabe RM, Waterworth DM, Watkins N, Witteman JC, Zeggini E, Zhai G, Zillikens MC, Altshuler D, Caulfield MJ, Chanock SJ, Farooqi IS, Ferrucci L, Guralnik JM, Hattersley AT,
Hu FB, Jarvelin MR, Laakso M, Mooser V, Ong KK,
Ouwehand WH, Salomaa V, Samani NJ, Spector TD, Tuomi T, Tuomilehto J, Uda M, Uitterlinden AG, Wareham NJ, Deloukas P, Frayling TM, Groop LC, Hayes RB, Hunter DJ, Mohlke KL, Peltonen L, Schlessinger D, Strachan DP, Wichmann HE,
McCarthy MI, Boehnke M, Barroso I, Abecasis GR,
Hirschhorn JN, The Genetic Investigation of ANthropometric Traits (GIANT) 2009. Six new loci associated with body mass index highlight a neuronal influence on body weight regulation. Nat Genet 41:25–34.

![TABLE II. Comparison of imputed and experimental genotypes for a subset of SNPs showing strong association in FUSION [Scott et al., 2007]](https://thumb-us.123doks.com/thumbv2/123dok_us/8341289.2215516/4.892.62.809.333.811/table-comparison-imputed-experimental-genotypes-showing-association-fusion.webp)