108
Genetic algorithm-based optimization approach for an
uncapacitated single allocation P-hub center problem with more
realistic cost structure
Masoud Rabbani 1*, Hamed Farrokhi-Asl 2, Razieh Heidari 2 1
School of Industrial Engineering, College of Engineering, University of Tehran, Tehran, Iran 2
School of Industrial Engineering, Iran University of Science & Technology, Tehran, Iran
[email protected], [email protected], [email protected]
Abstract
A p-hub center network design problem consists of some nodes as hubs and allocation of non-hub nodes to them wherein the maximum travel times between any pair of nodes is minimized. The distinctive feature of this study is proposing a new mathematical formulation for modeling costs in a p-hub center problem. Here, instead of considering costs as a linear function of distance, for the first time, we formulate costs as a summation of different parts: fixed cost, health, safety and environment (HSE) cost, energy cost and personnel cost. Such integrated model results in a hard-to-solve nonlinear formulation. To validate the proposed model, a small scale problem instance of CAB dataset solved by LINGO software. We also prepared a Genetic Algorithm (GA) by MATLAB software to solve complete problems of CAB and AP datasets.
Keywords: Hub location problem, un-capacitated single allocation p-hub center problem, stepwise cost function, genetic algorithm.
1- Introduction
Hubs are some facilities that are widely used in transportation, telecommunication and logistic networks such as airline passengers, data transmissions, and express packages to organize the network routs, taking into account cost considerations. Aggregating some allocated non-hub nodes with indirect routs in order to decrease the cost of flows is the function of a hub in such systems. Therefore, determining the location of hub nodes and allocating non-hub nodes to them is a challenging task and plays potentially results in lower network costs.
Many studies in the context of hub location problems have been focused on two significant criteria (Farahani et al., 2013). The first one tries to minimize the maximum distance between each pair of nodes that is called p-hub center problem and originally represented by Campbell (1994) while the other one attempts to minimize the total sum of distances in the network and is frequently referred to as p-hub median problem (Campbell, 1996). The way in which non-hub nodes may be allocated to hub nodes is another approach to classify the previous studies. Accordingly, Hub Location Problems (HLPs) can be
*corresponding author
ISSN: 1735-8272, Copyright c 2017 JISE. All rights reserved
Journal of Industrial and Systems Engineering
Vol. 10, No. 1, pp 108-124 Winter (January) 2017
109
categorized into two separate groups, including single allocation HLPs when a non-hub node must be allocated to a single hub (Abyazi-Sani and Ghanbari, 2016) and multiple allocation HLPs when multiple allocation of non-hub nodes is permitted (Rabbani and Kazemi, 2015).
Kara and Tansel (2000) developed a new modeling for single-assignment p-hub center problem and investigated the computational performance of the proposed model and various linear versions of Campbell’s model. The results of this study indicated that the new model is substantially superior than linearization method of the old model in terms of required CPU times. Formulation of the single p-hub center allocation problem was improved by Ernst et al. (2002). They defined maximum gathering costs between hub k and its allocated nodes as radius of hub k. By considering the number of hubs as a decision variable of the problem that must be minimized regarding all trip times between each pair of nodes are within predetermined bounds, Kara and Tansel (2003) proposed an integer programming formulation of the hub covering problem. The better performance in both CPU time as well as core storage requirements was superiority of their model than the linearization of the old model. A real-world application of single allocation HLP was studied by Aversa et al. (2005). They developed a mixed integer programming model to select a transportation hub port in the East Coast of South American among 11 alternatives with the least port and shipping costs. Unlike previous studies that assume direct connections between hub center and its assigned demand centers, Yaman et al. (2007) proposed a new formulation which allows stopovers for the latest arrival hub location problem. In their new modeling for ground p-hub location problem, some overlooked aspects like loading and unloading time were taken into account. Eiselt and Marianov (2009) formulated the hub location problem by considering customers’ interests. They assumed the customers choose an airline depending on a mixture function of flying time and fare. This study consists of three phases; at first they tried to study customer’s behavior as the flow,then formulated the model and finally solved some instances of the model. A study on un-capacitated hub center problems with either single or multiple allocations was conducted by Ernst et al. (2009). They investigated the problem of finding an optimal single allocation with integer programming formulations for both problems. Hwang and Lee (2012) developed an un-capacitated single allocation p-hub maximal covering problem in a network with the assumption of specific hub number and deadline for traveling time in order to maximize the demand centers covered. O’Kelly (2012) considered environmental factors in hub location problems. In this study, the author assumed the amount of consumed fuel as an indicator for environmental cost. Rabbani et al. (2013) tried to propose a new model on economic aspects by considering the total flow between nodes in a p-hub center single allocation problem. An extension of the classical single allocation HLP considered multiple types of flow was introduced by Correia et al. (2014). Three mixed integer programming formulation were proposed for the purpose of minimizing the total cost, including setup costs for the hubs, setup cost for each product in each hub, and flow routing costs. Investigation of hub maximal covering problem under uncertain shipments was carried out by Zade et al. (2014). A bi-objective mathematical formulation was developed for this problem based upon two bi-objectives of maximizing coverage as well as maximizing safety of the paths. The work was done by Rahimi et al. (2016) is another study that addresses HLP under uncertainty. Rostami et al. (2015) tried to make HLPs more realistic through applying a stepwise cost function rather than a linear function of the transport volume in modeling the problem. In other words, this cost function considers vehicle sizes directly in the model. A recently introduced extension of the well-known HLP, i.e. tree HLP with an incomplete graph was addressed by Sedehzadeh et al. (2015). In addition to environmental aspects, their study considers different transportation modes between hubs as well as a set of capacity levels for each potential hub.
Ernst et al. (2009) claimed that the problem of finding an optimal single allocation with respect to a given set of hubs is a NP-hard problem. They defined an integer programming formulation for both p-hub center and p-hub median problems. They used branch and bound method for solving the problem and showed that their formulation is better than the previous one on the basis of numerical result. Meyer et al. (2009) proposed a two-phase algorithm to solve p-hub center single allocation problem. In the first phase, they computed a group of optimal hub combinations by a method based on branch and bound algorithm. In phase 2, they continued with a degraded size formulation to complete the allocation. They used an Ant Colony Optimization (ACO) approach to achieve a good upper bound. According to the authors’ claim, it
110
is possible to achieve optimal solution for larger problems in shorter times by using the algorithm. Consequently, they could provide the exact solution for problems larger than those studied before. Topcuoglu et al. (2005) tried to use the pattern of Genetic Algorithm (GA) to solve un-capacitated hub location problems. They compared the results obtained through GA with optimal solutions and they presented a new solution based on a genetic pattern framework. The objective was to exploit the features of GAs in finding the number of hubs, the location of hubs, and the assignment of spokes to the hubs but they did not consider stepwise functions in the algorithm. Kratica and Stanimirović (2006) pointed out that GA is potentially useful metaheuristic for solving other similar hub location problems. They solved un-capacitated multiple allocation p-hub center problem by this method and concentrated on an exacting variant of hub location problem. Their solution approach required a reasonable amount of computational time, even for problem instances of higher dimensions. Computational results have demonstrated that the GA can reach all optimal solutions obtained by commercial optimization solvers for smaller problem dimensions (Stanimirović, 2012, Damgacioglu et al., 2015). Bashiri et al. (2013) applied a GA based heuristic algorithm to handle the capacitated p-hub center problem which considers qualitative parameters such as quality of service and capability for development in the future along with quantitative parameters. The results of this study showed a reasonable average gap between optimal solutions and obtained solutions by the GA heuristic approach. The study was carried out by Alizadeh et al. (2016) is a sample for application of GAs in multi-objective capacitated hub maximal covering problem. Authors also worked on other metaheuristics such as tabu search algorithm (Abyazi-Sani and Ghanbari, 2016) and Particle Swarm Optimization (PSO) algorithm (Ghaderi and Rahmaniani, 2016).
By considering the aforementioned literature on the HLPs, it is obvious that economic aspects play conventionally the most significant role on choosing a network.However, nowadays sole consideration of these aspects leads to immature modeling of the real challenges. This study aims to overcome this shortcoming. The unique feature of this study is developing an integrated model for p-hub center problem considering flow dependent costs that encompass hubs establishment fixed costs, health, safety and environmental (HSE) costs, and energy and personnel costs. These costs are modeled by step functions of flow. Such modeling of costs results in a more balanced and fair design of hub networks.
The rest of this study is structured as follows: Section 2 provides a description of the problem and its formulation. Methodology is presented in Section 3. Section 4 is assigned to the parameters tuning for solution approach and numerical results for problem instances. Finally, Conclusion remarks are provided in Section 5.
2- Problem definition and formulation
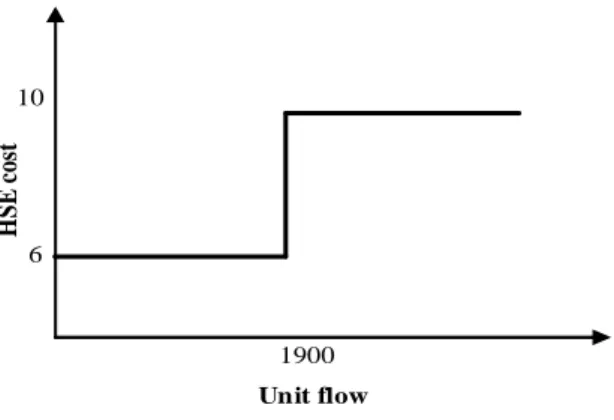
While keeping the structure of the classical un-capacitated single allocation HLP, this study tries to provide a new approach for computing the system costs. In other words, we assumed that the costs are step functions of bigness of hub. This assumption is based on this real fact that every time a hub covers more flow, this does not mean this hub should be larger. As the covered flow increases, form a critical flow (the break points in the diagrams) we must establish a larger hub, consequently we must pay more and here is where the diagram jump to next step.
Consider a hub-spoke network that p hubs must be selected among all possible locations with the following assumptions that are as follows:
• This is a single allocation problem with direct way between all hubs. • It is assumed that hubs have infinite capacity.
• Each non-hub node must be assigned to only one hub. • Direct shipment between non-hub nodes is not permitted.
• Sum of total flow which goes from a hub is an indicator for estimating bigness of hub.
• It is assumed that the costs, including personnel costs, energy costs, and HSE costs are step functions of bigness of hub and a fixed cost for its establishing.
• The mentioned stepwise functions are supposed to be determined by experts. • A sample stepwise function for HSE costs is illustrated in Figure 1.
111 • All of the parameters assumed to be deterministic.
Unit flow
H
S
E
c
os
t
1900 6
10
Figure 1. A sample of stepwise function for HSE costs of a given hub
By considering the aforementioned assumptions, a new mixed integer formulation is presented for p-hub center problem in this section based upon following notations. The objective function and constraints of this formulation are modelled in terms of equations (1) to (9).
Indices
index of nodes; = 1, … , index of nodes; = 1, … , index of hubs; = 1, … , index of hubs; = 1, … ,
Input parameters
flow between node and distance between node and personnel cost for -th hub energy cost for -th hub HSE cost for -th hub
fixed cost of establishing a hub at node cost discount factor
112
Decision variables
binary variable ( = 1 if spoke is servicing by -th hub; otherwise 0) binary variable ( = 1 if node is hub; otherwise 0)
cost of a unit of flow between node and the bigness of -th hub
consists of personnel costs , energy costs , and HSE costs
(1) . .
× ( × + × $× × $+ $× $) ≤ ; ∀ , , , (2)
= ) ) ( ×
$
; ∀ , (3)
+ × $× *( + )+( $+ $)
$ + $+
+ $× $)
= + + ; ∀ (4)
= ) × + , ; ∀ (5)
) = (6)
) = 1 ; ∀ (7)
≤ ; ∀ , (8)
, ∈ {0,1} ; ∀ , (9)
Both of equations (1) and (2) denote that this is a p-hub center problem which tries to minimize the maximum travelling cost between every pair of origin-destination points. Equations (3) state the way of calculating cost of a unit of flow between two nodes ( ) used in equations (2). Actually, is the amount of cost for traveling from origin node to hub , then to hub and finally arrive to destination node . At this point, different types of cost, including fixed cost of establishing a hub center and other cost with respect to bigness of each hub center are considered. According to equations (4), these costs consist of three major parts, including personnel costs, energy costs, and HSE costs as mentioned before. In equations (5), summation of flows which goes through the hub represents an indicator for estimating
113
bigness of each hub. Constraint (6) guarantees that the number of hubs will be equal to . Single allocation characteristic of the problem is ensured through constraints (7). Constraints (8) denote that a non-hub node can only be assigned to a node, only if a hub has been previously established at this node. Finally, constraints (9) define the binary variables in the model.
3- Methodology
Non-linear nature of the proposed model as well as the NP-hard nature of the problem proven in previous studies makes us to apply a proper metaheuristic algorithm for designing large scale hub-spoke networks in a reasonable time. The big networks have been solved through GA because of time limitation for network designing, like a network with 15 nodes that have been solved by LINGO software in one hour. Therefore, applicability of GA in handling large scale hub location problem is the main reason of its implementation in this study.
3-1- Solution representation
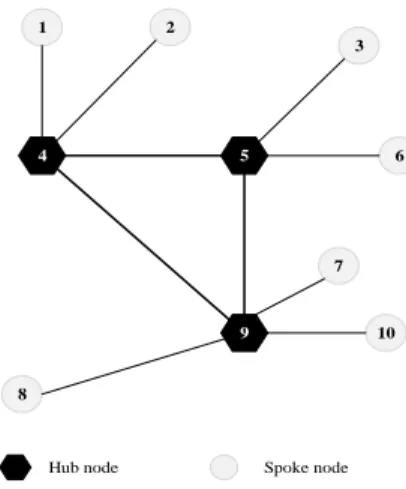
Genetic procedure begins with some random solutions and tries to find better hub locations and its nodes allocation in order to optimize the better previous solutions. So we need to have a chromosome that it should be able to distinguish hubs and its allocated nodes. Consider a hub-spoke network consisting of 3 hubs must be selected among 10 locations that are shown in Figure 2. In this figure, established hubs are shown with black pentagons (nodes 4, 5, and 9) and white circles (1,2,3,6,7,8, and 10) are related to spokes which are served by hubs.
4 5
9
1 2
3
6
7
10
8
Hub node Spoke node
Figure 2. A single allocation hub-spoke network
A sample chromosome for this system has 10 genes whose values are equal to location number if the location is a hub node, otherwise the number of its allocated hub. Figure 3 shows an example of a chromosome. As you can see in the figure, nodes 4, 5 and 9 are selected as hub centers and their values are equal to their numbers. Furthermore, the values of nodes 1 and 2 that assigned to hub 4 are equal to 4. The value 5 is assigned to nodes 3 and 6 and finally the value 9 is assigned to nodes 7, 8, and 10. Consequently, we would have a chromosome with three different values 4, 5 and 9.
114 3-2- Proposed GA
GA is a well-suited optimization approach for handling large scale optimization problems in various areas that introduced by (Holland, 1975). A genetic search procedure begins with a randomly generated initial population. Therefore, first of all we need to have some chromosomes formed in two steps:
• Step 1: Select p nodes randomly as hubs and give them their order number.
• Step 2: Randomly choose a hub value and assign it to the first non-hub node. Keep on this procedure with the next non-hub nodes.
The randomly generated population members are evaluated based upon a fitness function computed by objective function value of related solution. The members are further manipulated by using three main operators to generate the next generation that are as follows:
• Selection: This operator selects individuals in the population that will be survive. Roulette Wheel selection method as a stochastic sampling operator is used for this purpose in this study. According to this method, better-fitted solutions will survive with higher probability.
• Crossover: The operation of crossover in the proposed GA is performed based upon a single-point crossover operator. In this method, an integer value is randomly selected as crossover point. Afterwards, two selected parents swap their gens. For example, consider two selected chromosomes with length 10 and random crossover point 7. The last three genes of each parents (i.e. genes 8, 9, and 10) changed between them and developed couple of new chromosomes as two Offspring. Figure 4 depicts this procedure.
Figure 4. Implementation of single-point crossover operator
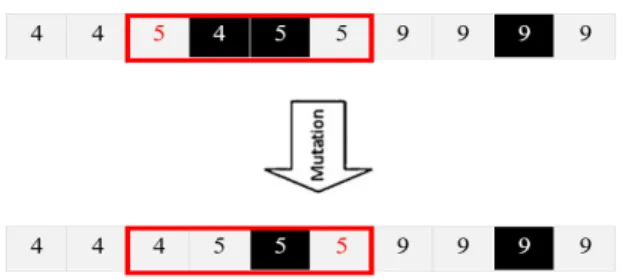
• Mutation: This operation tries to produce irregular chromosomes to exit for local optimum solutions. New chromosome consists of a selected parent by selection operator with changes between gen associated with the first random integer value and its next gens until another random integer value. For example, Figure 5 shows how to implement this operator for a selected chromosome with length 10 and two random integer values 3 and 6.
115
Figure 5. Implementation of mutation operator
According to figures 4 and 5, it is obvious that applying this crossover and mutation techniques do not guarantee the feasibility of the newborn chromosomes. In other words, there is a possibility that some newborn chromosomes gain more or less hubs than their parents as well as there exist nodes that are allocated to non-hub nodes. Therefore, overcoming this infeasibility needs to follow these steps are listed below.
• Step 1: Set different values assigned to offspring genes as possible hub nodes.
• Step 2: Choose p hubs randomly among possible hub nodes as Offspring hubs and assign not selected possible hubs to offspring hubs randomly.
• Step 3: Randomly choose offspring hubs for not correct allocated nodes. • Step 4: Set correct offspring as new born chromosome.
The steps involved in the proposed GA is illustrated in flowchart of Figure 6.
Start
Randomly generate initial population
Evaluate the fitness value of individuals
Selection of the individuals
Apply crossover operator Apply mutation operator
Generate new population Stopping criterion is
satisfied? Stop
No Yes
116
4- Numerical results
4-1- Model validation
To obtain a profound understanding of the novel formulation, in this section the model is solved for a sample data set taken from CAB dataset. Dataset have accessed through the following website: http://brunel.ac.uk.
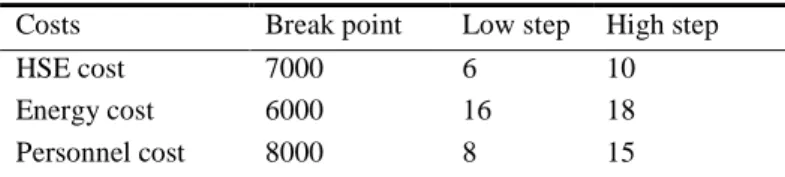
For this example, we have extracted the needed data from CAB dataset for asimple problem with total number of three nodes where number of hubs ( ) is set to two. While distance data ( ) and flow data ( ) given in Tables 1 and 2 respectively are taken from CAB, the other required data such as data used for fixed cost, Health, Safety and Environment (HSE) cost, energy cost and personnel cost are randomly generated by the authors. Since these costs, as mentioned above, are stepwise functions of flow routed form a hub node, simple two-step functions with one breaking point are considered for each of them given in Table 3. For example, if the flow passing through a hub node is less than 7000 units, the associated HSE costs will be equal to 6 units, otherwise it takes the other value (here for example 10). This is also the same for the other functions. The data for fixed costs of establishing a hub center at nodes 1, 2 and 3 are randomly generated as 84, 92 and 70, respectively. Also, the parameters and , are assumed to be equal to 0.8 and 1, respectively.
Table . The distance data taken from CAB dataset
Table 2. The flow data taken from CAB dataset
To From
Node
1 2 3
Node
1 0 6469 7629
2 6469 0 12999
3 7629 12999 0
Table 3. The stepwise functions for different costs
Costs Break point Low step High step
HSE cost 7000 6 10
Energy cost 6000 16 18 Personnel cost 8000 8 15
This small scale test problem was coded and solved by LINGO 11.0 on a PC with 2.2 GHz CPU and 2 MB RAM. The following global optimum solution was found at iteration 858 in less than 1 second. Table 4 shows optimum solution costs and flow for the problem, Table 5 shows the hub and its nodes connections. The optimum objective function value for the problem is equal to 4.8829E+06 unit that is
To
From Node
1 2 3
Node
1 0 576.9631 946.4954 2 576.9631 0 369.5327 3 946.4954 369.5327 0
117
the minimum of maximum travelling cost between every pair of origin-destination points which each pair of connectivity cost shows in Table 6.
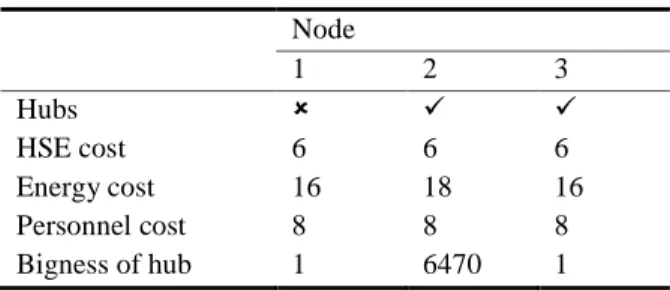
Table 4. Optimum solution (part 1)
Node
1 2 3
Hubs
HSE cost 6 6 6
Energy cost 16 18 16 Personnel cost 8 8 8 Bigness of hub 1 6470 1
Table 5. Hubs and their nodes connection (part 2)
To From
Node
1 2 3
Node
1 0 0 0
2 1 1 0
3 0 0 1
Table 6. Travelling cost between different nodes (part 3)
To From
Node
1 2 3
Node
1 1153.9 577.0 577.0 2 577.0 2217214.0 375.6 3 577.0 4894604.0 160.0
Note that the answer obtained through proposed genetic algorithm is equal to the global optimum value reported above.
4-2- Test problems
In this part, CAB as well as Australia Post (AP) datasets and their reduced examples with different number of hubs ( ) will be solved by the proposed GA is programmed in MATLAB R2012a. Datasets have accessed through the following website: http://people.brunel.ac.uk.
Similar to the small scale illustrative example, distance and flow are taken from CAB and AP and the other data are randomly generated. Since cost data, as mentioned in the previous sub-section, are stepwise functions of flow routed form a hub node, simple two-step functions with one breaking point are considered for these costs presented in Table 3 with discount factor 0.8, 0.2, 0.5, and 1.0 and parameter , that is assumed to be equal to 1. Furthermore, since fixed cost and overhead costs are not considered in datasets, we generate them randomly that listed below.
118
• For AP dataset: 84, 92, 70, 80, 90, 28, 98, 58, 45, 54, 65, 88, 88, 48, 15, 45, 45, 54, 45, 45, 85, 45, 65, 44, 55.
• For CAB dataset: 68, 63, 73, 67, 71, 76, 57, 69, 54, 70, 72, 52, 75, 51, 59, 54, 56, 55, 57, 65, 74, 77, 61, 53, 58, 68, 68, 74, 58, 67, 54, 57, 74, 78, 67, 68, 79, 78, 76, 57, 54, 78, 66, 52, 57, 66, 50, 53, 78, 51, 77, 55, 54, 59, 63, 80, 51, 77, 58, 55, 77, 66, 67, 53, 65, 68, 60, 79, 69, 77, 72, 60, 73, 51, 55, 57, 65, 54, 68, 78, 66, 70, 74, 57, 64, 56, 77, 53, 77, 68, 79, 56, 64, 67, 71, 72, 74, 69, 76, 51, 60, 64, 59, 75, 52, 76, 68, 74, 76, 51, 63, 79, 71, 78, 72, 61, 74, 76, 58, 50, 66, 65, 75, 73, 67, 57, 57, 54, 59, 67, 50, 52, 70, 79, 58, 58, 58, 60, 64, 80, 78, 52, 58, 59, 62, 70, 79, 53, 59, 54, 75, 61, 56, 77, 65, 72, 72, 79, 62, 54, 58, 62, 50, 76, 61, 51, 53, 65, 66, 68, 65, 70, 61, 59, 65, 76, 61, 70, 73, 50, 69, 60, 58, 64, 62, 75, 60, 55, 68, 59, 74, 71, 64, 60, 69, 60, 77, 73, 79, 56.
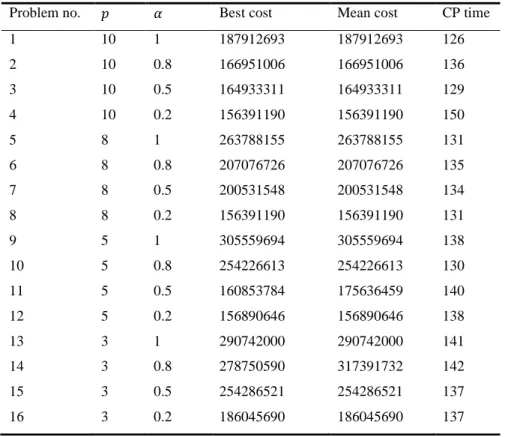
The computational results of the capacitated p-hub center location and allocation problem which tries to minimize the maximum route cost of network are reported below. Table 7 to Table 10 is assigned to results of problem instances related to CAB dataset. Results of AP dataset instances are shown in Table 11 too.
Table 7. Center CAB data set for =25
Problem no. Best cost Mean cost CP time
1 10 1 187912693 187912693 126
2 10 0.8 166951006 166951006 136 3 10 0.5 164933311 164933311 129 4 10 0.2 156391190 156391190 150
5 8 1 263788155 263788155 131
6 8 0.8 207076726 207076726 135
7 8 0.5 200531548 200531548 134
8 8 0.2 156391190 156391190 131
9 5 1 305559694 305559694 138
10 5 0.8 254226613 254226613 130 11 5 0.5 160853784 175636459 140 12 5 0.2 156890646 156890646 138
13 3 1 290742000 290742000 141
14 3 0.8 278750590 317391732 142 15 3 0.5 254286521 254286521 137 16 3 0.2 186045690 186045690 137
119
Table 8. Center CAB data set for =20
Problem no. Best cost Mean cost CP time
17 10 1 175329211 175329211 80.25
18 10 0.8 161485849 161485849 80.75
19 10 0.5 145569629 145569629 79.38
20 10 0.2 127427450 127427450 80.39
21 8 1 215985701 224038745 86.64
22 8 0.8 185144638 185144638 87.47
23 8 0.5 135647829 135647829 83.99
24 8 0.2 124565457 124565457 86.00
25 5 1 250114515 250114515 91.91
26 5 0.8 246444939 246444939 85.08
27 5 0.5 166926712 166926712 85.95
28 5 0.2 129423145 129423145 83.48
29 3 1 250114419 250114419 86.91
30 3 0.8 211562201 211562201 85.44
31 3 0.5 173057839 173057839 85.04
32 3 0.2 171965906 175240703 88.24
Table 9. Center CAB data set for =18
Problem no. Best cost Mean cost CP time
33 10 1 252878545 252878545 105
34 10 0.8 161485849 161485849 104
35 10 0.5 129423295 129423295 73.10
36 10 0.2 89990422 89990422 90.97
37 8 1 198750834 198750834 65.96
38 8 0.8 175329211 175329211 69.23
39 8 0.5 129423453 129423453 72.09
40 8 0.2 105956506 105956506 73.09
41 5 1 252878545 252878545 64.45
42 5 0.8 250537869 250537869 67.20
43 5 0.5 160617354 160617354 68.35
44 5 0.2 129423600 129423600 63.37
45 3 1 227703688 251553552 84.69
46 3 0.8 219894703 219894703 66.03
47 3 0.5 187344189 187344189 68.25
120
Table 10. Center CAB data set for =15
Problem no. Best cost Mean cost CP time
49 10 1 53561144 53561144 56.33
50 10 0.8 48158465 48158465 47.04 51 10 0.5 47103750 47103750 60.28 52 10 0.2 29184301 29184301 55.79
53 8 1 72430908 72430908 84.68
54 8 0.8 57628265 57628265 45.84 55 8 0.5 60805771 60805771 81.77 56 8 0.2 45524600 45524600 67.66
57 5 1 93755196 93755196 67.60
58 5 0.8 81718253 90870116 55.63 59 5 0.5 50459684 50459684 89.47 60 5 0.2 42921079 42921079 50.37
61 3 1 81600531 101398957 71.38
62 3 0.8 70532584 82462805 51.86 63 3 0.5 55031268 84686130 47.45 64 3 0.2 53020024 53020024 88.91
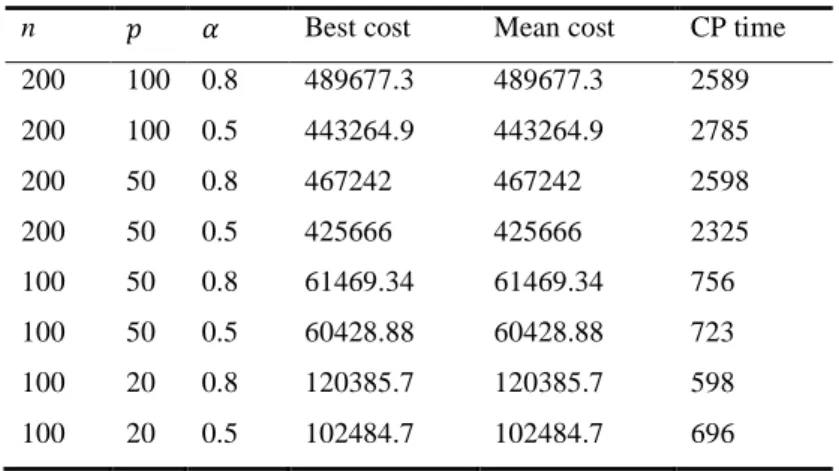
Table 11. Center Australia Post data set
n Best cost Mean cost CP time 200 100 0.8 489677.3 489677.3 2589 200 100 0.5 443264.9 443264.9 2785 200 50 0.8 467242 467242 2598 200 50 0.5 425666 425666 2325 100 50 0.8 61469.34 61469.34 756 100 50 0.5 60428.88 60428.88 723 100 20 0.8 120385.7 120385.7 598 100 20 0.5 102484.7 102484.7 696
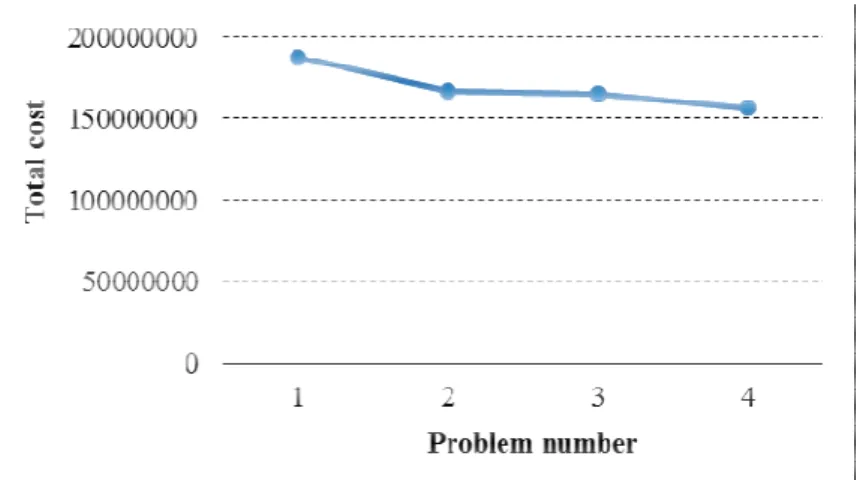
Three important points can be derived from the computational results:
• Discount factor is a very effective parameter for a problem and Figure 7 shows this fact. In this figure, the total cost of the first four problem instances of CAB dataset taken from Table 7 are compared (four problems with = 25 and = 10 under different values).
• There exists an indirect relation between the bigness of network and the minisum solution for this new formulation. This point is illustrated in Figure 8.
0 50000000 100000000 150000000 200000000 250000000 300000000 350000000
1 3 5 7
T
o
ta
l
C
o
st
Figure 8
1 3 5 7 9 0.00E+00
5.00E+01 1.00E+02 1.50E+02 2.00E+02 2.50E+02
C
P
t
im
e
Figure 9. Computational time evaluation (
121
Figure 7. Discount factor evaluation
9 11 13 15 17 19 21 23 25 27 29 31 33 35 37 39 41 43 45 47 49 51
Problem number best cost
mean cost
Figure 8. Cost evaluation (taken from Tables 7 to 10)
9 11 13 15 17 19 21 23 25 27 29 31 33 35 37 39 41 43 45 47 49 51
Problem number
Computational time evaluation (taken from Tables 7 to 10)
51 53 55 57 59 61 63
51 53 55 57 59 61 63
122
5- Conclusions
This paper developed a new mathematical formulation for a p-hub center problem in terms of modeling the costs. Actually, instead of modeling costs as a linear function of distance, we can formulate costs as a combination of different parts: fixed cost, HSE cost, energy cost and personnel cost. After presenting the model along with its in-depth explanation, the model was solved for a small scale test problem to show its validity and provide a deep understanding for the respected reader. The only problem with the proposed modeling is its high degree of nonlinearity. Accordingly, we applied a Genetic Algorithm (GA) to solve the problems, especially medium and large scale problems in a reasonable computational time.
References
Abyazi-Sani, R. & Ghanbari, R. 2016. An efficient tabu search for solving the uncapacitated single allocation hub location problem. Computers & Industrial Engineering, 93, 99-109.
Alizadeh, Y., Tavakkoli-Moghaddam, R. & Ebrahimnejad, S. 2016. A new multi-objective model for a capacitated hub covering problem solving by two multi-objective evolutionary algorithms. International Journal of Mathematics in Operational Research, 9, 99-124.
Aversa, R., Botter, R., Haralambides, H. & Yoshizaki, H. 2005. A mixed integer programming model on the location of a hub port in the east coast of South America. Maritime Economics & Logistics, 7, 1-18. Bashiri, M., Mirzaei, M. & Randall, M. 2013. Modeling fuzzy capacitated p-hub center problem and a genetic algorithm solution. Applied Mathematical Modelling, 37, 3513-3525.
Campbell, J. F. 1994. Integer programming formulations of discrete hub location problems. European Journal of Operational Research, 72, 387-405.
Campbell, J. F. 1996. Hub location and the p-hub median problem. Operations Research, 44, 923-935. Correia, I., Nickel, S. & Saldanha-Da-Gama, F. 2014. Multi-product capacitated single-allocation hub location problems: formulations and inequalities. Networks and Spatial Economics, 14, 1-25.
Damgacioglu, H., Dinler, D., Ozdemirel, N. E. & Iyigun, C. 2015. A genetic algorithm for the uncapacitated single allocation planar hub location problem. Computers & Operations Research, 62, 224-236.
Eiselt, H. A. & Marianov, V. 2009. A conditional p-hub location problem with attraction functions. Computers & Operations Research, 36, 3128-3135.
Ernst, A., Hamacher, H., Jiang, H., Krishnamoorthy, M. & Woeginger, G. 2002. Heuristic algorithms for the uncapacitated hub center single allocation problem. Unpublished Report, CSIRO Mathematical and Information Sciences, Australia.
Ernst, A. T., Hamacher, H., Jiang, H., Krishnamoorthy, M. & Woeginger, G. 2009. Uncapacitated single and multiple allocation p-hub center problems. Computers & Operations Research, 36, 2230-2241. Farahani, R. Z., Hekmatfar, M., Arabani, A. B. & Nikbakhsh, E. 2013. Hub location problems: A review of models, classification, solution techniques, and applications. Computers & Industrial Engineering, 64, 1096-1109.
123
Ghaderi, A. & Rahmaniani, R. 2016. Meta-heuristic solution approaches for robust single allocation p-hub median problem with stochastic demands and travel times. The International Journal of Advanced Manufacturing Technology, 82, 1627-1647.
Holland, J. H. 1975. Adaptation in natural and artificial systems: an introductory analysis with applications to biology, control, and artificial intelligence, U Michigan Press.
Hwang, Y. H. & Lee, Y. H. 2012. Uncapacitated single allocation p-hub maximal covering problem. Computers & Industrial Engineering, 63, 382-389.
Kara, B. & Tansel, B. 2003. The single-assignment hub covering problem: Models and linearizations. Journal of the Operational Research Society, 54, 59-64.
Kara, B. Y. & TANSEL, B. C. 2000. On the single-assignment p-hub center problem. European Journal of Operational Research, 125, 648-655.
Kratica, J. & Stanimirovic, Z. 2006. Solving the uncapacitated multiple allocation p-hub center problem by genetic algorithm. Asia-Pacific Journal of Operational Research, 23, 425-437.
Meyer, T., Ernst, A. T. & Krishnamoorthy, M. 2009. A 2-phase algorithm for solving the single allocation p-hub center problem. Computers & Operations Research, 36, 3143-3151.
O’kelly, M. E. 2012. Fuel burn and environmental implications of airline hub networks. Transportation Research Part D: Transport and Environment, 17, 555-567.
Rabbani, M. & Kazemi, S. 2015. Solving uncapacitated multiple allocation p-hub center problem by Dijkstra’s algorithm-based genetic algorithm and simulated annealing. International Journal of Industrial Engineering Computations, 6, 405-418.
Rabbani, M., Zameni, S. & Kazemi, S. M. Proposing a new mathematical formulation for modeling costs in a p-hub center problem. Modeling, Simulation and Applied Optimization (ICMSAO), 2013 5th International Conference on, 2013. IEEE, 1-4.
Rahimi, Y., Tavakkoli-Moghaddam, R., Mohammadi, M. & Sadeghi, M. 2016. Multi-objective hub network design under uncertainty considering congestion: An M/M/c/K queue system. Applied Mathematical Modelling, 40, 4179-4198.
Rostami, B., Meier, J., Buchheim, C. & Clausen, U. 2015. The uncapacitated single allocation p-hub median problem with stepwise cost function. Tech. rep., Optimization Online.
Sedehzadeh, S., Tavakkoli-Moghaddam, R., Baboli, A. & Mohammadi, M. 2015. Optimization of a multi-modal tree hub location network with transportation energy consumption: A fuzzy approach. Journal of Intelligent & Fuzzy Systems, 30, 43-60.
Stanimirovic, Z. 2012. A genetic algorithm approach for the capacitated single allocation p-hub median problem. Computing and Informatics, 29, 117-132.
Topcuoglu, H., Corut, F., Ermis, M. & Yilmaz, G. 2005. Solving the uncapacitated hub location problem using genetic algorithms. Computers & Operations Research, 32, 967-984.
124
Yaman, H., Kara, B. Y. & Tansel, B. Ç. 2007. The latest arrival hub location problem for cargo delivery systems with stopovers. Transportation Research Part B: Methodological, 41, 906-919.
Zade, A. E., Sadegheih, A. & Lotfi, M. M. 2014. A modified NSGA-II solution for a new multi-objective hub maximal covering problem under uncertain shipments. Journal of Industrial Engineering International, 10, 185-197.