I would first like to thank my brilliant advisor, Dr. Tiago Pires. His insight taught me a
lot, and without it, I would have been completely lost trying to complete this project. I would
like to also thank Dr. Klara Peter, gave direction and guidance when I needed it and pushed me
to make progress in a timely manner. Finally, a thank-you to my peers, Sarah Flinn and Sagar
Abstract
With the growing trend of internet penetration, researchers have conducted studies to
determine its economic implications. Specifically, many studies have sought to determine what,
if any, effect does internet penetration have on market competition. This study seeks to
contribute to this body of work by examining the internet and competition in the movie industry.
While previous studies have used variables such as product pricing as measures of competition,
this study looks at indicators of market structure, such as the distribution of market shares and
the Herfindahl Index. Ultimately, the results indicate that internet penetration may increase the
market shares of smaller studios while decreasing the market shares of smaller and mid-sized
ones. Moreover, the effect may be more pronounced when the internet is first introduced than
when it grows thereafter. Finally, the study yields no conclusive results for whether internet
I. Introduction
The internet is a technological breakthrough, and its use has increased over the past few
decades. This is a trend with important implications for the dynamic of firms and consumers
optimizing. Consumers, for example, may face lower information costs, and therefore be better
equipped to maximize utility by finding a better match to their tastes or a higher quality product.
On the other hand, firms may have greater access to information about consumers which, when
harnessed properly, enables them to gain an advantage in maximizing profit. Additionally,
internet acts as a medium through which products can be advertised, and certain firms may gain
an edge by more effectively exploiting it.
As a result, one might reasonably expect the internet to affect the overall structure of
markets. Just how it affects markets, however, is unclear, as these aforementioned effects are not
necessarily in the same direction. In the former case, with greater consumer access to
information, the market in question might look more competitive and less concentrated. Indeed,
consumers may discover films from small or independent studios that they may not have
otherwise. For the latter cases, the direction of the effect depends on what types of firms gain the
advantage: less concentrated if it is the smaller firms, and more concentrated if it is the larger
ones. For instance, large firms might be able to easily make the investments necessary to obtain
information about consumers—such as browsing history—which would allow them to more
effectively market their products. Thus, market shares would become more concentrated among
larger firms.
Taking the sum of these conflicting effects, one would obtain the extent of the internet’s
empirical work in order to evaluate the overall effect from the conflicting channels through
which internet affects market concentration. Doing so yields knowledge which is important for
firms and consumers, whose welfare is at stake in the optimization game. It is also useful for
policymakers and competition authorities. The DOJ, for example, often uses studies measuring
the concentration of particular industries in evaluating mergers. Specifically, the DOJ may look
at market concentration before and after a proposed merger in order to determine whether to
allow it. This study aims to obtain somewhat similar information for the movie industry, but
instead of evaluating the effects of a merger on concentration, it evaluates the effects of internet
penetration. By doing so, the study contributes to a body of work which has been done on the
internet’s effect on market structure. While previous research has tended to focus on the internet
and pricing (Baylis 2002, Brown 2000, Ellison 2009, Orlov 2011, etc.), this study looks at how
overall market structure is affected by the internet. Moreover, it analyzes the structure of the
movie market in particular, which, to my knowledge, has not been done with respect to the effect
of internet penetration.
I examine the internet’s impact on the structure of markets and attempt to gain some insight
on its magnitude and direction. I focus on a single industry: the movie industry. Doing so runs
the risk of yielding results specific only to this industry; however, it also makes it easier to
control for other variables and reach a more decisive conclusion. In Section II, I review some of
the research which has been done on this topic of internet and market structure. In Section III, I
offer a theoretical model which explains some possible channels through which the internet
might affect the concentration of movie markets. Using the theoretical model, I will derive an
empirical model in Section IV, which may help to estimate the sum of the effects of these
of the internet’s effect on the industry as a whole. I will do this by analyzing a data set—which
will be described further in Section V—that features information on movie revenues, the studios
who earned these revenues, indicators for internet penetration, and other indicators which will be
used as control variables.
II. Literature
Research on how the internet affects market competition has reached differing conclusions.
Baylis and Perloff (2002), for example, examine the prices of a digital camera and a scanner sold
by different online retailers and find wide variation. Moreover, their results point to this price
dispersion being the result of attempts to discriminate between informed and uninformed
consumers, rather than differences in the quality of service. Put simply, their research suggests
that the increased access to information offered by the internet does not necessarily inhibit firms’
ability to exercise market power, that even online marketplaces can exhibit non-competitive
features such as price discrimination. However, they do not have a clear point of reference; that
is, they do not compare the price dispersion in the internet marketplace to that which might exist
in the physical marketplace. They make a convincing case against the intuition that the low
information costs of the internet lead to something resembling perfect competition; they do not,
however, examine whether the internet has had at least some effect in this direction.
Ellison and Ellison (2009) also examine the effect of internet use on consumer search costs,
and its corresponding effect on market structure. They choose to examine a market for which
pricing competition over the internet is particularly important: computer parts. To do this, they
look at the website Pricewatch.com, a price search engine which is frequented by informed
costs; consumers use the search engine to easily compare and find the lowest prices for similar or
homogenous products. The site is at times effective in its purpose, according to the findings of
Ellison and Ellison; for example, by examining computer memory modules specifically, they
find that firms can face a demand elasticity of -20 or lower for their lowest quality products . Put
another way, the greater access to information offered by the internet makes consumers more
sensitive to changes in price. One might expect this if they are more easily able to see price
differences among firms with similar or homogenous products. In this way, internet penetration
pulls the market for computer parts in a more competitive direction and works to make it less
concentrated. However, this is not the only direction in which the internet pulls, and the
aforementioned case of highly negative elasticity does not always hold. Ellison and Ellison also
find that firms make efforts to counter the effects of decreased search costs; that is, they seek to
increase them so that they are not forced to compete as rigidly in their pricing. They refer to this
practice as “obfuscation,” and their findings suggest that it is effective: profits as well as
markups increase as a result of it. In sum, the findings of Ellison and Ellison find that the
internet decreases search costs for consumers, but also makes it easier for firms to raise search
costs in turn. It is unclear which phenomenon is more important, as it appears to differ on a
case-by-case basis. As a result, one cannot determine the net effect on the overall structure of
the market.
Eugene Orlov (2011) does a similar analysis of the airline industry. He concludes that in
regions of the US with greater access to the internet, price dispersion within firms tends to be
higher, while dispersion between firms is not affected significantly. These results suggest that
the internet makes it easier for firms to discriminate prices among their own customers.
penetration tend to be lower. Put simply, though the prices are more discriminated, they are
lower overall and therefore might offer consumers a higher surplus. Another study by Brown
and Goolsbee (2000) examines prices of life insurance, and offers a similar conclusion. Their
results indicate that increases in internet usage among groups of customers decreases prices and
leads to higher consumers surpluses, controlling for individual and policy characteristics. In
other words, the market is more competitive. However, it is unclear whether discrimination
increases among firms’ own customers, as Orlov suggested occurs in the airline industry.
From these studies, one might conclude, overall, that the internet can enhance or inhibit
competition, perhaps simultaneously. In other words, the intuition offered earlier seems to hold;
the internet affects market concentration through various channels which differ in direction. In
the next section, I establish a theoretical model which explains these channels in greater detail.
They key will then be to determine the sum of the effects of these channels and whether they
more or less nullify one another, or whether an effect in one direction overpowers the other.
III. Theoretical Model
These previously cited studies determined internet’s effect on competition by looking at price
levels and dispersion. For the movie industry, this approach is problematic, as there appears to
be little variation in prices. For example, the price of a movie ticket will likely not vary too
much, at least not immediately following release. In spite of this apparent price uniformity, it
would be difficult to argue that the movie industry resembles anything close to perfect
competition, as products are not homogenous and studios of different sizes face different costs.
So, another tradeoff variable is needed. In this model, the variable will be quality. In other
maximizing utility, to choose a movie with a high quality, rather than a low price. Moreover, it
will be assumed that firms, in maximizing profits, will have quality as an important choice
variable, as opposed to prices. That is, firms compete by choosing quality. Quality will operate
similarly to the way pricing does in traditional profit-maximization models. For example,
increasing quality will also increase costs, a result of hiring more and higher quality individuals
as components of the cast, crew, and staff. This positive effect on costs is similar to the negative
effect on revenues one might obtain by lowering price in a traditional profit model. Moreover,
just as lowering price also increases sales, increasing quality does the same.
Now that the purpose behind including this variable has been established, the utility a
consumer i gains from watching a movie j in a market t, where a market refers to a country year, is
𝑈𝑖𝑗𝑡 = 𝜃𝑗𝑓𝑖(𝐼𝑛𝑡𝑒𝑟𝑛𝑒𝑡) + 𝜃𝑗𝛽𝑋𝑖𝑡+ 𝜃𝑗𝜓𝑗𝑡+ 𝛼 + 𝜃𝑗𝜀𝑖𝑗𝑡 (1)
where θ represents the quality of the movie j. The first term interacts quality with a function of internet to capture that the internet affects the way consumers perceive quality. For example,
a consumer with access to online user reviews may perceive the quality of a movie differently
than someone without access to such information. This is a multiplicative effect; i.e., in the
aforementioned case, greater internet penetration magnifies the effect that quality has on the
consumer’s utility. In this way, internet operates much like it does in Ellison and Ellison’s
model, in which decreased internet search costs make consumers more sensitive to changes in
price (Ellison 2009). X represents observable characteristics of the individual i, other than perception of quality, which affect his or her utility, such as personal taste. 𝜓 represents other
is the random shock variable. Quality is also multiplied by these three terms because each of
them can also be expected to influence a consumer’s perception of the quality of a movie, or the
weight they give to quality. For example, the importance of quality to consumers may differ
depending on if they are young or old. This could be captured in the model through the
interaction between θ and age, which could be one of the variables represented by X. Finally, the last term in the model 𝛼 is simply a constant, and works as a shifter on the utility of watching
movies.
One can take this utility function (1) and divide it by quality 𝜃𝑗 to obtain a more workable
linear equation, where Ũ = 𝑈 𝜃𝑗 :
𝑈̃𝑖𝑗𝑡 = 𝑓(𝐼𝑛𝑡𝑒𝑟𝑛𝑒𝑡) + 𝛽𝑋𝑖𝑡+ 𝜓𝑗𝑡+ 𝛼
𝜃𝑗+ 𝜀𝑖𝑗𝑡 (2)
We normalize the utility of an outside option, defined as watching a movie from a small
studio (market share < 0.01), as
𝑈̃𝑖0𝑡= 𝜀𝑖0𝑡
The consumer chooses among available movies, choosing to watch a movie from a large or a
small studio. The consumer chooses a movie j if the utility he or she stands to gain is greater than the maximum utility which could be gained from the other choices k. That is,
𝑈̃𝑖𝑗𝑡 > max 𝑘∈Ω 𝑈
̃𝑖𝑘𝑡 (3)
Where Ω refers to the set of movies available to consumer i. Thus, the probability that a
𝑃(𝑈̃𝑖𝑗𝑡 > max
𝑘∈Ω 𝑈̃𝑖𝑘𝑡) =
exp (𝑓(𝐼𝑛𝑡𝑒𝑟𝑛𝑒𝑡) + 𝛽𝑋𝑖𝑡+ 𝜓𝑗𝑡+𝜃𝛼 𝑗)
1 + ∑ exp (𝑓(𝐼𝑛𝑡𝑒𝑟𝑛𝑒𝑡) + 𝛽𝑋𝑖𝑡 + 𝜓𝑗𝑡+𝜃𝛼 𝑗) 𝑘
We assume that 𝑋𝑖𝑡 = 𝑋𝑡. The market share s of movie j in period t, then, is the size of the market M for all movies in country year t times this probability (4):
𝑠𝑗𝑡= 𝑀𝑡∗
exp (𝑓(𝐼𝑛𝑡𝑒𝑟𝑛𝑒𝑡) + 𝛽𝑋𝑡+ 𝜓𝑗𝑡+𝜃𝛼 𝑗)
1 + ∑ exp (𝑓(𝐼𝑛𝑡𝑒𝑟𝑛𝑒𝑡) + 𝛽𝑋𝑡+ 𝜓𝑗𝑡+𝜃𝛼 𝑗) 𝑘
One can convert this (5) to the market share of a studio f by summing this value for all N movies produced by that studio:
𝑠𝑓𝑡 = ∑ 𝑀𝑡
𝑗∈Ω𝑡𝑓 ∗
exp (𝑓(𝐼𝑛𝑡𝑒𝑟𝑛𝑒𝑡) + 𝛽𝑋𝑖𝑡 + 𝜓𝑗𝑡+𝜃𝛼 𝑗)
1 + ∑ exp (𝑓(𝐼𝑛𝑡𝑒𝑟𝑛𝑒𝑡) + 𝛽𝑋𝑖𝑡+ 𝜓𝑗𝑡+𝜃𝛼 𝑗) 𝑘
Where Ω𝑡𝑓is the set of movies produced by firm f. So, the ratio between the market share of
studio f (6) and the share of consumers that watch a movie from a smaller studio 𝑠0 = 𝑀𝑡∗
1 1+∑ exp (𝑈𝑘 𝑖𝑘𝑡)
is
𝑠𝑓𝑡
𝑠0𝑡 = 𝑀𝑡∗ exp (𝑓(𝐼𝑛𝑡𝑒𝑟𝑛𝑒𝑡) + 𝛽𝑋𝑡) ∑ exp(𝜓𝑗𝑡+ 𝛼 𝜃𝑗) 𝑗∈Ω𝑡𝑓
So, if 𝜓𝑗𝑡 = 𝜓𝑡 and 𝑋𝑖 = 𝑋𝑡, then
𝑠𝑓𝑡
𝑠0𝑡 = 𝑀𝑡∗ exp(𝑓(𝐼𝑛𝑡𝑒𝑟𝑛𝑒𝑡) + 𝛽𝑋𝑡+ 𝜓𝑡+ 𝜃̃𝑓𝑡)
(4)
(5)
with 𝜃̃𝑓𝑡 = 𝑙𝑜𝑔 ∑ exp( 𝛼 𝜃𝑗)
𝑗∈Ωt . One can then take logs to find that:
log 𝑠𝑓𝑡 − log 𝑠0𝑡 = 𝑓(𝐼𝑛𝑡𝑒𝑟𝑛𝑒𝑡) + 𝛽𝑋𝑡+ 𝜃̃𝑓𝑡+ 𝜓̃𝑡where 𝜓̃𝑡 = 𝜓𝑡+ 𝑙𝑜𝑔𝑀𝑡
On the firm side of the model, each firm f maximizes profits from all movies j produced in
country year t by, in part, choosing quality θ. That is,
max
𝜃 𝑃𝑟𝑜𝑓𝑖𝑡𝑓 = ∑ 𝑃 ∗ 𝑗∈Ω𝑡𝑓
𝑀𝑡∗ 𝑆𝑗(𝜃𝑗, 𝐼𝑛𝑡𝑒𝑟𝑛𝑒𝑡, 𝑋𝑡, 𝜓𝑗𝑡) − 𝐶𝑜𝑠𝑡𝑠(𝜃𝑗, 𝐼𝑛𝑡𝑒𝑟𝑛𝑒𝑡, 𝑧𝑗𝑡)
The profit function follows the traditional form of revenue minus costs. Revenue for a movie
j is equal to price P times quantity. Quantity is equal to the size of the market M times the
market share of the movie Sj, which in the consumer side of the model, is established to be a function of quality, internet, and other observable variables related to the individual and the
movie. Subtracted from revenues are the costs, which are a function of quality, internet, and
other variables zjt which determine costs, such as wages. Quality, as discussed earlier, is the primary choice variable for firms in the model. The intuition behind internet’s inclusion here has
also been discussed. For example, the internet may reduce the costs of obtaining information
about consumers and therefore make it easier to discriminate prices. Put simply, the internet
may make it less costly for firms to market their products.1
IV. Empirical Model
The above theoretical model established possible channels through which internet might
affect market concentration. First, the internet affects consumer choice which then affects the
profits of firms and, in turn, the concentration of the market. Second, the internet affects costs,
which then also affect profits and therefore market concentration. As discussed before, with just
the theoretical model, it is impossible to tell the direction of the effect internet ultimately has on
market concentration. As a result, it is necessary to conduct empirical analysis.
First, and most simply, my analysis consists of a descriptive approach; that is, looking at both
variables and how they have changed over different country years. First, I look at the
distribution of market shares of all studios in different markets with different levels of internet
penetration, compare them, and draw rough conclusions accordingly. I then do the same for the
Herfindahl Index. The Herfindahl Index, abbreviated HHI, is often used by entities such as the
DOJ and the FTC as a measure of market concentration. With it, they might, for example,
evaluate proposed mergers. HHI is calculated by summing the squares of the market shares of
all firms and multiplying by 10,000. A higher (lower) HHI indicates a more (less) concentrated
market.
This approach is simple, but preliminary and with an obvious weakness: one is unable to
control for other variables. As a result, I attempt to draw from the theoretical model and obtain a
linear equation which can easily be estimated through regression.
Recall that in the theoretical model,
log 𝑠𝑓𝑡− log 𝑠0𝑡 = 𝑓(𝐼𝑛𝑡𝑒𝑟𝑛𝑒𝑡) + 𝛽𝑋𝑡+ 𝜃̃𝑓𝑡 + 𝜓̃𝑡
log 𝑠𝑓𝑚𝑡− log 𝑠0𝑚𝑡 = 𝛿1𝑡𝐼𝑛𝑡𝑒𝑟𝑛𝑒𝑡𝑚𝑡+ 𝛿2𝑡𝐼𝑛𝑡𝑒𝑟𝑛𝑒𝑡𝑚𝑡2 + 𝛿3𝑓𝑋𝑓𝑚𝑡+ 𝜃̃𝑓𝑡 + 𝜓̃𝑡+ 𝜀𝑓𝑚𝑡
Where f denotes the firm, m the country and t the year. The term 𝜀𝑓𝑚𝑡 captures some
potential measurement errors and 𝑋𝑓𝑚𝑡 are firm-country specific controls that can vary over time.
The dependent variable here is the log of the market share of a firm f. Internet represents a
measure of internet penetration, and the parameter 𝛿1 internet penetration’s estimated linear
effect on the market share. The model also includes a squared variable for internet penetration.
This is to account for the possibility that internet penetration has a non-linear effect on market
shares. Together, these two variables, Internet and Internet^2 will comprise the main independent variables of interest.
To see how the effect of internet penetration on market share might differ depending on the
initial size of the firm, quantile regressions are also run. Essentially, this will produce separate
coefficients for the effect of Internet and Internet^2 at different quantiles of market share. In this
model, the regression is done at every tenth quantile; that is, a separate regression is produced for
market shares at the 10th, 20th, 30th,etc. percentile. By observing how the coefficients change as
market share increases, one might determine if internet penetration affects large and small firms
differently.
A similar approach can be taken with the Herfindahl index:
𝐻𝐻𝐼𝑚𝑡= 𝛿1𝐼𝑛𝑡𝑒𝑟𝑛𝑒𝑡𝑚𝑡+ 𝛿2𝐼𝑛𝑡𝑒𝑟𝑛𝑒𝑡𝑚𝑡2 + 𝛿3𝑁𝑢𝑚𝑏𝑒𝑟𝑀𝑜𝑣𝑖𝑒𝑠𝑚𝑡+ 𝛿4𝑋𝑚𝑡+ 𝛼𝑚+ 𝛾𝑡+ 𝜀𝑚𝑡
NumberMovies orthe number of movies produced in the market, the effect of which is
represented by 𝛿3.
The effect of internet penetration on the number of firms in a market will also be evaluated.
The model for this dependent variable is essentially identical to that of HHI shown above, except
NumberMovies is not used:
𝑁𝑢𝑚𝑏𝑒𝑟𝑆𝑡𝑢𝑑𝑖𝑜𝑠𝑚𝑡= 𝛿1𝐼𝑛𝑡𝑒𝑟𝑛𝑒𝑡𝑚𝑡+ 𝛿2𝐼𝑛𝑡𝑒𝑟𝑛𝑒𝑡𝑚𝑡2 + 𝛿3𝑋𝑚𝑡+ 𝛼𝑚+ 𝛾𝑡+ 𝜀𝑚𝑡
Here, it should be noted that there are potential problems with the Internet variables being
endogenous. That is, it is likely that internet penetration is correlated with the error terms in the
models. This is addressed using an instrumental variable approach.
Using the data set described in the next section, I run regressions based on these equations
and evaluate the results to determine the effect internet penetration might have on the market
structure.
V. Data
In order to take the empirical approach described, I will use a data set which includes
information on movies released from 1999-2012 in several different countries, collected from the
websites IMDB and boxofficemojo. Variables include studio, revenue, budget, and distributor.
Further, for each entry, there are two variables for internet penetration, which are entered by
country and by year: internet users per 100 people, and broadband subscribers per 100 people.
These data are collected from World Bank indicators. Additional indicators include GDP growth
and unemployment rate, were added for each country year when available. This was done so that
Additionally, data on wages for US workers in arts, design, entertainment, sports, and media
occupations were collected from the Bureau of Labor Statistics and were merged with the
dataset.
After merging this information, variables were generated. Generated first were the main
dependent variables of interest. First, the market shares of each studio in a given country-year
were calculated. Next, a variable was generated which normalizes a market share for an outside
option for each country-year. The outside option is defined as watching a movie produced by a
small studio, as opposed to watching movie from a large studio. Logs were then taken for both
of these variables and then subtracted from one another to get the first dependent variable: log of
the ratio of market shares (log 𝑠𝑓𝑚𝑡− log 𝑠0𝑚𝑡). The next dependent variable, Herfindahl Index,
was calculated twice for each country year. The reason for this is that the dataset contains a lot
of missing information for the studio which produced each movie. So, an upper and lower bound
HHI were both calculated, with the upper bound assuming each missing studio is the same firm,
and the lower bound assuming that each missing studio is a different firm. The true market HHI
could be said to lie somewhere in between. Finally, a variable was generated counting the
number of Studios in a given country year.
In addition to the dependent variables, several independent variables were generated. As in
the empirical model, the indicators for internet penetration were not the sole variables used in
regression. Indeed, it was also necessary to create the squared variables (for both Internet Users
and Broadband Access per 100 people). Moreover, a variable counting the number of movies in
each market (country-year) was created for use in the HHI regressions, in the same way as the
VI. Descriptive Analysis
The first two figures (Figures 1 and 2) in the Appendix show the trends of the two main
indicators of Internet penetration that are used in the analysis, across all years for which data are
available (1999-2012). Four separate lines are used to indicate the trend for different countries:
one resembles all countries, one resembles the United States, and the other two resemble
countries with above or below median levels of internet penetration. The countries represented
by these last two lines were categorized as follows: the mean level of internet penetration was
taken for each country across all years, and then grouped depending if this mean was above or
below the median (when each value is grouped in ascending order across all country-years).
This was done so that the countries represented by each line remain consistent across all of the
years.
Data were only available for the United States for years 1999 through 2003. Other countries
only appear in 2003 and each year thereafter. From here, each group of countries follows the
same general increasing trend. For Internet Users (Figure 1), the United States deviates from the
increasing trend and decreases instead from around 2007 until 2011. This is perhaps related to
the economic crisis of this period, though it is unclear why this did not also occur in other
countries. Aside from this, the increasing trend in Figure 1 follows a relatively constant slope; in
other words, the trend is fairly linear. In contrast, the trend for broadband subscribers (Figure 2)
increases at an increasing rate until an inflection point at around 2006, and then increases at a
decreasing rate. One might say that this indicates that the broadband first caught on earlier in the
decade and thus grew rapidly as people wanted the new technology available to them in their
Despite the subtleties of the trends, one can easily conclude from these first two figures that
internet penetration has increased since the early 2000s, and has done so in all types of countries
in the dataset. The trend is not so clear, however, for the Herfindahl index. Figures 3 and 4
indicate the trends for the upper and lower bound Herdindahl indexes respectively, for different
countries grouped the same way as in the previous two figures. Here, one can see that the upper
and lower bound Herfindahl indexes follow much different trends. The upper bound graph
(Figure 3) shows that market concentration increased, reached a peak, and then began to
decrease. The lower bound graph (Figure 4), on the other hand, tends to decrease, reach a
minimum, and then increase. The lower bound trend seems not to be as steady as that of the
upper bound, but the trends are nonetheless essentially the opposite. With this, one cannot say
for certain what the exact trend of market concentration in the movie industry was over the 2000s
decade. One can say that it lies somewhere between the upper and lower bound, but the trends
differ so wildly that it is difficult to assess where in between the true trend lies. However, one
might use the trend of market concentration in the United States to make a guess. The United
States is the only country for which studio data are complete; that is, there are no missing values
for the studio variable, and thus, the upper and lower bound Herfindahl Indexes for the United
States are the same (hence why its trends in Figures 3 and 4 are the same). It is perhaps fitting,
then, that the United States trend lies close to the middle of the two aforementioned trends;
market concentration fluctuates up and down, but does not really increase or decrease overall. It
might be reasonable to assume that market concentration for all countries followed such a trend:
neither decreasing nor increasing in a clear pattern, remaining relatively unchanged overall.
Overall, then, internet penetration has increased while market concentration has not
dependent variable of interest: studio market shares (or the log of the ratio of market shares,
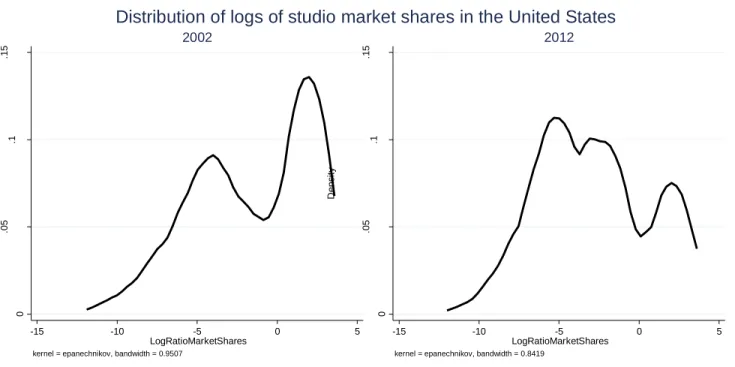
specifically). Countries are grouped as before in these density graphs. First, Figure 5 shows
how the distribution of market shares changed over ten years, from 2002 to 2012. In both years,
there seems to be a group of both mid-sized and large-sized studios, hence the two “bumps” in
the density curve. It is plain to see that the density for the mid-sized group increased from 2002
to 2012, as this bump increases in height. At the same time, the large group makes up a smaller
share of the density curve in 2012 versus 2002. Thus, one can conclude that in the United States,
the distribution of market shares changed so that there were more smaller and mid-sized firms
and less large ones.
One can find a somewhat similar trend in Figure 6, which shows the distribution of market
shares for firms with above median internet in the same two years. In 2002, the market shares
are distributed such that the larger firms dominate, hence the high peak on the right and short
tails. In 2012, however, the left tail of the function becomes much wider and the peak at the high
end goes down considerably. Essentially, this means that the distribution of market shares for
countries with above median internet shifted toward smaller and mid-sized firms making up a
larger part of the market from 2002 to 2012. This is the same trend that was found in Figure 5.
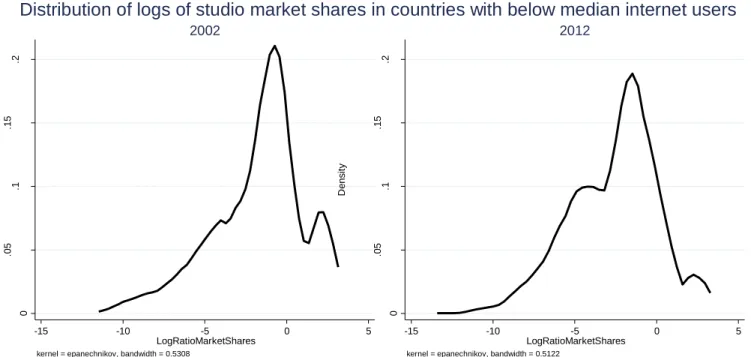
Figure 7, which does the same for countries with below median internet, also shows a similar
trend, though it is not as pronounced. In 2002, there is a peak on the right side, and in 2012, the
peak lowers and the left tail becomes larger. Though it does not do so as much as countries with
above median internet, the distribution of market shares for firms with below median internet
also shifts toward smaller and mid-sized firms from 2002 to 2012.
Finally, Figure 8 shows the trend for the number of studios in a country year, with the
which only includes the US, the number of studios in the market seems to have either decreased
or stayed more or less the same. In the US, however, the number of studios seems to have
increased substantially since 1999, with a somewhat large dip understandably occurring in
recession year 2009. Aside from this year, the number of studios seems to increase at a
decreasing rate.
In sum, internet penetration has generally increased since 1999, while the distribution of
market shares has shifted toward small and mid-sized firms in favor of large ones. Meanwhile,
market concentration has not changed conclusively in one direction or another, and it is likely
that it has hovered around the same level. Moreover, the number of studios has increased
substantially in the United States, but not in other countries. This preliminary analysis indicates
that an increase in internet penetration correlates with smaller firms gaining a larger share of the
market, and thus, that internet promotes competition. Moreover, internet appears to correlate
with an increase in the number of studios, at least in the US. However, these results are just
preliminary, and it is unclear whether there is a causal effect, and whether these trends were
determined by other variables. As a result, regression analysis is necessary, and will be
discussed in the following sections.
VII. Baseline Model
Tables 1 and 2 show the results of the baseline regressions, which follow the empirical model
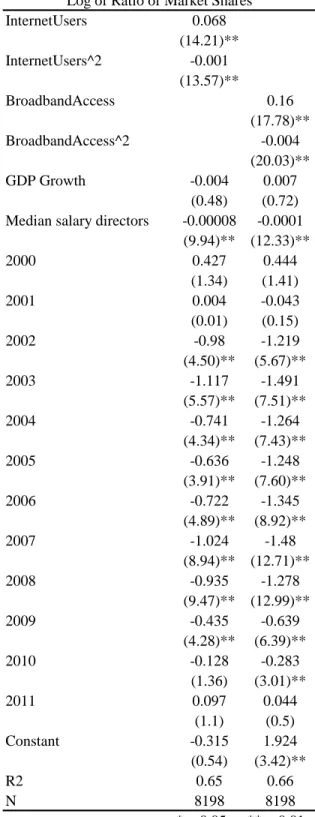
established previously. In Table 1, the dependent variable is the Log of the Ratio of Market
Shares. The main independent variables of interest are Internet and Internet^2. The regression
in run twice, first with Internet Users Per 100 People used as the measure for internet
Control variables include GDP Growth (from World Bank Indicators), Median Yearly Salary of
Directors (from BLS), and fixed effects for Year and Studio. Fixed effects for Studio are not
shown because there are too many studios to include each effect. They are still accounted for,
but not presented in the tables. This is true for all regressions which include the ratio of market
shares as the dependent variable.
The Median Yearly Salary for Directors is one highly significant variable (significant at the
1% level), and its coefficient is negative. In other words, as the wages for directors increases,
the market shares of the larger studios tends to decrease relative to smaller studios. This follows
intuition, to some extent; wage increases signal increasing costs, which thus mean less profits
and lower market shares. Additionally, Internet and Internet^2 are also significant at the 1%
level (holding true for both internet users and broadband subscribers). The coefficient of the first
is positive, while the coefficient of the second is negative. This indicates that the relationship is
U-shaped; as internet penetration increases, the ratio of market shares falls sharply at low levels
of internet penetration, but the magnitude of this effect decreases and at one point may actually
increase once internet penetration increases to a certain point. So, one could interpret this to
mean that if there is low internet penetration in a market, an increase in internet users of 100 will
lead to a sharp decrease in market shares, thus making the market less concentrated. However, if
the level of internet penetration is already high, an increase of internet users by 100 will not
change market shares very much, or may in fact increase market shares and make the market
more concentrated.
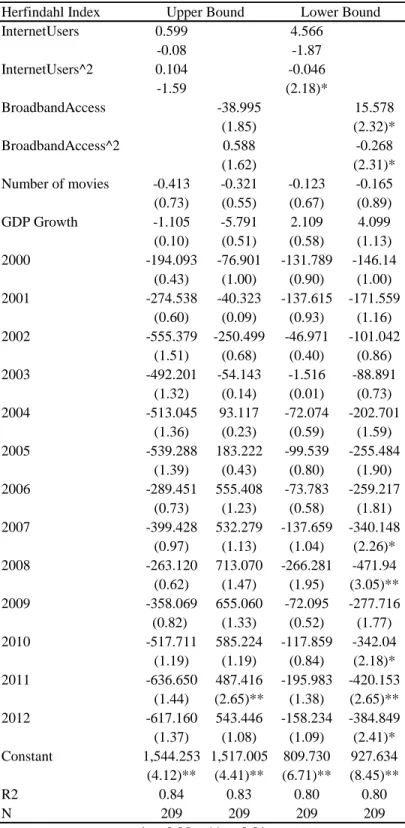
Table 2 shows the results of the regressions on Herfindahl Index. The first two columns
feature regressions on the upper bound, while the second two feature regressions on the lower
the regression is repeated for both measures of internet penetration available in the dataset.
Additional control variables include GDP Growth, Number of Movies in the market
(country-year), and fixed effects for year and country. Country fixed effects are hidden in the same way
studio fixed effects were hidden in Table 2.
Internet and Internet^2 are insignificant for both regressions on the upper bound Herfindahl
Index. With this, one might say that internet penetration does not conclusively affect market
concentration positively or negatively. However, Internet^2 is significant and negative when
regressed on the lower bound Herfindahl Index, and when Internet Users is used as the measure
of internet penetration. Moreover, Internet and Internet^2 are both significant when regressed on
lower bound HHI and when Broadband Subscribers is used as the measure of internet
penetration. The coefficients are positive and negative, respectively, as is the case in Table 1.
These results more or less confirm what was found in Table 1, that an increase in internet
penetration will have a different effect on market concentration depending on its initial level. If
penetration is initially low, concentration will decrease; if it is initially high, concentration will
not change as much and will perhaps increase. However, regressions were done on the upper
and lower bound HHI because of missing values, and so that the true effect could be
approximated as somewhere in between. Because these results do not show up in both
regressions, one should exercise caution in drawing any conclusions. Indeed, there is no reason
to believe that the effect of internet penetration on market concentration resembles that found in
the lower bound regressions, because there are no significant results from the upper bound
regressions that can be compared.
Overall, then, these baseline models provide modest evidence that the internet can both
penetration. However, these results should be taken mostly with a grain of salt, because they are
not necessarily consistent. Moreover, these regressions fail to address the potential endogeneity
problem, of internet penetration being correlated with the error term. This problem is addressed
in the next section.
VIII. Instrumental Variable Model
Tables 3 and 4 feature the results of instrumental variable regressions. An instrumental
variable approach is necessary because of potential endogeneity problems with the Internet
variables; they may be correlated with the error term. Table 3 displays the results of the market
share ratio regressions, as they were done before, but with the Foreign Direct Investment and
Investment in Telecommunications (World Bank Indicators) used as instruments for the Internet
and Internet Squared variables. Fixed effects for year are once again included, but with fewer
years. This is because data for Investment in Telecommunications is not available for every year
in the dataset. This also has the effect of there being fewer observations included in the
regression. Thus, in some ways, this instrumental variable regression is a tradeoff with the
previous regression, in that there are fewer controls and observations. Nonetheless, it is worth
considering the results since this approach addressees the endogeneity problem.
The results for the Market Share instrumental variable regressions differ from those in Table
1. First, the median wage of directors is no longer significant. Additionally, the effects of
Internet and Internet2 have changed signs, with Internet being positive and Internet2 being
negative, but these variables are only significant when Internet Users Per 100 people is the
measure of internet penetration. Broadband Subscribers Per 100 People, when used, is no longer
implications: if internet penetration is initially low (high), the market shares of firms will
increase (decrease/not change).
Table 4 shows the results of instrumental variable regressions for the Herfindahl Index.
Different instruments are used for these regressions than previously, however. Since Investment
in Telecommunications data are not available for every year, only Foreign Direct Investment was
used, in addition to Foreign Direct Investment^2 (so that the number of instruments was equal to
the number of instrumented variables). Including Investment in Telecommunications
unfortunately reduces the number of observations too dramatically, from 209 to 41. Moreover,
the results with this approach are the same as with Investment in Telecommunications as an
instrument: all variables are insignificant. In other words, when instruments are used for internet
penetration, it does not affect the concentration of movie markets at a statistically significant
level. This holds whether Internet Users or Broadband Subscribers is used to measure internet
penetration, and also whether the dependent variable is the upper or lower bound Herfindahl
Index.
Overall, the instrumental variable models provide some evidence that internet penetration has
a U-shaped relationship with market shares, but in the opposite direction of that which was found
in the baseline model. However, these results should perhaps not be emphasized because of a
lack of valid instruments. Indeed, the correlation coefficients between the instrumented and
instrumental variables located on the left give some indication of the validity of the instruments.
Investment in telecommunications seems strongly correlated with internet penetration, which
means the results of the first model (regression on market shares) should probably be trusted
more. Foreign direct investment, however, is not strongly correlated with internet penetration, so
reason, one might trust the results of the first model more than the second, because the second
does not feature investment in telecommunications as an instrumental variable. Overall,
however, the results of these models should perhaps not be emphasized.
IX. Quantile Regression
The quantile regression model tests for the possibility that internet affects large and small
firms differently. The same regression that was run for the baseline model is conducted again
here as a quantile regression, and the results can be seen in Table 5. The quantiles are by tens;
that is, the regression is run for market share at the tenth percentile, the twentieth, thirtieth, etc.
until the ninetieth. Different coefficients are yielded for each level of market share, and with
this, we can determine whether the effect of internet penetration differs for large versus small
firms. For the lower quantiles (10, 20, 30, 40, 50, and 60), the relationship is with internet
penetration is negative; for smaller and mid-sized firms, internet penetration tends to coincide
with a decrease in market share. The internet variables are then insignificant until the highest
quantile (90), at which point the sign changes. This indicates that an increase in internet users
would also increase the market share of large firms.
In sum, the quantile regressions suggest that for small firms, market share decreases as
internet penetration increases. Meanwhile, for large firms, market share increases.
X. Regressions on Number of Studios
Finally, in Tables 6 and 7, regressions were run which include the same independent,
control, and instrumental variables as in the HHI models; however, the number of studios in a
market was used as the dependent variable instead. This is done to test for the possibility that
into the market. This would inevitably decrease the market concentration, but overall, the
concentration may stay the same or even increase if the top studios gain disproportionately from
internet. However, the regressions yield no results; internet penetration is statistically
insignificant in explaining the number of studios in a given market, whether it is instrumented or
not.
XI. Conclusion
Overall, it is clear the internet penetration has some effect on the structure of markets in the
movie industry. The results of the quantile regressions should be emphasized; one can see fairly
strong evidence that internet penetration can be associated with a positive increase in the market
shares of the largest studios, which would indicate that internet penetration makes the movie
market less competitive. Additionally, the baseline models suggest that the market shares of
smaller studios are likely to decrease with greater internet penetration, further suggesting greater
concentration and less competition. However, the regressions on Herfindahl Index indicate that
internet penetration also seems to have no significant effect on the concentration of movie
markets.
These results are seemingly contradictory, but there is a possible explanation. It may be the
case that the internet is a resource that is effectively exploited by the largest studios, who can use
its information to more effectively market their movies, and thus, gain a larger market share. But
simultaneously, the internet allows smaller, independent film studios to promote their films more
effectively than was possible previously. This results in a large influx of small/independent film
studios into the market. The sum of the two effects, looking at the concentration of the market,
increasing the concentration of the market, but many small firms with a tiny market share
decrease market concentration. This is consistent with the theory offered in the introduction of
the paper, that internet penetration could affect the structure of the market in various directions,
and could give an advantage to large and small firms alike. However, the regressions on the
number of studios in the market yield no significant results. Further, it seems that for most
countries in the dataset, the number of studios has either decreased or remained constant. But,
the number of studios in the US has increased considerably, and since it also has high internet
penetration, there still may be something to this theory. It is also possible, however, that the data
are simply not complete enough to draw any meaningful conclusions on the internet’s effect on
market concentration.
In sum, this study finds that large firms tend to benefit from increases in internet penetration,
in that their market shares increase, while small firms find their market shares decrease.
However, the difference between the effects fizzles out as internet penetration becomes greater.
At the same time, it yields no conclusive results suggesting that internet penetration has any
effect on the concentration of the market. It is possible that this due to an increase in the number
of firms in the market, but this is also unclear.
Future studies could perhaps run similar regressions with more accurate calculations of
Herfindahl Index. Additionally, future studies might look to alternative industries where
measures of market concentration are more accurate and readily available. Moreover, they might
want to look more into the internet’s effect on the number of firms in a market. Finally, future
studies could seek to find the magnitude of both effects by performing some sort of structural
If the results of this study are to be trusted, and large firms tend to benefit from internet
penetration (especially in places where internet penetration is initially low), competition
authorities may find it useful to exercise caution when the internet is introduced. Indeed, it may
be necessary to create policy which maintains a competitive marketplace, especially in cases
Citations
Baylis, Kathy, and Jeffrey Perloff. "Price Dispersion on the Internet: Good Firms and Bad
Firms." Review of Industrial Organization 21 (2002): 305-24. Web.
Brown, Jeffrey R., and Austan Goolsbee. "Does The Internet Make Markets More Competitive?
Evidence From The Life Insurance Industry." NBER Working Paper Series (2000): n. pag. NBER. Web.
Ellison, Glenn, and Sarah F. Ellison. "Search, Obfuscation, and Price Elasticities on the
Internet." Econometrica 77.2 (2009): 427-52. Web.
Orlov, Eugene. "How Does The Internet Influence Price Dispersion? Evidence From The Airline
Appendix
Figure 1
Notes
This graph displays the trend of Internet Users per 100 People, as indicated by the World Bank, over the years 1999-2012. The four different lines indicate different groups of
Figure 2
Notes
Figure 3
Notes
Figure 4
Notes
Figure 5 0 .0 5 .1 .1 5 D e n s it y
-15 -10 -5 0 5
LogRatioMarketShares
kernel = epanechnikov, bandwidth = 0.9507
2002 0 .0 5 .1 .1 5 D e n s it y
-15 -10 -5 0 5
LogRatioMarketShares
kernel = epanechnikov, bandwidth = 0.8419
2012
Distribution of logs of studio market shares in the United States
Notes
This graph displays the distribution of the logs of market shares in the movie industry. The two distributions represent two different years: 2002 and 2012. These distributions
Figure 6
0
.1
.2
.3
.4
D
e
n
s
it
y
-15 -10 -5 0 5
LogRatioMarketShares
kernel = epanechnikov, bandwidth = 0.3574
2002
0
.1
.2
.3
.4
D
e
n
s
it
y
-10 -5 0 5
LogRatioMarketShares
kernel = epanechnikov, bandwidth = 0.4504
2012
Distribution of logs of studio market shares in countries with above median internet users
Notes
This graph displays the distribution of the logs of market shares in the movie industry. The two distributions represent two different years: 2002 and 2012. These distributions
Figure 7 0 .0 5 .1 .1 5 .2 D e n s it y
-15 -10 -5 0 5
LogRatioMarketShares
kernel = epanechnikov, bandwidth = 0.5308
2002 0 .0 5 .1 .1 5 .2 D e n s it y
-15 -10 -5 0 5
LogRatioMarketShares
kernel = epanechnikov, bandwidth = 0.5122
2012
Distribution of logs of studio market shares in countries with below median internet users
Notes
This graph displays the distribution of the logs of market shares in the movie industry. The two distributions represent two different years: 2002 and 2012. These distributions
Figure 8
Notes
Table 1 InternetUsers 0.068 (14.21)** InternetUsers^2 -0.001 (13.57)** BroadbandAccess 0.16 (17.78)** BroadbandAccess^2 -0.004 (20.03)**
GDP Growth -0.004 0.007
(0.48) (0.72)
Median salary directors -0.00008 -0.0001 (9.94)** (12.33)**
2000 0.427 0.444
(1.34) (1.41)
2001 0.004 -0.043
(0.01) (0.15)
2002 -0.98 -1.219
(4.50)** (5.67)**
2003 -1.117 -1.491
(5.57)** (7.51)**
2004 -0.741 -1.264
(4.34)** (7.43)**
2005 -0.636 -1.248
(3.91)** (7.60)**
2006 -0.722 -1.345
(4.89)** (8.92)**
2007 -1.024 -1.48
(8.94)** (12.71)**
2008 -0.935 -1.278
(9.47)** (12.99)**
2009 -0.435 -0.639
(4.28)** (6.39)**
2010 -0.128 -0.283
(1.36) (3.01)**
2011 0.097 0.044
(1.1) (0.5)
Constant -0.315 1.924
(0.54) (3.42)**
R2 0.65 0.66
N 8198 8198
*p<0.05 **p<0.01 Log of Ratio of Market Shares
Notes
Table 2
Herfindahl Index
InternetUsers 0.599 4.566
-0.08 -1.87
InternetUsers^2 0.104 -0.046
-1.59 (2.18)*
BroadbandAccess -38.995 15.578
(1.85) (2.32)*
BroadbandAccess^2 0.588 -0.268
(1.62) (2.31)* Number of movies -0.413 -0.321 -0.123 -0.165 (0.73) (0.55) (0.67) (0.89) GDP Growth -1.105 -5.791 2.109 4.099 (0.10) (0.51) (0.58) (1.13) 2000 -194.093 -76.901 -131.789 -146.14
(0.43) (1.00) (0.90) (1.00) 2001 -274.538 -40.323 -137.615 -171.559
(0.60) (0.09) (0.93) (1.16) 2002 -555.379 -250.499 -46.971 -101.042
(1.51) (0.68) (0.40) (0.86) 2003 -492.201 -54.143 -1.516 -88.891
(1.32) (0.14) (0.01) (0.73) 2004 -513.045 93.117 -72.074 -202.701
(1.36) (0.23) (0.59) (1.59) 2005 -539.288 183.222 -99.539 -255.484
(1.39) (0.43) (0.80) (1.90) 2006 -289.451 555.408 -73.783 -259.217
(0.73) (1.23) (0.58) (1.81) 2007 -399.428 532.279 -137.659 -340.148
(0.97) (1.13) (1.04) (2.26)* 2008 -263.120 713.070 -266.281 -471.94 (0.62) (1.47) (1.95) (3.05)** 2009 -358.069 655.060 -72.095 -277.716 (0.82) (1.33) (0.52) (1.77) 2010 -517.711 585.224 -117.859 -342.04
(1.19) (1.19) (0.84) (2.18)* 2011 -636.650 487.416 -195.983 -420.153
(1.44) (2.65)** (1.38) (2.65)** 2012 -617.160 543.446 -158.234 -384.849 (1.37) (1.08) (1.09) (2.41)* Constant 1,544.253 1,517.005 809.730 927.634
(4.12)** (4.41)** (6.71)** (8.45)**
R2 0.84 0.83 0.80 0.80
N 209 209 209 209
* p<0.05 ** p<0.01
Upper Bound Lower Bound
Notes
Telecomm. FDI
Internet Users 0.3804 -0.2218
Internet Users^2 0.342 -0.2355
Broadband Access 0.4796 -0.2206
Broadband Access^2 0.4778 -0.2263
Correlation Table 3 InternetUsers -0.99 (2.07)* InternetUsers^2 0.019 (2.09)* BroadbandAccess -9.69 (1.15) BroadbandAccess^2 0.797 (1.15)
GDP Growth -0.131 -0.034
(1.83) (0.42)
Median salary directors -0.002 -0.004
(1.7) (1.05)
2002 -57.316 -115.156
(1.67) (1.05)
2003 -50.377 -104.108
(1.64) (1.04)
2004 -38.924 -81.113
(1.62) (1.04)
2005 -35.626 -71.464
(1.61) (1.03)
2006 -29.606 -55.733
(1.61) (1.03)
2007 -19.91 -34.812
(1.64) (1.03)
2008 -13.091 -19.6
(1.67) (1.02)
2009 -7.782 -10.472
(1.59) (0.96)
2010 -2.876 -5.799
(1.21) (0.9)
Constant 171.051 308.369
(1.68) (1.04)
R2 . .
N 1309 1309
* p<0.05 ** p<0.01 Log of Ratio of Market Shares
Notes
This table displays the results of the first instrumental variable regression described in Section VIII
(Instrumetnal Variable Model) where dependent, independent, and control variables are exactly the same as in Table 1 (see notes). Here, however, Internet Users, Internet Users^2, Broadband Access, and Broadband Access^2 are instrumented. The instruments are Investment in Telecommunications, as indicated by the World Bank, and Foreign Direct Investment, also indicated by the World Bank. To the left are the correlation
FDI FDI^2
Internet Users 0.0488 0.0826
Internet Users^2 0.0469 0.0733
Broadband Access 0.1073 0.1477
Broadband Access^2 0.1063 0.1425
Correlation
Table 4
Herfindahl Index
Internet Users 348.107 -89.181
(0.40) (0.49)
Internet Users^2 -3.983 0.930
(0.48) (0.54)
Broadband Access -78,060.878 17,238.504
(0.01) (0.01)
Broadband Access^2 1,955.865 -432.186
(0.01) (0.01)
Number of movies -4.060 303.653 0.661 -67.303
(0.46) (0.01) (0.36) (0.01)
GDP Growth -125.475 -22,165.323 21.202 4,896.636
(0.45) (0.01) (0.37) (0.01)
2000 -497.640 94,766.733 10.121 -21,080.531
(0.12) (0.01) (0.01) (0.01)
2001 -855.820 157,993.287 100.522 -35,048.470
(0.20) (0.01) (0.11) (0.01)
2002 211.997 121,632.073 -354.466 -27,162.649
(0.07) (0.01) (0.59) (0.01)
2003 620.910 269,484.845 -334.828 -59,734.874
(0.22) (0.01) (0.58) (0.01)
2004 1,131.799 415,431.314 -496.670 -92,019.373
(0.38) (0.01) (0.81) (0.01)
2005 1,266.473 508,800.567 -497.279 -112,630.173
(0.41) (0.01) (0.77) (0.01)
2006 2,186.526 567,007.269 -574.051 -125,349.313
(0.63) (0.01) (0.79) (0.01)
2007 2,786.302 514,242.839 -788.066 -113,738.894
(0.72) (0.01) (0.98) (0.01)
2008 2,827.977 461,096.694 -879.677 -102,068.206
(0.74) (0.01) (1.10) (0.01)
2009 2,311.069 378,681.204 -600.258 -83,675.820
(0.64) (0.01) (0.80) (0.01)
2010 3,250.543 508,740.975 -809.121 -112,468.762
(0.75) (0.01) (0.90) (0.01)
2011 3,167.739 459,238.551 -892.578 -101,625.834
(0.73) (0.01) (0.99) (0.01)
2012 3,424.494 415,126.912 -898.491 -91,826.737
(0.76) (0.01) (0.96) (0.01)
Constant -4,116.150 65,102.708 2,731.769 -12,965.668
(0.23) (0.01) (0.72) (0.01)
R2 . . . .
N 209 209 209 209
* p<0.05 ** p<0.01
Upper Bound Lower Bound
Notes
This table displays the results of the second instrumental variable regression described in Section VIII
Quantile Regressions 10 20 30 40 50 60 70 80 90
Internet Users -0.019 -0.013 -0.010 -0.007 -0.007 -0.007 -0.004 0.000 0.005
(6.24)** (5.34)** (4.24)** (3.17)** (3.03)** (2.90)** (1.61) (0.20) (2.27)*
Median salary directors 0.000 0.000 0.000 0.000 -0.000 -0.000 -0.000 -0.000 -0.000
(3.26)** (2.72)** (1.45) (0.66) (0.38) (0.86) (1.97)* (3.07)** (6.21)**
GDP Growth -0.015 0.008 0.023 0.035 0.036 0.039 0.008 0.014 0.017
(0.58) (0.37) (1.15) (1.84) (2.01)* (2.01)* (0.45) (0.73) (1.01)
2000 1.890 2.078 1.171 0.294 -0.093 -0.792 -0.518 -0.163 0.283
(2.30)* (3.04)** (1.78) (0.47) (0.16) (1.26) (0.85) (0.25) (0.50)
2001 0.959 0.818 0.138 -0.242 -0.540 -0.994 -1.331 -1.552 -0.135
(1.29) (1.32) (0.23) (0.43) (1.01) (1.74) (2.42)* (2.65)** (0.26)
2002 1.125 0.968 0.589 0.460 0.637 0.395 0.022 -0.350 -1.361
(2.03)* (2.10)* (1.32) (1.10) (1.59) (0.93) (0.05) (0.80) (3.58)**
2003 0.735 0.455 0.523 0.351 0.206 0.048 -0.065 -0.437 -1.413
(1.44) (1.07) (1.28) (0.92) (0.56) (0.12) (0.17) (1.09) (4.05)**
2004 1.196 0.895 0.556 0.194 0.118 0.126 -0.008 -0.449 -1.213
(2.78)** (2.50)* (1.61) (0.60) (0.38) (0.38) (0.03) (1.32) (4.11)**
2005 1.304 0.985 0.703 0.379 0.462 0.233 0.020 -0.343 -1.092
(3.15)** (2.86)** (2.11)* (1.22) (1.55) (0.73) (0.06) (1.05) (3.85)**
2006 0.971 0.995 0.631 0.249 0.087 0.005 -0.241 -0.632 -1.020
(2.58)** (3.18)** (2.09)* (0.88) (0.32) (0.02) (0.87) (2.13)* (3.95)**
2007 -0.374 -0.256 -0.273 -0.566 -0.670 -0.826 -0.865 -0.838 -1.221
(1.29) (1.06) (1.17) (2.58)** (3.20)** (3.70)** (4.03)** (3.66)** (6.13)**
2008 -0.285 -0.355 -0.428 -0.664 -0.529 -0.445 -0.472 -0.656 -0.964
(1.13) (1.69) (2.11)* (3.49)** (2.90)** (2.29)* (2.53)* (3.30)** (5.57)**
2009 0.112 0.301 0.187 0.260 0.228 0.102 -0.112 -0.297 -0.409
(0.41) (1.34) (0.86) (1.28) (1.17) (0.49) (0.56) (1.40) (2.21)*
2010 0.061 -0.078 -0.025 -0.193 -0.090 -0.001 0.293 0.107 -0.081
(0.25) (0.37) (0.12) (1.03) (0.50) (0.01) (1.59) (0.54) (0.48)
2011 -0.101 -0.052 0.182 0.039 0.261 0.224 0.239 0.134 0.048
(0.42) (0.26) (0.93) (0.21) (1.49) (1.20) (1.33) (0.70) (0.29)
Constant -11.241 -9.071 -6.824 -5.140 -3.465 -2.138 -0.342 1.671 5.063
(7.99)** (7.75)** (6.04)** (4.85)** (3.42)** (1.98)* (0.33) (1.51) (5.25)**
N 8,198 8,198 8,198 8,198 8,198 8,198 8,198 8,198 8,198
* p<0.05 ** p<0.01
Table 5
Notes
Table 6
Internet Users 0.130 (1.26) Internet Users^2 -0.001 (1.52)
Broadband Access 0.113 (0.4) Broadband Access^2 -0.007
(1.4) GDP Growth -0.021 0.002 (0.14) (0.01)
2000 15.822 15.866
(2.55)* (2.59)*
2001 27.729 27.740
(4.41)** (4.47)**
2002 61.365 60.951
(12.51)** (12.55)**
2003 65.279 64.857
(13.20)** (12.99)**
2004 66.026 65.692
(13.08)** (12.40)**
2005 66.590 66.479
(12.88)** (11.90)**
2006 68.883 69.110
(13.04)** (11.63)**
2007 75.495 76.121
(14.07)** (12.38)**
2008 75.797 76.661
(13.79)** (12.23)**
2009 70.617 71.748
(12.36)** (11.18)**
2010 69.635 70.780
(12.08)** (10.95)**
2011 72.073 73.417
(12.33)** (11.26)**
2012 72.888 74.354
(12.18)** (11.31)** Constant -31.660 -29.261
(6.19)** (6.35)**
R2 0.97 0.97
N 209 209
* p<0.05 ** p<0.01 Number of Studios
Notes
FDI FDI^2
Internet Users 0.0488 0.0826
Internet Users^2 0.0469 0.0733
Broadband Access 0.1073 0.1477
Broadband Access^2 0.1063 0.1425
Correlation
Table 7
Internet Users 2.832 (0.46) Internet Users^2 -0.033 (0.56)
Broadband Access 25.814 (0.29) Broadband Access^2 -0.676 (0.3) GDP Growth -2.270 5.851 (0.69) (0.22)
2000 12.909 -15.255
(0.29) (0.11)
2001 19.236 -26.561
(0.42) (0.14)
2002 -27.005 -60.099
(0.72) (0.56)
2003 -19.270 -103.101
(0.54) (0.39)
2004 -13.665 -146.297
(0.36) (0.35)
2005 -11.929 -174.050
(0.31) (0.33)
2006 -4.052 -188.141
(0.09) (0.32)
2007 1.867 -169.175
(0.04) (0.31)
2008 -2.591 -155.567
(0.06) (0.33)
2009 -15.317 -134.471
(0.35) (0.37)
2010 2.185 -165.511
(0.04) (0.32)
2011 2.862 -148.564
(0.05) (0.32)
2012 4.087 -133.316
(0.08) (0.33) Constant 17.055 12.375
(0.11) (0.06)
R2 . .
N 209 209
* p<0.05 ** p<0.01 Number of Studios
Notes