DYNAMIC COMPUTER SIMULATION OF CONCRETE ON DIFFERENT
LEVELS OF THE MICROSTRUCTURE
P
IETS
TROEVEN1ANDM
ARTIJNS
TROEVEN21Faculty of Civil Engineering & Geosciences, Delft University of Technology, PO Box 5048, 2600 GA Delft,
The Netherlands,2Habanera, Delft, The Netherlands
e-mail: [email protected], [email protected]
(Accepted February 28, 2003)
ABSTRACT
The establishment of an experimental basis for the dependence of a mechanical property on certain structural features (and the associated micro-mechanical properties) would require extensive, cumbersome and complicated testing: mechanical testing for defining the very property, quantitative (section) image analysis and stereological three-dimensional assessment of the relevant structural features. ‘Realistic’ simulation of material structure by computer would therefore offer an interesting alternative. This paper introduces the SPACE system (Software Package for the Assessment of Compositional Evolution) as the most recent development in this field. It has been developed to assess the composition as well as configuration characteristics of dense random packing situations in opaque materials. This paper presents an introduction to the system and will thereupon highlight by means of illustrative examples of typical applications on different levels of the microstructure the system’s capabilities. Although only a single application can be presented in this framework, they all concern areas of major engineering interest.
Keywords: computer simulation, concrete, material model, particle packing, stereology.
INTRODUCTION
Cementitious materials can be considered consisting of particulate elements on the various levels of the microstructure. In an ordered fashion, they build up a crystalline structure in the hydrated state. The binder particles in fresh concrete form on microlevel the so-called matrix. When matured, the matrix stabilises the skeleton of aggregate particles on meso-level. To realistically simulate this densely packed particulate matter, the common simulation methods based on so called ‘random generators’ (RG-systems) will reveal serious limitations. Particles of a certain range of particles sizes are sequentially positioned inside a container by RG-systems. Each location is ‘randomly’ generated. With such high densities as met in this category of problems, ‘overlap’ will occur to an increasing degree during the generation process. The solution is to reject such overlap situations, whereupon the generation process is continued. Obviously, ‘dense random packings’ can not easily be generated in this way. So, this approach is unpractical due to the excessive computer time requirements at high particle densities. Moreover, a more uniform structure is obtained, under-estimating a natural phenomenon such as clustering of particles. As a consequence, the results are unreliable, because the rejection procedure leads to biases in particle configuration that are dramatically increasing with particle density (Stroeven and Stroeven, 1996). Therefore, a more realistic
computer system for simulating particulate materials would be appropriate, particularly for studying structure-sensitive properties of such materials.
After World War II, the awareness grew that the material structure exerted a major influence on mechanical behaviour of concrete. This was evidenced by increased research interest that resulted in a large number of publications issued since the sixties. As an example, reference should be given to those dealing with extensive and concentrated research performed at Cornell University (Hsu et
al., 1963) and at Imperial College (Pigeon, 1969;
McGreath, 1968). Computer simulation of damage evolution by finite element approaches started in the seventies, an example being the so-called ‘numerical concrete’ (Zaitsev and Wittmann, 1977). Sections of concrete specimens with a low areal content of
randomly dispersed multi-facet particle sections were
the case of concrete: mixing of aggregates, water and cement). A mixture could consist of spherical or polyhedron-shaped particles (simulating aggregate of fluvial origin and of crushed rock, respectively) and fibres (Stroeven and Guo, 1989). This system was employed, among other things, for studying the dependence on the aggregate composition of the fibre reinforcement efficiency in the boundary zone of fibre reinforced concrete elements (Stroeven and Guo, 1989; Guo and Stroeven, 1989).
A final start could be made during the mid-1990s in the framework of a PhD study of the second author. This resulted in the development of the newest version of the dynamic computer simulation system with the acronym SPACE (i.e., Software Package for theAssessment ofCompositionalEvolution). The capabilities of the system will be illustrated by three applications in different fields of engineering interest. These illustrative applications will deal with
– Optimisation of aggregate composition in concrete.
Hence, this is an application on macro-level, whereby representative quantities of the different sieve fractions of the aggregate are concerned.
– Characterisation of the interfacial transition zone in concrete.
This is an application on micro-level, dealing with the packing structure of binder particles in the fresh state (an hydration algorithm is available for studying the structural changes during this hardening process).
– Simulation of crack development in concrete.
This is an application on meso-level. A number of simulated concrete specimen are subjected to a finite element simulation.
A major field of experimental research in concrete technology deals with the hydration process. The simulation concept is omitted, however, because of space limitations (see, Stroeven, 1999; Stroeven and Stroeven, 1997). Yet, some early applications of
SPACE to cement hydration will be given as an illustration of the system’s capabilities as to this highly relevant topic.
SIMULATION SYSTEM SPACE
The non-homogeneous, or granular, nature of the internal material structure is represented by a set of distinct elements. Each element corresponds to a distinguishable, characteristic phase in the material. For example, concrete is modelled as a set of elements representing the aggregate particles. The elements are
dispersed in a presumably homogeneous mortar matrix moulded in a container. Similarly, cement paste is modelled as a set of elements representing cement particles dispersed in water. The parameters describing the static conditions of the internal structure are the locations, orientations, and shapes of the various individual elements. Since the elements represent real physical phases in the material, physical properties can be assigned to each element along with its shape and size, at least in principle. The most difficult task, however, is the derivation of the location and the orientation of these non-overlapping elements.
Static simulation of particle positions
In a static simulation system, the particles will be sequentially located inside a container. Each location is governed by randomly generated co-ordinates. ‘Overlap’ with earlier generated particles will result in rejection, whereupon the generation process is continued. The number of rejections will increase dramatically at high volume fractions, making the generation process very time-consuming, if not impossible at all in the highest density range. Simulation of a multi-size particle composite requires starting with the largest particles in the mix. The system obviously excludes the mechanism of
mutual particle interaction, which is so characteristic
for the production stage of cementitious materials. The re-generation after rejection inevitably leads to an under-estimation of a natural phenomenon as particle clustering. The generated nearest neighbour distribution of the particles will reveal, as a consequence, dramatically large biases at higher particle densities (Stroeven and Stroeven, 1999b). Three of the more popular systems in this category were developed by Roelfstra (1989), by Diekk¨amper (1984), and at NIST (Bentz et al., 1993). An example of a statically simulated material structure is given on the left hand side of Fig. 1.
Dynamic simulation of particle positions
The SPACE system is based on a dynamic concept of simulating the production process of composite materials, i.e., in case of concrete: mixing of aggregates and paste, or cement and water. The details of the generation system have been published by the authors elsewhere (Stroeven and Stroeven, 1996; Stroeven, 1999). To be able to simulate effects such as clustering and to reach high volume densities, element motion and inter-element collision are modelled (Brach, 1991), leading to effective ingredient mixing. This stage is referred to as the dynamic stage.
– Initially, a structured or random 3-D dilute distribution of elements is generated within the boundaries of a container, using the static ‘rejection’ mechanism mentioned earlier. So far, only spherical particles can be conceived by
SPACE. Next, random linear and rotational velocity vectors are assigned to each element.
– The second step, the actual dynamic stage, is an iterative procedure where location and orientation of all elements are changed at each time step according to a Newtonian motion model . This motion model relates the element’s linear and angular displacement to a set of conditions enforced on the element (e.g., gravity, friction, etc.). When elements meet during this time interval, a contact model defines the effect of contact on the motion/rotation update. Inter-particle influences - one of the requirements for achieving a more versatile system - are incorporated in the contact model. Additionally, electrical or chemical inter-particle forces may be added to the motion model. This will allow to more accurately adjustSPACE simulations to the particle aggregation conditions (i.e. flocculation) of the fresh cement paste. In the present concept, the use of this facility was considered to needless complicate matters, because no quantitative estimation of the ITZ thickness was pursued. The density can be varied during this stage by gradually moving the container walls towards each other compaction) or away from eachother, or by applying a gravitational force.
– Finally, the iteration stops when certain conditions are reached, such as the relevant volume fraction of aggregate, or the required water to cement ratio (W/C ratio).
The final distribution state can incorporate effects due to gravity and to inter-particle influences. Simple physical laws may be used to define the inter-particle relationships, by introducing parameters such as specific mass and energy dissipation. Maximum packing densities can easily be simulated by the
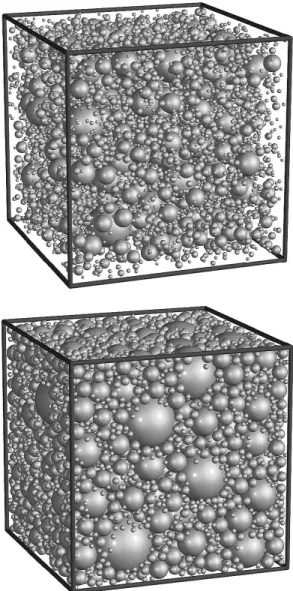
SPACE system. Such densities are relevant for aggregate packing problems on engineering level, or for binder particle packing problems particularly at low water to cement ratios, appropriate for High Strength Concrete (HSC) or High Performance Concrete (HPC) systems. A densily packed material structure is shown on the right hand side of Fig. 1 which is the result of the dynamic compaction of the structure displayed on the left hand side of Fig. 1.
Fig. 1. Example of a 3D material structure (top) after
the static simulation and (bottom) after the dynamic densification process.
It should be noted finally, that the dynamic stage is a built-in mechanism to achieve high densities that can not be realised by static simulation systems. The dynamic stage is supposed to imitate, moreover, the production stage of the material. All forces added to the system can be manipulated, so that ‘sticky’ particle contacts during the production of the model material can also be simulated. The
dynamic (Newtonian) simulation mechanism has no significance after completion of the simulation, hence, is not connected with the rheological properties of the model material. Once mixed, the aggregated
the more complicated situation of multiple merging particles, see Stroeven (1999).
PARTICLE PACKING ON MACRO-LEVEL One of the features of the SPACE system is the capability to densify the structure during the mixing process. This option is frequently used to obtain a particular density for a mixture, which cannot always easily be obtained by random generation methods. The question could now be posed whether the densification method could be applied as well for the estimation of the ultimate density of a mixture with a given particle size distribution function or sieve curve.
A series of experiments were performed in which six different mixtures (A–F) each consisting of 15,000 particles were generated by the SPACE
system and densified up to their ultimate density (Donker, 1998). The solid lines in Figure 2 refer to the cumulative size distribution functions of these aggregates. Additionally, six gravel/sand mixtures were experimentally densified. The corresponding cumulative fractional density values were quite close to the simulation curves in Figure 2. Note that the numerical size distribution graphs contain more information on the particle mixtures than a sieve curve which is based on a very limited number of sieve opening sizes only. Curves C and F roughly correspond to the limits of the sieve curve area in the Dutch building code (NEN 2560). Of the intermediate mixes, D corresponds to the Fuller curve.
Fig. 2. Cumulative particle size distribution function
for particles between 1 and 32 mm on a semi-logarithmic scale. The functions represented by the solid lines correspond to the numerical mixtures, whereas the values indicated by the circular dots refer to the measured values of the experimental mixtures.
Of course, expectations on correspondence between outcomes of experiments and simulations
cannot run too high, because of inevitable differences between both approaches. First of all, it is well-known that among the various experimental methods to evaluate maximum packing density of aggregates, experimental results will vary significantly (SCRC, 1978). But the conditions can be varied even for one particular method, thereby additionally influencing the outcomes. In the present case, use was made of an 8 litre cylindrical container, in which the mixture of dry sand and gravel particles was compacted for 10 seconds. So, at least the container size can be added to the factors having influenced the experimental data. On the computer side, periodic boundaries were selected for correctly simulating bulk characteristics. In the iterative procedures of the earlier described dynamic stage of the SPACE system, some particle overlap is only a temporary feature. A certain amount of residual overlap has to be accepted, however, when maximum density is approached. In the present case, the acceptance level was set at 1% overlap by volume, a choice influencing the simulation outcomes. Obvious differences between the two approaches further concern the particle shape (spherical in the simulation), and the particle size distribution curve (the sieve curve underlying the experiments is well-known to only poorly reflect the actual size distribution of the particles (Vieser, 1926)).
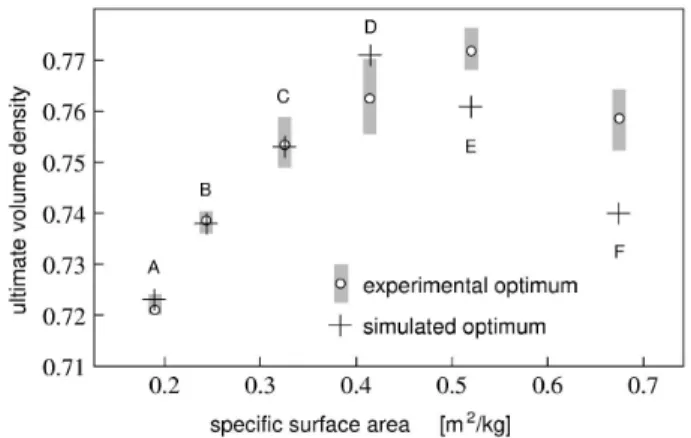
Together with the experimental data, the outcomes of the simulation are plotted in Fig. 3 as a function of the fineness modulus.
Fig. 3. Simulated and experimental values of maximum
density of the mixes indicated in Fig. 2 plotted as a function of the specific surface area; particle size ranges from 1 to 32 mm. The grey strips indicate the scatter among a series of similar simulations.
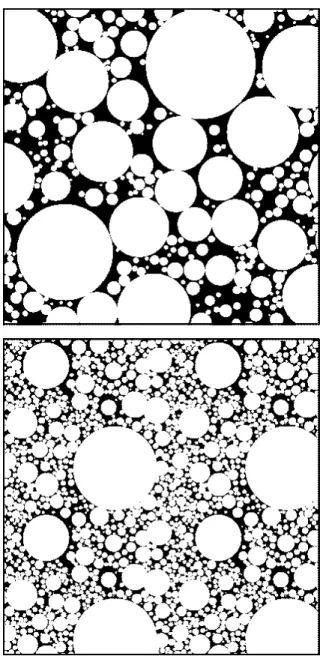
practical significance, and in qualitative agreement with published data (Sedran and de Larrard, 1996). Maximum volume density increases with declining fineness modulus from mix A to mix E. After passing this optimum, a drop occurs from mix E to mix F. In the light of the foregoing, the agreement between simulated and experimental outcomes can be considered very satisfactory. These tendencies are accompanied by characteristic changes in the underlying particulate structure. As an example, Fig. 4 visualises these differences in structure by way of section images of simulated mixes B and F, which have (about) the same density ( 074).
Fig. 4. Sections of the compacted particle mixtures
B (top) and F (bottom) defined in Fig. 2; significant differences in details of the packing structure are visible despite an almost similar total volume density of 0.74.
The second step in trying to assess volume density of sand/gravel mixes by the SPACE system is going from densified ‘gravel’ to ‘densified gravel and sand’. The last problem would involve extending the particle size range to the micrometer level. Aggregates with such a wide range of particle sizes cannot be dealt with realistically, because of the excessive number of particles involved. But the problem can be approached in a qualitative way. It is demonstrated by Fig. 4 that curve B leads to dispersed ‘pores’ between the particles, that are larger than those in mix F. This is due to the larger number of small particles in the latter case, which subdivide the open space into smaller pores. These smaller pores are less easily accessible by the sand without increase in overall volume. Hence, of the two, curve B should lead to higher densities after mixing with the sand.SPACEis used partly in a quantitative and partly in a qualitative sense to estimate the sand-accumulation capacity of the gravel at optimum density. For additional details, see Stroeven and Stroeven (1999a).
PARTICLE PACKING ON MICRO-LEVEL
(Stroeven, 2000a; Scrivener, 1989). Hence, computer-simulation could offer an attractive alternative. This is pursued in the forthcoming example of an application of theSPACEsystem to particle packing problems on micro-level. To describe such packing characteristics, a distinction should be made between composition and configuration (Freudenthal, 1950; Holliday, 1966; Stroeven and Stroeven, 2001).
Composition gradient in the ITZ
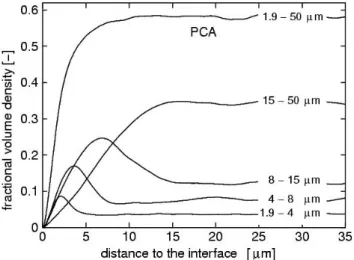
Fig. 5 offers information on an interesting effect of the packing of particles near a rigid boundary, i.e., size segregation.
Fig. 5. Volumetric density of different size fractions of
particles from model cement PCA, plotted as function of the distance to the interface; data are the average of six simulations.
A model cement with particles between 1.9 and 50 µm is considered. Although the size range is limited because of computational reasons, this will not fundamentally change the size segregation phenomenon. The particle sizes are for demonstration purposes grouped into a number of classes. As demonstrated, the peak density is proportional to the average particle size in the class. In other words, the smallest particles concentrate near the rigid interface as a natural phenomenon. For composition effects only the total volume fraction curve is used, however.
Fig. 6 presents the Particle size Distribution Functions (pdf’s) and Blaine numbers (surface areas per gram) of the model cement pastes PCA (Portland cement type A) and PCC (Portland cement type C) that have been used throughout the remainder of this section. Note that the Blaine numbers are relatively low, because of the cut off limit in the lower size range. The pdf of the model cements is made to closely match the Rosin-Rammler curve, G d 1 exp bd
n
, n
and b being constants with values n 13, b 00175
for PCA, and n 14, b 0033 for PCC (Stroeven,
1999; van Breugel, 1991). The Rosin-Rammler curve is generally accepted to represent the particle size distribution of ordinary Portland cements. The well-established Hymostruc system (van Breugel, 1991) for simulation of hydration and structure formation is based on a similar concept (same pdf of spherical particles).
Fig. 6. The particle size distribution functions of model
cements PCC and PCA, that are at the basis of the simulations of Figs. 5–11.
The volume fraction of particles in the ITZ is analysed for step-wise reduced water to cement ratios in the range from 0.6 to 0.2. To do so, a total of 10,000 spherical grains were dispersed in a cubic container of which the size was gradually reduced until the desired water to cement ratio was reached. The bulk value of volume fraction is used to normalise the data. This total number of grains ensures that the number of larger particles in the model cement is so large that the actual pdf does not seriously deviate from the (truncated) continuous Rosin-Rammler function. Increasing the maximum grain size would require to proportionally increase the container size. The effect would be to the third power on the total number of particles. Despite economic algorithms in SPACE that avoid considering the position of all particles in studying the ‘neighbourhood’ of an arbitrary particle, which would have a very significant effect on computation time. Results are obtained by an automated analysis
of serial sections parallel to the interface surface,
discussed later. Stereological interpretation yields the 3-D density information plotted as function of the distance to the interface. Note that all data represent
Fig. 7. Effect of water to cement ratio of the model
cement paste (PCA) on volume density of the paste as function of the distance to the interface. The average results of six simulations are normalised by the bulk value of volume density.
Fig. 7 demonstrates an increase of the ITZ’s thickness with increasing value of the water to cement ratio. The parameter at issue is the local value of particle volume fraction normalised by its bulk value. This is a composition criterion. Thickness of the ITZ is increased over the full range of water to cement ratios by a factor of about 2 (Stroeven, 1999). More accurate estimates could be obtained by increasing the number of simulations and averaging the data, but main purpose here is to reveal trends.
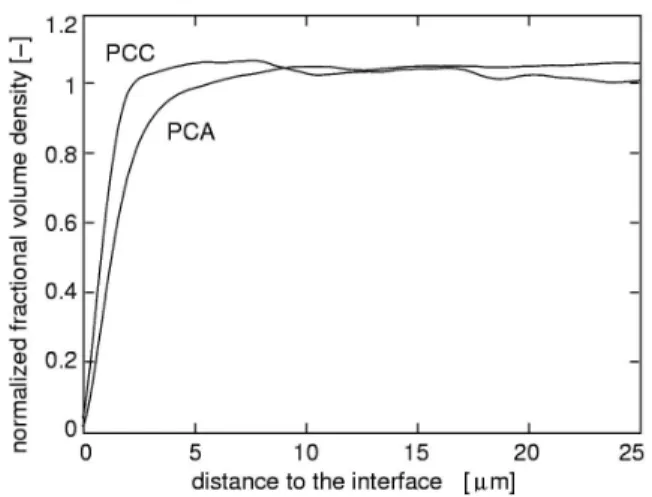
Fig. 8. Effect of the fineness of the model cement paste
(PCA versus PCC) on the volume density gradient over the ITZ. The average results of six simulations are normalised by the respective bulk values of volume density (W/C=0.2).
Fig. 8 reveals the change in ITZ thickness due to cement fineness for a paste with a water to cement ratio of 0.2. Data are normalised by the respective bulk values of volume fraction. Additionally, porosity (interpreted here as complementary to particle volume
density) declines significantly faster away from the interface in case of the finer cement. It can be expected that the addition of fine mineral admixtures such as silica fume will significantly enhance this rate in porosity decline in the vicinity of the interface.
Configuration gradient in the ITZ
The curves of the various size classes in Fig. 5 demonstrate the particle grading to change over a larger distance away from the interface than reflected by the total volume fraction curve (Stroeven and Stroeven, 2000). This is a direct effect of the size segregation phenomenon. Configuration in fine particle packing systems is important because of physical contributions to crack initiation strength or even to tensile strength. These contributions have been proven very significant even in the hardened state (Fidjestøl and Frearson, 1994). The most relevant parameter would be the distribution function of the surface-to-surface spacing to the nearest neighbour particle, f ∆3, expressed as a function of the distance
to the interface, but for the present purpose this is too complicated. Instead, the mean free spacing,λ in
µm is used. Although a three-dimensional parameter defining the average of all unobstructed surface-to-surface distances to neighbouring particles (Fullman, 1953) is rather complicated to measure, it can easily and unambiguously be determined in sections, i.e.
λ 4 1 V
V S
V, whereby SV is the specific surface
area of the particles, and VV the volume fraction. The total perimeter length of the circular cross-sections of the particles per unit of area in the section plane,
LA, is related to the surface area per unit of volume by SV
4
πLA. This allows for an unbiased and exact
estimation ofλ. The mean free spacing was employed earlier by Stroeven for the experimental assessment of particle packing characteristics in concrete (Stroeven, 1973). It should be noted here, that the averaging procedures (in this case over distances to more neighbours, instead of using only the minimum value) reduces the configuration-sensitivity. Hence, structural effects revealed in forthcoming pictures will certainly not exaggerate the fundamental difference between composition and configuration homogeneity.
Under the assumption that physical strength (due to van der Waals-type of bonding forces) would be proportional to λ
3, this parameter can be used
Fig. 9. Parameter proportional to global bond capacity
in the ITZ as function of the water to cement ratio (PCC); λ=mean free spacing in µm. The average results of six simulations are presented.
Fig. 10. Parameter proportional to global bond
capacity in the ITZ as function of the water to cement ratio (PCA);λ=mean free spacing inµm. The average results of six simulations are presented.
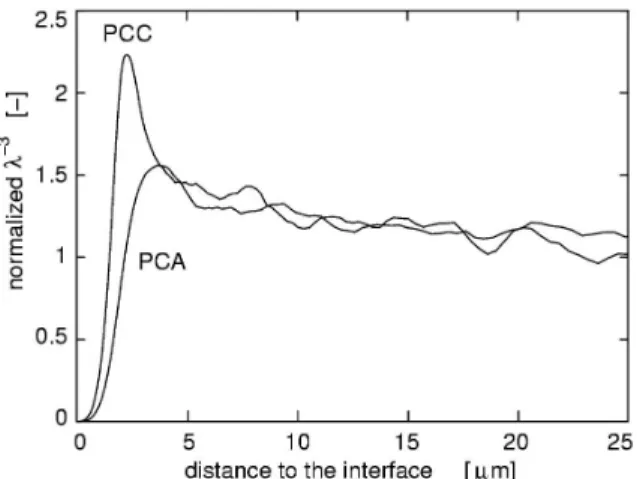
Fig. 11. Data of Figs. 10 and 9 with W C 02 normalised by the respective bulk ordinate values. λ = mean free spacing inµm. The average results of six simulations are presented.
Fig. 11 presents data normalised by the relevant bulk values. Hence, sufficiently far away from the interface the ordinate value is 1 (apart from statistical variation). With a reduction in water to cement ratio, the inter-particle bond capacity rises steeper in the immediate vicinity of the interface to a level that at lower water to cement ratios even exceeds bulk value. Hence, also the bond between the cement particles and the aggregate surface will increase proportionally. At increasing distance to the interface, unit value is gradually approached. The disproportional improvement of bond in the part of the ITZ immediately neighbouring the interface surface is restricted to the range of W C 02 to 0.3 (relevant for
HPC). This is accompanied by a significant increase in the ITZ thickness.
Fig. 9 presents data of the fine-grained cement. The disproportional bond strength increase in the ITZ neighbouring the interface becomes already apparent at W C 04. The strength increase is more dramatic
than in case of the coarser model cement (PCA) (Fig. 10). The latter effect is clearly revealed by Fig. 11 that presents the global bond capacity data normalised by the relevant bulk values. Data are pertaining to the two model cements used in pastes with a water to cement ration of 0.2. Size segregation causes an accumulation of the smaller particles close to the interface (as demonstrated in Fig. 5). This gives rise to a more rapid growth in inter-particle bond to a level that is 2.25 times exceeding the bulk property. This is about 40% exceeding the peak bond level of the PCA paste. Hence, selecting a fine-grained cement (larger Blaine number) or adding a mineral admixture with particles smaller than those of the cement (silica fume) will lead to a similar size-segregation phenomenon and a further disproportional improved bond capacity. A comparison between Figs. 9 and 10 learns the average level of the plotted parameter (that is supposed to be proportional to a global bond capacity) to be in all cases on a significantly higher level for the fine-grained model cement (PCC). The ITZ thickness increases with reduced water to cement ratios and is of the order of maximum grain size in the model cement for W C 02. Hence, the extent of the ITZ depends
on the composition of the material (W C ratio) and on the position of the measuring parameter in the range between composition and configuration. The latter conclusion can be derived from a comparison of similar cases.
case of the second cement (PCA), this is about 4 µm. Hence, the building up of maximum bond capacity takes place over distances of approximately 1.5µm for PCC and 3.0 µm for PCA, respectively; a difference of 100%. Since inter-particle distances in the layer immediately bordering the interface will be similar to particle-interface distances, the same conclusion can be drawn as to the level of physical bond between the particles and the interface surface.
Although not targeted in this paper, it would be of interest to see whether the gap can be bridged between experimental data and the presented simulation results on model cements. The SPACE
system allows assigning forces to the particles in the dynamic stage of the simulation process to more closely simulate aggregation mechanisms, such as flocculation. Particle shape could be remodelled, although computational efforts for ‘contact detection’ will increase significantly. But, of course, simulating material structure inevitably asks for making structural simplifications. Nevertheless, the detection of trends in the aggregation of particular matter can be accomplished in a relatively easy way, whereby outcomes can be checked by comparison with actual measurements. The SPACE system provides a couple of additional parameters (like internal energy dissipation during the dynamic stage) that influence the aggregation process. For examples, see Stroeven (1999). This would allow narrowing the gap between a real material and a model ‘material’ in a specific situation.
In comparing ITZ measurements on real materials and simulation data, we should account for the larger size range of real cements. This will exert a direct effect on the ITZ’s extent (see, e.g., Fig. 5). For the sake of the argument, proportionality is therefore assumed between the ITZ’s thickness and the maximum grain size. For a cement with a noticeable fraction of grains in the 80 to 100 µm size range, this would lead to a roughly 20 to 25 µm thick ITZ shell for composition, and an 80 to 100 µm one for configuration. Of course, water to cement ratio and fineness of the binder will influence these data in a moderate way for composition measurements, and strongly for configuration parameters, as demonstrated herein. In comparing with experimental data, we have to acknowledge that experimental data on the ITZ’s thickness may reflect other mechanisms than ‘packing’, although a common one as interface bleeding is probably of minor importance in the HPC range. Finally, experimental observations cannot easily be obtained on ITZ sections perpendicular to the aggregate grain’s surface, leading to biased information. Even averaging over a series of random
observations on apparent ITZ sections in a single large-scale section of the specimen would lead to estimates about 50% too large (Stroeven, 2000a). A general but fundamental problem is that the ITZ has no clear and obvious boundaries. Determination of the ITZ’s thickness from gradient measurements, either experimental or simulated ones, can therefore neither be very accurate nor completely objective. Of more importance is therefore the recognition that the extent of the ITZ, though hard to delineate, will depend on material composition, as well as on the degree the parameter being studied is depending on material configuration. This phenomenon has been highlighted in this paper. The reader is referred for a more thorough treatment of this subject to a recently published paper of the authors (Stroeven and Stroeven, 2001).
REFERENCES
Bentz DP, Garboczi EJ, Stutzman PE (1993). Computer modelling of the interfacial zone in concrete. In: Maso JC, ed., Interfaces in Cementitious Composites. London: E & FN Spon, 107-16.
Brach RM (1991). Mechanical impact dynamics, rigid body collisions. New York: John Wiley & Sons.
Detwiler RJ, Metha PK (1989). Chemical and physical effects of silica fume on mechanical behaviour of concrete. ACI Mat J 86(6):609-14.
Diekk¨amper R (1984). Ein Verfahren zur numerischen Simulation des Bruch- und Verformungsverhaltens spr¨oder Werkstoffe. Technische Wissenschaftliche Mitteilungen der Institut f¨ur Konstruktiven Ingenieursbau, Ruhr Universit¨at Bochum, 7.
Donker L (1998). Experimental assessment of optimum density of sand/gravel mixtures. Delft: Delft Univ Techn, Faculty of Civil Engineering, Report 03.21.1.32.12 (in Dutch).
Jiang W, Roy DM (1994). Strengthening mechanisms of high-performance concrete. In: Malhotra VM, ed., High performance concrete, Proceedings of ACI International Confonference Singapore. Detroit: ACI, 753-67. Fidjestøl P, Frearson J (1994). High-performance concrete
using blended and triple blended cements. In: Malhotra VM, ed., High performance concrete, Proceedings of ACI International Confonference Singapore. Detroit: ACI, 135-57.
Freudenthal AM (1950). The inelastic behavior of engineering materials and structures. New York: John Wiley & Sons.
in computer-simulated wire-reinforced materials. Acta Stereol 8(2):683-8.
Holliday L (1966). Geometrical considerations and phase relationships. In: Holliday L, ed., Composite materials. Amsterdam: Elsevier Publ Co, 1-27.
Hsu TC, Slate F, Sturman G, Winter G (1963). Microcracking in concrete and the shape of the stress-strain curve. J ACI 60(2):209-24.
McGreath DR (1968). The fracture mechanics of concrete. PhD Thesis. London: Imperial College.
Pigeon M (1969). The process of crack initiation and propagation in concrete. PhD Thesis. London: Imperial College.
Roelfstra PE (1989). A numerical approach to investigate the properties of numerical concrete. PhD Thesis. Lausanne: EPFL-Lausanne.
Scrivener KL (1989). The microstructure of concrete. In: Skalny JP, ed., Materials Science of Concrete I. Westerville (OH): Americ Ceram Soc, 127-61.
Sedran T, de Larrard F (1996). Ren´e-LCPC: software to optimize the mix design of high performance concrete. In: de Larrard F, Lacroix R, eds., Proceedings 4th International Symposium on Utilization of High Strength Concrete. Paris: Presse de l’´ecole des Ponts et chauss´ees, 169-78.
Stroeven M (1999). Discrete numerical model for the structure assessment of composite materials. PhD thesis. Delft: Delft Univ Techn.
Stroeven M, Stroeven P (1996). Computer-simulated internal structure of materials. Acta Stereol 15(3):247-52.
Stroeven M, Stroeven P (1997). Simulation of hydration and the formation of microstructure. In: Owen DRJ, O˜nate E, Hinton E, eds., Computational Plasticity. Barcelona: CIMNE, 981-7.
Stroeven P (1973). Some Aspects of the Micromechanics of Concrete. PhD Thesis. Delft: Delft Univ Techn. Stroeven P (1979). Crack development in concrete as
influenced by the addition of short steel fibres. Fracture Mechanics. Proc Symp Delft, Delft: Delft Univ Techn.
Stroeven P (2000a). Analytical and computer-simulation approaches to the extent of the interfacial transition zone in concrete. In: Brandt AM, Li VC, Marschall IH, eds., Proceedings of Brittle Matrix Conference 6. Cambridge: Woodhead Publ Co & Z Turek RSI, 465-74.
Stroeven P, Guo W (1989). Structural modelling and mechanical behaviour of steel fibre reinforced concrete. In: Swamy RN, Barr B, eds., Fibre reinforced cements and concretes, recent developments. London: Elsevier Appl Sc, 345-54.
Stroeven P, Stroeven M (1999a). Assessment of packing characteristics by computer simulation. Cem Concr Res 29:1201-6.
Stroeven P, Stroeven M (1999b). Micromechanical behaviour of concrete interpreted by computer simulation system for material structure. In: Carlomagno GM, Brebbia CA, eds., Computational methods and experimental measurements IX. Southampton: WIT Press, 571-82.
Stroeven P, Stroeven M (2000). SPACE simulation of particle packing in the ITZ; a spatial perspective on the ITZ’s relevance. Proceedings of International Symposium on High Performance Concrete -Workability, strength and durability I. Hongkong: Hongkong Univ Science & Techn, 509-14.
Stroeven P, Stroeven M (2001). Reconstructions bySPACE of the Interfacial Transition Zone. Cem Concr Comp 23:189-200.
Study Centre for Road Construction (1978). Various properties of natural sands for Netherlands highway engineering. Report Working Group F 4 ‘Sub-base’, 14A Jansbuitensingel, Arnhem, The Netherlands. van Breugel K (1991). Simulation of hydration and