
Temporary Anchorage Devices for Maxillary Protraction: 3D Analysis of Treatment Outcomes
Gavin C. Heymann
A thesis submitted to the faculty of the University of North Carolina at Chapel Hill in partial fulfillment of the requirements for the degree of Master of Science in the Department of
Orthodontics
Chapel Hill 2008
ABSTRACT
GAVIN C. HEYMANN: Temporary Anchorage Devices for Maxillary Protraction: 3D Analysis of Treatment Outcomes
(Under the direction of Dr. Camilla Tulloch)
The purpose of this pilot study was to describe outcomes in preadolescent maxillary deficient patients treated with a novel technique for maxillary protraction using temporary anchorage devices (TADs). The study was comprised of three sections: 1) comparison of outcomes in 2D to existing reverse pull headgear (RPHG) literature, 2) description of outcomes in 3D from cone beam computed tomography (CBCT) data, and 3) assessment of inter-examiner reliability for the 3D analytic method. Outcomes were assessed for six consecutively completed cases. Maxillary protraction of varying degrees was observed in all cases with minimal dentoalveolar compensation. The magnitude of skeletal changes
iv
ACKNOWLEDGEMENTS
I would like to recognize and extend my sincerest gratitude to the following people whose help and support were invaluable during the completion of this project: Dr. Camilla Tulloch for her wisdom and guidance, Dr. Hugo De Clerck for his willingness to collaborate with our department to learn more about the promising treatment that he developed, Dr. Lucia
TABLE OF CONTENTS
LIST OF TABLES ... viii
LIST OF FIGURES ... ix
I. INTRODUCTION ... 1
THE CLASS III PROBLEM ... 1
PURPOSE... 1
II. BACKGROUND...3
THE SKELETAL CLASS III PATIENT ... 3
TREATMENT OPTIONS ... 4
Reverse Pull Headgear... 4
Chin Cup Appliance... 5
MECHANICS OF MAXILLARY PROTRACTION... 7
TREATMENT TIMING... 9
TEMPORARY SKELETAL ANCHORAGE... 11
THREE DIMENSIONAL IMAGING ... 15
III. METHODS ... 19
SAMPLE SELECTION ... 19
Inclusion Criteria... 19
Exclusion Criteria... 20
vi
EXPERIMENTAL PROTOCOLS... 23
Surgical Procedure... 23
Orthopedic Protocol... 26
Radiographic Protocol... 27
CBCT DATA PROCESSING ... 28
Image Acquisition... 28
Construction of 3D Models by Segmentation... 28
Registration of 3D Models... 30
Superimposition and Assessment of Treatment Change... 32
Inter-examiner Reliability... 33
Creation of 2D Data... 35
IV. RESULTS...37
2D DESCRIPTION OF OUTCOMES...37
COMPARISON TO EXISTING 2D DATA... 39
3D DESCRIPTION OF OUTCOMES... 42
INTER-EXAMINER RELIABILITY FOR 3D SUPERIMPOSITION METHODS... 47
V. DISCUSSION ... 49
LIMITATIONS... 49
VARIATION IN TREATMENT RESPONSE... 50
COMPARISON TO EXISTING 2D DATA... 54
3D OUTCOMES... 58
FUTURE RESEARCH ... 62
VI. CONCLUSION ... 64
APPENDICES ... 65
APPENDIX I ... 65
APPENDIX II... 66
APPENDIX III ... 67
APPENDIX IV ... 68
APPENDIX V... 69
APPENDIX VI ... 72
APPENDIX VII... 75
APPENDIX VIII... 79
APPENDIX IX ... 82
APPENDIX X... 85
APPENDIX XI ... 88
APPENDIX XII... 89
viii
LIST OF TABLES Table
1. Age and Sex of Sample... 23 2. Skeletal cephalometric values (in degrees) for each patient... 38 3. Cephalometric values (in degrees) for dentoalveolar
change for each patient ... 38 4. Descriptive statistics for changes in cephalometric
values (in degrees) ... 38 5. Linear change (in millimeters) in A point
for each patient... 39 6. Summary of cephalometric values from studies with
age range of 9-14 years (adapted from Kim et al) ... 40 7. Comparison of cephalometric data from this study
with RPHG data ... 41 8. Surface distances (in millimeters) by anatomic region
for all patients ... 47 9. Descriptive statistics of surface distances by anatomic
regions for all patients... 47 10. Range of variation (in millimeters) in surface distance
LIST OF FIGURES Figure
1. Titanium miniplates and surgical procedure... 25 2. Clinical technique of attaching elastics to
modified miniplates ... 27 3. Segmentation process using ITK-SNAP software... 29 4. T1 and T2 3D models prior to registration ... 30 5. 3D models are registered on anterior cranial fossa
Surfaces... 31 6. 3D model superimposition visualization tools... 33 7. Illustration of color map visualization tool with isolines... 35 8. Composite of 3D superimpositions for all cases
(color maps) ... 43 9. Composite 3D superimpositions for all cases
(maxilla and mandible semi-transparencies) ... 43 10. Composite of 3D superimpositions for all cases
(superior view of maxilla and mandible
semi-transparencies) ... 44 11. Composite of 3D superimpositions for all cases
(posterior view color maps) ... 44 12. Composite of 3D superimpositions for all cases
(glenoid fossae color maps) ... 45 13. Composite of 3D superimpositions for all cases
(soft tissue semi-transparencies) ... 46 14. Location of miniplate relative to zygomatico-
I. INTRODUCTION The Class III Problem
Patients with Class III malocclusion comprise a relatively small percentage of the average orthodontic practice, but they are some of the most difficult to treat effectively and efficiently. Currently accepted treatment options include early treatment aimed at achieving a combination of orthopedic correction and dentoalveolar compensation, later comprehensive orthodontics following cessation of mandibular growth, or for the more severe cases,
orthognathic surgery. The maxillary deficient Class III patient has traditionally been treated at an early age with maxillary protraction by means of reverse pull headgear (RPHG). With the recent increase in use of temporary skeletal anchorage devices in orthodontic treatment, the concept of maxillary protraction has been revisited in an attempt to minimize the unwanted dentoalveolar effects of the currently accepted method, while maximizing orthopedic change.
Purpose
This pilot study was designed to serve as an initial assessment of a new treatment modality in an effort to provide better understanding of the physiological response to
maxillary protraction by means of temporary skeletal anchorage devices. The study involved the development of a 3D analytic method to observe the outcomes of treatment for young growing patients, and is comprised of three sections:
2. Description of treatment outcomes in 3D for a sequential series of patients.
3. Validation of the method of superimposition of 3D models created from Cone Beam Computed Tomography (CBCT) scans of preadolescent patients.
II. BACKGROUND
The Skeletal Class III Patient
The prevalence of skeletal Class III malocclusion in North America has been reported to be 1-3% in populations of European descent.1 Class III malocclusion has a greater
prevalence in other ethnic groups, most specifically those from Asian countries where prevalence has been reported to as high as 14% -16% in certain populations.2, 3 For this reason orthodontic treatment in Korea, Japan, and other Asian countries involves
considerably more treatment of Class III patients than in the United States. A skeletal Class III malocclusion was once thought to be caused solely by a large and protrusive mandible. However, studies that have explored the components of Class III malocclusion have shown that it may be the result of a large or anteriorly positioned mandible, a small or posteriorly positioned maxilla, or a combination of both, coupled with dentoalveolar changes.
Treatment Options
Skeletal Class III patients have always posed problems for orthodontists with regard to treatment planning, and this largely relates to the growing patient. The options of
treatment for growing patients include protraction of the maxilla or chin cup treatment to attempt to prevent the growth of the mandible. In either case the goal in the growing patient is to achieve as much skeletal correction as possible, and hope to maintain this correction until all growth is completed. In adult patients or patients with more severe skeletal discrepancies the treatment options include camouflage treatment involving extraction of lower incisor(s) or premolars, and or orthognathic surgery. If surgery is the treatment of choice to correct the skeletal Class III then the specific options are Bilateral Sagittal Split Osteotomy to position the mandible posteriorly, the Lefort I osteotomy to position the maxilla anteriorly, or a combination of both of these procedures.
Reverse Pull Head Gear
5
treatment time involving maxillary protraction is decided by the clinical outcomes. That is, protraction is usually continued until 3-5 mm of positive overjet is achieved. There are numerous studies6-15 that document the short term outcomes of the traditional treatment, and the results generally show some limited orthopedic effect on the maxilla (on average 2-3mm), a clockwise (down and back) rotation of the mandible, and dentoalveolar changes consistent with treatment of a Class III malocclusion with maxillary deficiency (proclination of maxillary incisors and retroclination of mandibular incisors). Long term follow-up of patients treated with RPHG indicate between a 25 and 33% chance of relapse to negative overjet after all mandibular growth is complete.16-19 The dentoalveolar changes tend to be the most prone to relapse.6 It appears therefore, that it would be advantageous to eliminate or at least minimize dentoalveolar effects and maximize orthopedic effects of treatment. A significant proportion of patients with primarily maxillary deficient Class III skeletal
malocclusion ultimately require orthognathic surgery to correct their problem. Any treatment that could either eliminate the need for orthognathic surgery or reduce the extent of surgery in the future would be truly beneficial to these patients.
Chin Cup Appliance
outcomes consistent with restraining mandibular growth. In that study the monkeys
continuously wore a chin cup appliance that exerted 150g of force bilaterally for 140 days. The authors reported cephalometric, anatomic, and histological changes in the monkeys after the treatment was ceased. Among the cephalometric changes they reported were a
disturbance in the normal downward and forward development of the entire dentofacial complex, decrease in mandibular plane angle, lack of the normal increase in mandibular ramus height, a relatively unchanged anteroposterior position of the mandible relative to cranial base, and an increase in lower incisor angulation. By means of dissection the following anatomic findings were made: short and thickened condylar necks, absence of fully developed sigmoid notches, antegonial notching, and presentation of the coronoid processes as the most superior part of the mandible. Finally, upon histological examination the authors reported the following findings: resorption at the posterior surfaces of the condyles and posterior and superior surfaces of the glenoid fossae, apposition at the anterior surfaces of the condyles, and absence of any inflammatory or degenerative changes. These findings are consistent with study by Kanematsu21 who reported the histologic findings in
Macaca irus treated with chin cup appliances. He noted resorptive activity at the condylar
necks, and apposition on the posterior border of the mandibular rami which resulted in a reduction of the gonial angles. He also reported bone apposition on the anterior surfaces of the condyle, and resorption on the superior surfaces of the glenoid fossa and posterior surfaces of the condyles.
7
over the course of treatment. That being said, the chin cup has remained in the
armamentarium of some orthodontists for the treatment of young Class III patients. There are several reports in the literature about what outcomes are seen in humans with this treatment. Mimura et al22 reported the morphologic adaptations in the temporomandibular joint (assessed via lateral cephalograms) after chin cup therapy for 19 patients with a mean age of 10 years 2 months. Chin cup use was initiated prior to and continued until after the adolescent growth spurt, and the mean duration of chin cup wear was 2 years 1 month. Compared to the study’s control patients who were similar in age, sex, skeletal and dental malocclusion, the chincup patients showed the following changes: deepening and widening of the glenoid fossae, condylar heads bent forward and elongated, and the distance between the condyle and the posterior / superior wall of the fossa was decreased. A study by Üçüncü et al23 compared treatment effects of chin cups and maxillary protraction appliances, and the common findings in the chin cup group were as follows: significant decreases in SNB and facial axis, significant increases in ramus height, lower face height, anterior and posterior face heights, and ANB. As might be expected there was significantly less change in SNA for the chin cup group than for the maxillary protraction group. However, there was not a significant difference in change in SNB or ANB between the two groups. These findings seem to reinforce the idea that the chin cup appliance can be helpful in treating young Class III patients, but in the specific case of maxillary deficiency, RPHG may be the better
treatment modality.
Mechanics of Maxillary Protraction
The idea of advancing the maxilla by means of traction gained attention and
favorable orthopedic changes using his facemask for maxillary protraction and emphasized the importance of timing this treatment to maximize the desired affect on the maxilla.25 Most treatment protocols for RPHG involve similar mechanics. An extraoral facemask is used to apply protraction forces to the maxillary dentition and the reciprocal forces are directed via the mask to the chin and forehead. The magnitude of force is usually between 250g-800g and is delivered via elastics to the maxillary dentition. Variations in appliance design, such as the use of cast splints, Hyrax-type expanders, and trans-palatal connectors have all been used in an attempt to increase the skeletal movements while minimizing the dentoalveolar compensation.
9
(group 2). The authors reported that both groups had similar amounts of maxillary advancement, but the group 1 patients showed counterclockwise rotation of the maxilla, without rotation of the maxillary occlusal plane. Group 2 showed anterior movement of the maxilla without rotation, and a clockwise rotation of the maxillary occlusal plane. Nanda30 also reported being able to eliminate counterclockwise rotation of the maxilla by using a modified protraction face bow design that allowed force to be applied at a higher level than the maxillary occlusal plane.
Treatment Timing
Maxillary protraction is indeed a type of growth modification treatment. Thus it seems logical to coordinate the treatment with the time in which the maxilla is growing at a maximum rate. “Conventional wisdom” has dictated the recommended treatment initiation times thus far. Ochoa et al31 studied growth of the mandible and maxilla in subjects from age 6 to 20 years. The authors used data from the Denver Growth Study, and they reported the greatest rate of maxillary growth occurred between the ages of 6 and 8 years. They noted significant increase in incremental growth of the maxilla that continued on average until age 14. They reported a halting of any significant maxillary growth in females after age 12, and showed some small growth continuing in males to as late as 20. Timing treatment to
before age 8. Multiple studies support this “earlier is better” approach to maxillary protraction. Franchi et al34 reported that treatment with rapid maxillary expansion and maxillary protraction is more effective when it is begun in early mixed or late deciduous dentition rather than in the late mixed dentition. However, they also reported that patients treated earlier saw greater post-pubertal modifications in both maxillary and mandibular structures, while the later treatment resulted in only a significant restriction of mandibular growth. Similarly, Kapust et al35 compared three separate age groups (4-7 years old, 7-10 years old, and 10-14 years old) and reported that the youngest group showed the greatest treatment change. Finally, Saadia et al36 also reported that orthopedic treatment changes were greater in a younger patients (3-9 years old) as compared to those treated later (9-12).
However, successful maxillary protraction can occur when treatment is initiated later. For example, Merwin et al37 reported no difference in orthopedic outcomes when maxillary protraction therapy was initiated either before age 8 (5-8) or after age 8 (8-12). This finding was supported by Takada15 who reported successful maxillary protraction and chin cup therapy through puberty, but suggested treatment did not produce significant orthopedic results in post-pubertal patients. Similarly, Cha10 compared treatment outcomes in patients from three age groups: pre-pubertal growth spurt, during pubertal growth spurt, and post-pubertal growth spurt. He reported no difference in the effects of maxillary protraction between pre-pubertal patients and patients treated during their pubertal growth spurt. However, the post-pubertal group showed less orthopedic change (maxillary advancement) and more dentoalveolar change than the other groups. Clinical results of maxillary
11
old, 10-12 years old, and 12-13 years old). These reports are clearly contrary to the idea that earlier treatment is absolutely better than late, and offer a different perspective with regard to treatment timing of maxillary protraction.
Many Class III patients ultimately do require orthognathic surgery to correct their malocclusion. Some maxillary deficient patients have malocclusions severe enough to require early treatment to improve appearance and prevent negative stigmatization. The problem with any early treatment in these patients (surgery or orthopedic) is that there is the risk of the patient outgrowing the initial correction, necessitating re-treatment. The problem with late treatment is that the chance for maximum orthopedic correction is missed, and the patient may have to carry an increased social burden during adolescent years. Thus, early maxillary protraction may be undertaken for several reasons: 1) to maximize the chance of orthopedic correction and achieve a possible “one-shot” correction; 2) improve the
appearance during adolescent years so as to minimize the social burden; 3) reduce the magnitude of future surgical movements or avoid the need for surgical re-treatment.
Temporary Skeletal Anchorage
when subjected to orthodontic forces. Currently there are several general types of implantable devices for use as orthodontic anchorage. These include conventional endosseous dental implants (which are not intended to be temporary), palatal implants, onplants, miniscrews, and miniplates. Numerous studies have shown all of these types of devices to be valuable treatment modalities.39
Titanium miniplates are frequently used in orthognathic surgery for osteotomy fixation or in the fixation of fractures. Several authors have reported the successful use of titanium miniplates as skeletal anchorage devices for multiple orthodontic applications.40-43 These applications have almost exclusively been focused on achieving different dental movements. Recently there have been some case reports that have explored the use of TADs as an adjunct to orthopedic treatment. This idea had already been introduced in 1985 by Kokich et al44 who applied protraction forces from a face mask to intentionally ankylosed primary canines in a maxillary deficient patient. This force applied to the canines resulted in 4 mm of maxillary protraction. Though the authors did not use temporary skeletal anchorage devices, their “natural implants” resulted in outcomes similar to those seen with such
devices.
In 1988 Smalley et al45 experimented with osseointegrated Branemark style implants used for maxillary protraction in monkeys (Macaca nemestrina). In this study implants were
13
zygomatic implants. The force was maintained for 12-18 weeks in all animals until approximately 8 mm of maxillary anterior displacement had occurred. Dry skull analysis showed significant sutural expansion with bones adjacent to the zygomaticomaxillary and palatomaxillary sutures completely disarticulated. Disarticulation of bones adjacent to zygomaticofrontal and sphenozygomatic sutures also occurred in one of the animals. This significant skeletal protraction in all animals was supported by cephalometric analysis as well.
These ideas of using implantable devices have been extended to clinical care, and case reports of patients treated with various techniques have started to appear over recent years. All of the available reports involve the use of a face mask for application of force to some type of implantable device. The first of these reports was by Singer et al46 in 2000, and it documented the treatment of a 12 year old female with a Class III malocclusion with maxillary deficiency secondary to unilateral cleft lip and palate repair. The patient had two Branemark implants placed in the zygomatic buttresses of the maxilla, and 400g of elastic traction was applied from a Petit facemask to abutments on the implants. The force was applied at a 30 degree downward angle to the occlusal plane. The patient was instructed to wear the facemask 14 hours per day and traction was continued for 8 months until positive overjet was achieved. Cephalometric analysis showed 4 mm of forward and downward movement of the maxilla as well as slight clockwise rotation of the mandible.
Three years later Enacar et al47 reported treatment of a 10 year old girl, again with extraoral protraction forces from a face mask to an implant supported appliance. The patient was missing multiple teeth, so the anterior teeth were all banded and a palatal bar was
maxillary alveolus. The appliance also had a labial wire in the incisor region that included hooks for elastic fixation. A Petit facemask was used to apply 800g of force to both of the appliance hooks, and the forces were directed at approximately 30 degrees downward to the occlusal plane. Traction was continued for seven months until positive overjet was achieved. Cephalometric analysis showed approximately 3 mm of anterior displacement of the ANS region. The analysis also showed significant clockwise rotation of the mandible that is consistent with facemask wear.
In 2005 Hong et al48 reported treatment of an 11 year old girl with extraoral
protraction forces to an onplant placed on the palatal bone. A transpalatal arch was soldered to a cast splint that was connected to all maxillary teeth. This appliance was attached to the onplant. A Petit facemask was used to apply 400g of force per side to the canine regions, and the force was directed at 30 degrees downward to the occlusal plane. The patient was
instructed to wear the facemask for 12 hours per day, and traction was continued for 12 months until positive overjet had been achieved. Cephalometric analysis showed that the maxilla was displaced 2.9 mm horizontally and 2.9 mm vertically. The analysis also showed some clockwise rotation of the mandible. In the same year Liu et al49 reported their
technique of sutural distraction osteogenesis (SDO) which involved protraction forces from a face mask to traction hooks that were anchored to holes on the lateral aspects of the piriform aperture, and extended out through the nostrils. The authors reported dramatic midfacial advancement in patients between the ages of 6 to 12 years.
15
extensions by means of face mask supported elastics. Later the force magnitude was increased to 350 g per side. Throughout treatment the force was applied at a 30 degree downward angle to the occlusal plane. The patient was instructed to wear the facemask full time, and traction was continued for 12 months until positive overjet was achieved.
Cephalometric analysis showed that the maxilla was displaced 8 mm anteriorly, and there was slight clockwise rotation of the mandible.
The most recent of these reports was published by Kircelli et al51 in 2008, who reported the outcomes of six consecutive cases treated in the same manner as their earlier report, and a mean A-point advancement of 4.8 mm was observed. The authors also noted significant change in the infraorbital region.
While the case reports are limited they do appear to show great potential for the use of TADs as adjuncts to orthopedic treatment. All of the available reports involved the use of extra oral traction by means of a face mask, and to date there is no published documentation of using TADs in both jaws with traction from intermaxillary elastics instead. This is clearly an area that requires further investigation. With any new treatment it is important to
carefully assess the outcomes in ways that help to maximize our understanding of the changes. With the relatively recent advent of 3D radiographic imaging in dentistry it is possible to gain significantly more information than 2D imaging alone.
Three Dimensional Imaging
imaging that particularly hinder the attempt to provide a more comprehensive description of treatment outcomes. Diagnosis, treatment planning, and assessment of change over time have been based on the use of 2D landmarks. Angular and linear measurements between landmarks are able to provide useful information about change over time in the
anteroposterior and vertical planes of space, but even then the assessment is based on change that occurred at discrete points placed on a 2D rendering of a 3D object. Inherent in this approach is the limitation of being unable to assess how entire surfaces changed rather than discrete points. Furthermore, the lateral cephalogram provides no information with regard to the transverse plane of space, while the PA cephalogram is only of limited value for
assessing change in this dimension. It seems clear that the significantly greater amount of information acquired with 3D imaging techniques has the potential to allow for more thorough diagnosis, treatment planning, and assessment of change over time.
With the introduction of computed tomography (CT) there was the potential to provide high quality, accurate 3D images of any anatomic region. Conventional CT has had some applications in dentistry, but has been hindered by several limitations. CT scans have tended to be more expensive, require longer scan times, and have a higher ionizing radiation exposure. Recently there have been several advances in the area of 3D dental radiographic imaging including the use of Cone Beam Computed Tomography (CBCT). CT and CBCT differ in a variety of ways. With conventional CT the acquisition of the image is achieved by the rotation of a fan shaped x-ray beam in a circular or spiral pattern around the patient. This x-ray beam is emitted from a high output rotating anode generator. The result of a
17
images are acquired by means of a fixed low-energy anode that emits a cone shaped x-ray beam that is directed at the region of interest. The beam passes 360 degrees around the patient in one revolution versus the multiple revolutions necessary with conventional CT. This cone-shaped beam coupled with a special image intensifier and sensor lead to efficient use of x-ray emission and reduced absorbed dose of radiation to the patient.53 The radiation exposure dose is significantly different between conventional CT and CBCT. CBCT use for maxillofacial imaging produces an effective dose that is 8-10 times less than a similar conventional CT exam.54 A CBCT scan has ionizing radiation exposure to the patient that is between 2 and 4.5 times higher than a lateral cephalometric and panoramic film combined.55 The average scan time for image acquisition of a CBCT is between 10-40 seconds and exposure dose is about 50 µSv.56 With regard to ionizing radiation exposure, the 150µSv associated with a full mouth radiographic examination (D speed film, round collimation) utilizes about 3 times the dose of the New Tom 3G exam.55 This dose is equivalent to 4-6 days of per capita background dose.
The image resolution of CBCT is between 0.1-0.5 mm depending on the scanner and its settings. These values are the dimensions in the x, y, and z planes of the smallest element of a 3D image, known as a volume element (voxel).53
projection is also eliminated with CBCT data. Traditional 2D imaging always yields some level of projection error due to the fact that the anatomic area of interest is some distance from the film onto which the image is being projected. CBCT projections are orthogonal, meaning that the x-ray beams are parallel to one another, and the source to object distance is quite small resulting in very little projection error. The small amount of projection error that does exist is corrected by the CBCT scanner’s software which results in 1to1 data.52
Superimposition of lateral cephalometric films has been the standard in objective assessment and quantification of changes due to treatment and growth for many years. However, recently the superimposition of 3D models created from CBCT scans has been explored and validated in non-growing orthognathic surgery patients.57, 58
The diagnostic data that is acquired for a CBCT scan is not limited to 3D information only. Orthodontists are familiar with analyzing the standard 2D lateral cephalograms and panoramic radiographs, and both of these projections can be created by imaging software directly from the CBCT data. This allows the orthodontist to obtain the traditional 2D images as well as 3D data all from one exposure. The “synthetic” cephalograms created from CBCT have been shown to recreate conventional cephalometric geometry with similar precision and accuracy.59, 60 Furthermore, midsaggittal plane measurements are made with greater accuracy from orthogonal CBCT projections than from conventional cephalometric images, or non orthogonal (perspective) CBCT projections.59
III. METHODS
A prospective study was undertaken in the Department of Orthodontics at the University of North Carolina at Chapel Hill (UNC) School of Dentistry to explore the treatment outcomes in patients treated with a novel technique of maxillary protraction using intermaxillary elastics between TADs in the maxilla and mandible. This was a pilot study employing collaboration between the UNC Department of Orthodontics, The Universite Catholique de Louvain in Brussels, Belgium, and a private practitioner in Brussels, Belgium. This project was approved by the Committee for Research on Human Subjects at the
University of North Carolina.
Sample Selection
The goal for the study was to enroll 3-7 patients between ages 9 and 14 years to participate in the experimental treatment protocol and have outcomes analyzed. There was concern that there may be difficulty enrolling enough subjects at one center, so the decision was made to collaborate with colleagues in Belgium who developed the experimental treatment protocol. Criteria that determined who could participate in the study were as follows:
Inclusion Criteria
• Between the ages of 9-14 years of age at the initiation of treatment
• Class III dental occlusion as determined by the relationship of the permanent first molars, and or overjet less than or equal to zero.
• Adequate dental development. Specifically, the mandibular permanent canines had to be erupted or near eruption in order to avoid risk of injury to these teeth during
surgical placement of the miniplates.
Exclusion Criteria
• Outside the age range of 9-14 years at initiation of treatment. This range was defined by recommendations in the literature associated with traditional methods of maxillary protraction, as well as limitations associated with this specific treatment technique. Patients younger than 9 years might experience a therapeutic benefit from the protraction treatment, but lack of dental development complicates the TAD
placement. Specifically, in patients younger than 9 years there is an increased chance of insufficient vertical development of the maxilla in the infrazygomatic region as well as increased chance of surgical damage to permanent tooth buds or roots in the mandible. With age these concerns become less evident. The upper age limit was set at 14 years because the existing body of literature suggests that orthopedic treatment (maxillary protraction) tends to be less successful after cessation of adolescent growth. Fourteen is already older than what most of the literature would suggest as the ideal time to initiate orthopedic treatment. However, following the hypothesis that protraction of the maxilla using TADs would allow for maximum orthopedic change, it seemed reasonable to evaluate a wider age range.
21
vertical development of the maxilla or mandible preclude safe placement of the skeletal anchorage devices, then such patients would be excluded. An assessment of these conditions was made by means of clinical examination at the time of initial screening for acceptance into the Graduate Orthodontic or Pediatric Dentistry clinics at the University of North Carolina School of Dentistry.
• Congenital defects with craniofacial manifestations including but not limited to cleft lip / palate and synostoses.
• Previous or current orthodontic / dentofacial orthopedic treatment. Such patients could have dentoalveolar compensations as a result of treatment that could mask the outcomes of the experimental treatment. In patients undergoing orthodontic
treatment it would be difficult to determine whether outcomes were due to the experimental maxillary protraction or to orthodontic compensations.
• Medical conditions that require antibiotic prophylaxis during dental procedures to prevent bacteremias. Immunosuppressant therapy, bleeding problems associated with anticoagulant therapy, hemophilia, leukemia, liver disease, and congenital heart disease were also contraindications for participation in this study.
In the UNC arm of the study an email and letter were sent to all residents and
attending faculty in the Departments of Orthodontics and Pediatric Dentistry informing them of the study and asking for their aid in identifying patients who might be eligible to
exclusion criteria were evident. In the Belgian arm of the study, patients were identified by one orthodontist (HD) in his private practice office, and by one orthodontist (MC) in the graduate orthodontic clinic at the Universite Catholique de Louvain.
Consent
All patients (in the UNC arm) who met inclusion criteria were approached by the principle investigator and inquiry was made about their willingness to participate in the study. Participation was defined as the patient agreeing to the proposed treatment protocol (including the surgical protocol), and to allowing the use of data in the form of clinical exam and associated records (photos, models, etc.), treatment progress records, and CBCT data. Standardized consent, assent, and Health Insurance Portability and Accountability Act (HIPAA) authorization forms were completed to formally enroll patients in the study. Any questions from the patients or parents were answered before consent was obtained.
Sample Demographics
23
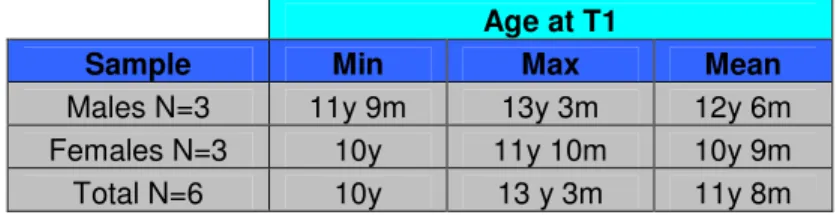
At the time of writing, 6 consecutively completed patients identified from the Belgian private practice and university orthodontic clinic arms of this study had been completed and their treatment outcomes analyzed. These 6 patients were comprised of 3 males and 3 females with an average age of 11 years 8 months. Demographics of the sample are summarized in the table 1 below.
Table 1: Age and Sex of Sample
Age at T1
Sample Min Max Mean
Males N=3 11y 9m 13y 3m 12y 6m Females N=3 10y 11y 10m 10y 9m Total N=6 10y 13 y 3m 11y 8m
Experimental Protocols
The treatment protocols used in this study were based on the clinical experience of one orthodontist (HD) who developed this specific technique. All attempts were made to adhere to the same protocols at all sites.
Surgical Procedure
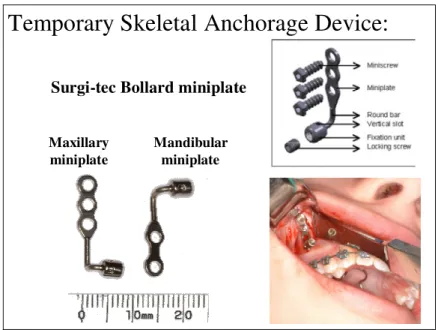
In each patientfour miniplates were placed in total--two in the infrazygomatic buttress region of the maxilla (one on each side) and two in the anterior mandible inferior to the canines (one on each side). Surgi-tec Bollard miniplates (Surgi-tec, Bruges, Belgium) were used in this study. These devices are titanium miniplates modified by incorporating an intraoral head with locking fixation screw to allow customizable attachments to be added (figure 1). The maxillary surgical procedure involved making an L shaped incision with a convex anterior bend. The vertical portion of the incision was made approximately 1 cm mesial to the infrazygomatic buttress and parallel to it. This incision extended to
was then extended distally while remaining approximately 2 mm below the mucogingival junction and parallel to it. A mucoperiosteal flap with a posterior border was reflected to expose the osseous surface. The maxillary miniplate was contoured so that it made good contact with the cortical bone. The miniplates were positioned so that the extension arms exited approximately 2 mm below the mucogingival junction through keratinized tissue (figure 1). When at the appropriate location, the miniplate was secured with 3 titanium miniscrews following drilling of pilot holes with copious saline irrigation.
25
Temporary Skeletal Anchorage Device:
Surgi-tec Bollard miniplate
Maxillary miniplate
Mandibular miniplate
Figure 1: Titanium miniplates and surgical procedure
In the UNC arm the principle investigator was present at all surgical procedures to deliver the temporary skeletal anchorage devices and ensure that protocol was followed. All procedures at UNC were done by two different Oral and Maxillofacial Surgery residents at the UNC School of Dentistry. In the Belgian arm of the study all procedures were done by the same experienced oral surgeon. In all cases the surgeries took place under local
anesthesia, with IV sedation. General anesthesia was available if judged to be necessary by attending surgeon. The surgical sites were allowed to heal for 2-3 weeks before orthodontic loading began.
Post-surgical instructions included:
• recommendation for ice application to minimize swelling for a minimum of 2 hours after the procedure
• avoidance of playing with the TADs with the tongue • prescription for Chlorhexidine rinse for 2 weeks
At the conclusion of orthopedic treatment the bone anchors were removed following the same surgical procedure as when placed. These surgical procedures have been shown to be generally well tolerated by patients.61
Orthopedic Protocol
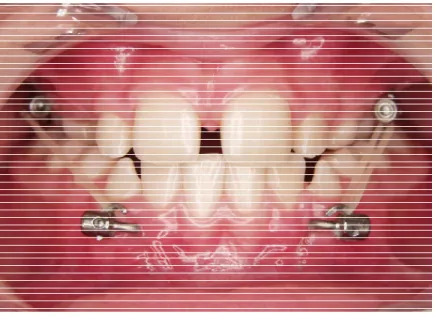
Loading of the bone anchors began 3 weeks after the surgical procedure. Orthodontic elastics were attached to small extension hooks bent out of .032” x .032” stainless steel wire, which were secured directly to the intraoral extension arms of the
27
treatment was made based on observed treatment outcome. When adequate positive overjet was achieved orthopedic treatment was discontinued.
Image from Dr. Hugo De Clerck
Figure 2: Clinical technique of attaching elastics to modified miniplates
Radiographic Protocol
panoramic and lateral cephalometric images. With this approach the exposure to ionizing radiation beyond what is associated with the traditional exam, was minimized. Upon completion of treatment the immediate pre-surgical (T1) scan and the final (T2) scan were processed and superimposed to ascertain the orthopedic and / or dentoalveolar changes.
CBCT Data Processing
The data acquired from the CBCT scans was a series of DICOM (Digital Imaging and Communications in Medicine—the standard for distributing any medical images regardless of the machine used for acquisition) files, with one file for each of over 300 slices. Before the images could be analyzed several steps had to take place to process the data using different software tools. The method used in this study was an application of those previously described by Cevidanes57, 58, 62, but applied to growing patients.
Image Acquisition
The imaging protocol at UNC involved a 70 second scan in the New Tom 9000 machine with a 12” field of view. The maximum spatial image resolution was set at 0.3 mm. Images taken in Belgium using the iCat machine used a 40 second scan and a 16 x 22 cm field of view.
Construction of 3D Models by Segmentation
29
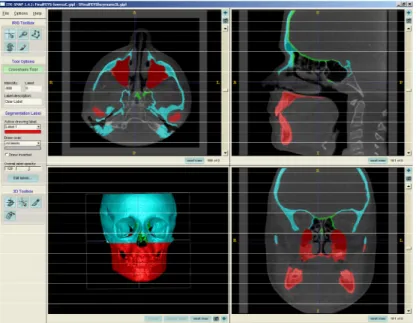
process of defining the shape of structures in each orthogonal slice (axial, coronal, sagittal) by outlining the structures seen in each cross section (figure 3).
structures that were missed. The manual mode allows direct “painting” of structures where the goal is to stay within the lines of the anatomic structures in order to clean up or refine the results of the semi-automatic segmentation. The outcome of this step is a true 3D surface model, which was created from both the initial and post treatment scans for each patient (figure 4).
Pre treatment Post treatment
Figure 4: T1 and T2 3D models prior to registration
Registration of 3D Models
31
histological data from cadavers, Melsen66 reported that the internal surfaces of the frontal bone and the cribiform plate are the anterior cranial fossa structures that become stable at the earliest age. Melsen found that remodeling at these structures has ceased after the age of 4 in the majority of cases. She concluded that these structures were particularly well suited as references for radiographic analysis over time due to their stability in both the sagittal and vertical planes after age 6-7. These findings confirm those of several earlier studies67, 68 that indicate completion of growth in these anterior cranial fossa structures early in life.
Once the initial and final CBCT’s and segmentations were registered using these surfaces, then the segmentations were cropped to yield four different models: a soft tissue profile model, a hard tissue skull model (including maxilla, mandible and cranial base), a maxilla and mandible only model (with cranial base cropped away), and a cranial base only model (with maxilla and mandible cropped away.). Only after this step was completed could the models be superimposed and treatment change assessed.
Unregistered Initial Model
Unregistered Final Model
Frontal Lateral
Superimposition and Assessment of Treatment Change
Before the 8 different models (initial and final for the soft tissue profile, skull, maxilla and mandible, and cranial base ) could be superimposed, the files had to be converted from Gipl to iv format to generate the 3D surfaces, using the program Vol 2 Surf to complete this process. The outcome file was then loaded into the superimposition program, cmfApp.69 Accurate quantitative measurement is necessary to assess treatment change, growth, and hard tissue surface remodeling. Iterative Closest Point (ICP) is the method used by most
33
apposition at the posterior condylar surfaces, when in reality posterior repositioning of the entire mandible occurred. Color maps are a helpful aid in assessing outcomes, but require a basic understanding of what they are truly reporting, and care must be taken to not make incorrect interpretations about what actually occurred.
An alternative way of displaying the treatment change is to superimpose both models and modify the final model to be semi-transparent so that the underlying initial model can be visualized (figure 6). The color map method allows for both visual and quantitative
assessment of treatment change. Both hard and soft tissue surfaces from the pre and post treatment models were assessed.
Initial Final
mm mm
Color Map Visualization Tool
Semi-transparency Visualization Tool
Figure 6: 3D model superimposition visualization tools
Inter-examiner Reliability
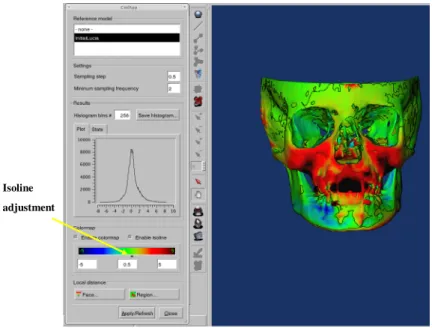
registration and superimposition. For each patient, the three examiners’ superimposed registered models were simultaneously visualized using the cmfApp software in the color map view. This software tool allows the user to define a surface distance value that is expressed as a contour line (isoline) on the superimposition that corresponds to regions on the model that have a surface distance of equal to or greater than the defined value (figure 7). Similarity between the different examiners’ models can be assessed in two ways: 1) the same surface distance value can be entered for each model and the area defined by the isoline boundary can be compared across examiners. This approach provides a qualitative
35
Isoline adjustment
Figure 7: Illustration of color map visualization tool with isolines
Creation of 2D Data
IV. RESULTS 2D Description of Outcomes
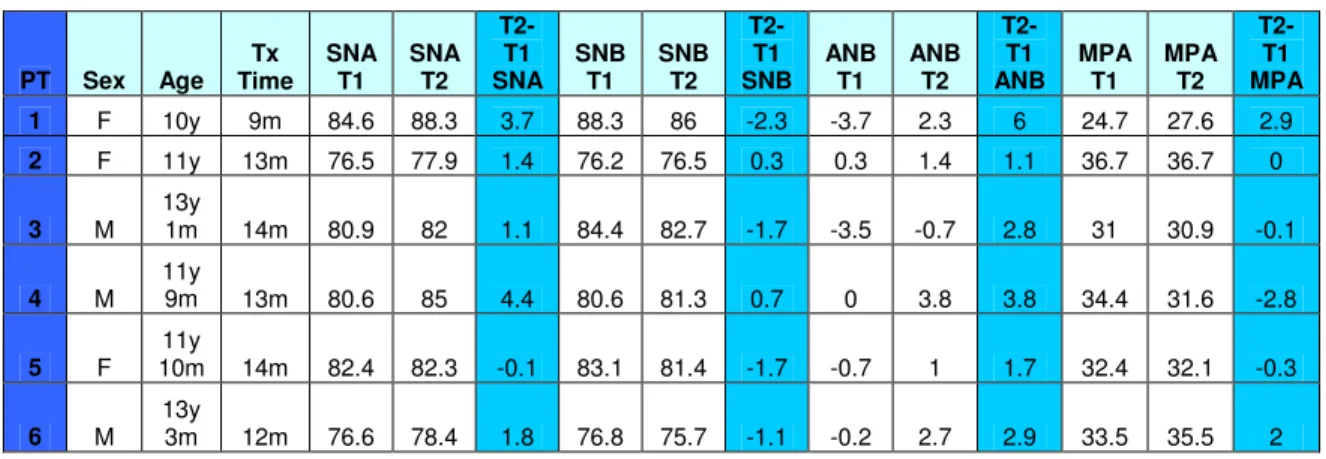
For each of the 6 cases analyzed in this study two lateral cephalogram projections were created (T1 and T2) from the CBCT data. These cephalograms were digitized according to the protocol previously described, and the following angular measurements were recorded: SNA, SNB, ANB, MPA, U1-SN, and IMPA. The linear distance between T1 and T2 A point was also evaluated using the Dolphin 10.1 x-y coordinate system using Sella as the coordinate center of the T1 tracing. This coordinate system compared all T1 and T2 landmarks, and calculated the linear distance between them in millimeters. All of these cephalometric measures are consistent with those that are most commonly reported in the existing body of literature pertaining to RPHG outcomes assessed by cephalometric change.
Table 2: Skeletal cephalometric values (in degrees) for each patient
PT Sex Age Tx Time SNA T1 SNA T2 T2-T1 SNA SNB T1 SNB T2 T2-T1 SNB ANB T1 ANB T2 T2-T1 ANB MPA T1 MPA T2 T2-T1 MPA
1 F 10y 9m 84.6 88.3 3.7 88.3 86 -2.3 -3.7 2.3 6 24.7 27.6 2.9
2 F 11y 13m 76.5 77.9 1.4 76.2 76.5 0.3 0.3 1.4 1.1 36.7 36.7 0
3 M 13y
1m 14m 80.9 82 1.1 84.4 82.7 -1.7 -3.5 -0.7 2.8 31 30.9 -0.1
4 M 11y
9m 13m 80.6 85 4.4 80.6 81.3 0.7 0 3.8 3.8 34.4 31.6 -2.8
5 F 11y
10m 14m 82.4 82.3 -0.1 83.1 81.4 -1.7 -0.7 1 1.7 32.4 32.1 -0.3
6 M 13y
3m 12m 76.6 78.4 1.8 76.8 75.7 -1.1 -0.2 2.7 2.9 33.5 35.5 2
The dentoalveolar changes also showed significant variability. Maxillary incisor angulation assessed by the U1-SN angle, showed positive change in three patients, while three patients showed negative change. Mandibular incisor angulation assessed by the IMPA angle, showed a positive change for all patients. (tables 3 and 4)
Table 3: Cephalometric values (in degrees) for dentoalveolar change for each patient
PT Sex Age Treatment Time U1-SN T1 U1-SN T2 T2-T1 U1-SN IMPA T1 IMPA T2 T2-T1 IMPA
1 F 10y 9m 111.5 114.3 2.8 88.9 94.4 5.5
2 F 11y 13m 101.1 96.4 -4.7 79.6 79.7 0.1
3 M 13y 1m 14m 109.2 107.7 -1.5 81.2 82.3 1.1
4 M 11y 9m 13m 101.8 100.8 -1 79.9 87.3 7.4
5 F 11y 10m 14m 107.7 110.5 2.8 86.2 88.4 2.2
6 M 13y 3m 12m 94.2 94.6 0.4 85.3 87 1.7
Table 4: Descriptive statistics for changes in cephalometric values (in degrees)
N Minimum Maximum Mean Std. Deviation
SNA change 6 -0.1 4.4 2.1 1.69
SNB change 6 -2.3 0.7 -0.97 1.2
ANB Change 6 1.1 6 3.05 1.73
MPA Change 6 -2.8 2.9 0.28 1.99
U1-SN change 6 -4.7 2.8 -0.2 2.86
39
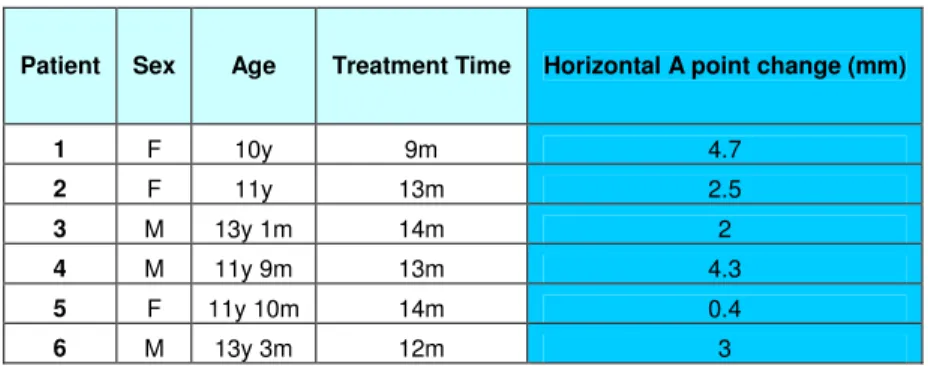
The linear change in millimeters for A point were calculated using the x-y coordinate system described earlier. The values for horizontal change showed considerable variation, but were all positive, ranging from 0.4 to 4.7 mm (table 5).
Table 5: Linear change (in millimeters) in A point for each patient.
Patient Sex Age Treatment Time Horizontal A point change (mm)
1 F 10y 9m 4.7
2 F 11y 13m 2.5
3 M 13y 1m 14m 2
4 M 11y 9m 13m 4.3
5 F 11y 10m 14m 0.4
6 M 13y 3m 12m 3
Comparison to Existing 2D Data
There are numerous studies2, 6-19, 35, 36, 70-74 that use cephalometric measures to report outcomes in patients treated with RPHG. In 1999, Kim et al13 published a meta-analysis evaluating the effectiveness of protraction face mask therapy. Fourteen studies met their inclusion criteria, which included having acceptable cephalometric quantification and a comprehensive description of treatment protocol. The authors reported the results of all studies combined, as well as those stratified by age. For the results of all studies combined the mean values for change during treatment were as follows: SNA was 1.7 ±1.6 degrees, SNB was -1.2 ± 1.4 degrees, ANB was 2.8 ±1.9 degrees, MPA was 1.5 ± 1.7 degrees, U1 angulation was 2.8 ± 6.9 degrees, and L1 angulation was -2.9 ± degrees. This data is helpful in giving a general picture of what outcomes are seen in patients treated with RPHG.
analysis, however several other studies with samples of a similar age range were added to theirs to increase sample size. Table 6 is an adaptation from Kim et al13 displaying treatment outcome by different age groups (range 9.6 to 15 years of age). The cephalometric values are similar in pattern to those listed earlier from all studies not sorted by age, but the orthopedic changes tended to be slightly less.
Table 6: Summary of cephalometric values from studies with age range of 9-14 years (adapted from Kim et al13)
Author Mean Age (Range) N TX Time (months) T2-T1 SNA T2-T1 SNB T2-T1 ANB T2-T1 MPA T2-T1 U1 T2-T1 L1 T2-T1 A pt. (horiz. mm)
Kapust (10-14) @ T2 16 9.8 1.9 -1.2 3 1 -3.7 2.8
Baik (10-12) @ T2 22 6.5 1.7 -1.1 2.8 1.8 2.2
Baik (12-13) @ T2 15 6.5 1.7 -0.7 2.1 1.8
Battagel 10.8 39 24 0.4 -0.6 0.9 1 4 -2.5 0.9
Lim (10-12) @ T2 39 7.5 1.7 -1.5 3.2 2 1.5 -1.5 2.1
Lim (12-14) @ T2 17 6.9 1.5 -1.6 3.1 1.8 1.2 -1.6 1.9
Takada (10-12) @ T2 22 12 2 -1.2 3.3 1.6 1.8 1.4
Takada (12-15) @ T2 19 17 0.9 -0.4 1.3 0.1 0.9 -0.6
Sung 9.6 @ T1 20 8.9 1.7 -1.3 3 1.6 2.1
Sung 10.6 @ T1 30 7.9 1.7 1.4 3.1 1.5 2.2
Sung 11.5 @ T1 23 8.3 2 -1.1 3 1.7 2.1
Sung 12.7 @ T1 18 9.1 1 -1.6 2.5 2.1 1.7
Ishii (1987) 10.7 63 15.8 2.2 -1 3.2 0.9 5.4 -4.9 1.5
Cozzani 10.2 8 13.5 3.5 1 2.4
Total 351 351 351 351 312 215 215 302
Mean 10.9 1.7 -0.78 2.6 1.5 2.3 -1.9 1.9
41
for the RPHG studies). Values for ANB change were also similar between the two groups (3.05 degrees for this study versus 2.6 degrees for the RPHG studies). The values of change for MPA showed greater difference with this study showing less of an increase than the RPHG studies (0.28 versus 1.5 degrees). The greatest difference in values between these two groups was seen in the measures of upper and lower incisor angulations. The patients in this study had a very small negative change in upper incisor angulation, whereas the RPHG studies showed positive change (-0.2 degrees for this study versus 2.3 degrees for the RPHG studies). Even greater difference was seen for the lower incisor angulation. This study showed a mean change of 3 degrees, while the RPHG data showed a mean change of -1.9 degrees. With regard to change in A-point, there was a mean change of 2.8 mm for this study, while the RPHG studies showed 1.9 mm of change. These differences are summarized in Table 7.
Table 7: Comparison of cephalometric data from this study with RPHG data
Sample Age @ T1 (Range) N
TX Time (months) T2-T1 SNA T2-T1 SNB T2-T1 ANB T2-T1 MPA T2-T1 U1 T2-T1 L1 T2-T1 A pt. (horiz. mm)
Patient #1 10y 1 9 3.7 -2.3 6 2.9 2.8 5.5 4.7
Patient #2 11y 1 13 1.4 0.3 1.1 0 -4.7 0.1 2.5
Patient #3 13y 1m 1 14 1.1 -1.7 2.8 -0.1 -1.5 1.1 2
Patient #4 11y 9m 1 13 4.4 0.7 3.8 -2.8 -1 7.4 4.3
Patient #5 11y 10m 1 14 -0.1 -1.7 1.7 -0.3 2.8 2.2 0.4
Patient #6 13y 3m 1 12 1.8 -1.1 2.9 2 0.4 1.7 3
Mean Values
for this Study 11y 8m 6 12.5 2.1 -0.97 3.05 0.28 -0.2 3 2.8
RPHG Literature
Total
3D Description of Outcomes
Following superimposition of T1 and T2 models from each of the 6 cases, the treatment outcomes were assessed using the visualization tools previously described. Each case was evaluated with focus on the following anatomic regions: Anterior surface of the maxilla in the region encompassing A point, zygomatic processes of the maxilla, anterior mandible in the region of pogonion, anterior and posterior surfaces of the condyles, the inferior borders of the mandible, and the glenoid fossae (Appendices I-IV). In order to make quantitative and qualitative assessments about changes observed in these regions, the color map and semi-transparency visualization tools were used in the cmfApp software. The magnitude of change between T1 and T2 models for the various anatomic regions was calculated using the isoline tool on the color maps. It is important to remember that all values are a representation of change that was equal to or greater than that value. Detailed descriptions and superimposition images for each case are located in Appendices V-X.
43
mm mm
Figure 8: Composite of 3D superimpositions for all cases (color maps)
Initial Final
Figure 9: Composite 3D superimpositions of all cases (maxilla and mandible semi-transparencies)
anterior surface of the condyles, all cases showed negative change. The range of these values was -0.5 to -3.1 mm, with a mean of -1.4 mm.
Initial Final
Figure 10: Composite of 3D superimpositions of all cases (superior view of maxilla and mandible semi-transparencies)
The inferior border of the mandible showed positive change for all patients. The range of values for this region was 0.3 to 3.4 mm, with a mean of 1.62 mm (figure 11).
45
In general all cases showed very little change in the glenoid fossae, but 3 showed slight negative change on the posterior and superior surfaces, and one showed slight positive change on the anterior surfaces (figure 12).
Initial Final
Figure 13: Composite of 3D superimpositions for all cases (soft tissue semi-transparencies)
47
Table 8: Surface distances (in millimeters as determined by isolines) by anatomic region for all patients
PT Sex Age TX Time
Zygo-matic Process
Ant. Max. Chin
Right Ant. Cond. Right Post. Cond. Left Ant. Cond. Left Post. Cond. Inf. border mand. Soft tissue upper lip
1 F 10y 9m 3.8 3.5 0.6 -0.5 1.1 -0.5 1 2 4.6
2 F 11y 13m 1.8 1.5 0.7 -1.3 1.6 -1.3 1.3 0.6 1.2
3 M 13y 1m 14m 2.2 2.8 1.3 -0.9 0.5 -1.2 1.3 2.9 3.6
4 M 11y 9m 13m 1.7 1.9 -0.2 -3.1 3.3 -2 3.2 0.3 1.9
5 F 11y 10m 14m 1.2 1 -0.1 -1.6 1.2 -1.5 1.7 0.5 1.5
6 M 13y 3m 12m 1.1 -0.5 -2.7 -1.5 1.9 -2 2.4 3.4 0.4
Table 9: Descriptive statistics of surface distances by anatomic regions for all patients
N Minimum Maximum Mean Std. Deviation
Zygomatic Process 6 1.1 3.8 1.97 0.99
Ant. Max. 6 -0.5 3.5 1.7 1.4
Chin 6 -2.7 1.3 -0.07 1.4
Right Ant. Cond. 6 -3.1 -0.5 -1.48 0.89
Right Post. Cond. 6 0.5 3.3 1.6 0.96
Left Ant. Cond. 6 -2 -0.5 -1.42 0.56
Left Post. Cond. 6 1 3.2 1.82 0.83
Inf. Border Mand. 6 0.3 3.4 1.62 1.34
Soft Tissue Upper Lip 6 0.4 4.6 2.2 1.58
Inter-examiner Reliability for 3D Superimposition Methods
Table 10: Range of variation (in millimeters) in surface distance change for various anatomic landmarks for 3 different examiners
Zygo-matic Process
Anterior Maxilla Chin
Right Anterior Condyle Right Posterior Condyle Left Anterior Condyle Left Posterior Condyle Inferior border of mandible Soft tissue upper lip Range Examiner
#1 3.8 3.5 0.6 -0.5 1.1 -0.5 1 2 4.6
Examiner
#2 3.7 3.3 0.5 -0.5 1 -0.5 1 1.8 4.2
Examiner
#3 3.7 3.3 0.5 -0.5 1 -0.6 1 2 4.4
Range 0.1 0.2 0.1 0 0.1 0.1 0 0.2 0.4
Patient
#2
Examiner
#1 1.8 1.5 0.6 -1.3 1.6 -1.3 1.3 0.6 1.4
Examiner
#2 1.4 1.1 0.2 -1.2 1.5 -1.3 1.2 0.3 1.3
Examiner
#3 1.4 1.2 0.2 -1.5 1.5 -1.3 1.2 0.6 1.1
Range 0.4 0.4 0.4 0.3 0.1 0 0.1 0.3 0.3
Patient
#3
Examiner
#1 2.2 2.8 1.3 -0.9 0.5 -1.2 1.3 2.9 3.6
Examiner
#2 2.3 2.7 1.2 -0.7 0.5 -1.1 1.5 3.3 3.5
Examiner
#3 2.5 3.2 1.5 -0.6 0.1 -1.4 1.1 3.3 4
Range 0.3 0.5 0.3 0.3 0.4 0.3 0.4 0.4 0.5
V: DISCUSSION
The intent of this study was to evaluate a novel treatment technique and describe the outcomes observed. The underlying hypothesis was that the innovative treatment would result in orthopedic correction with minimal dentoalveolar compensation. The results seem to confirm this assumption in that all patients showed at least some positive skeletal effect with no adverse dentoalveolar effects.
Limitations
This study is a first step towards defining outcomes associated with a novel Class III orthopedic technique. However, the small sample size of 6 patients prevents the
generalization of the results. Without a larger sample it is impossible to make any assessment of the effect of age, sex, treatment duration, or other possible confounding variables on treatment response.
3D databases can be gathered and used to establish norms in a way similar to current cephalometric norms. The inability to compare our results to existing 3D control data is definitely a limitation to this study. The ability to use CBCT’s to create lateral cephalograms as intermediaries does allow some general comparisons to existing 2D data. Clearly the use of 3D imaging allowed for a more comprehensive description of a new treatment technique, but the question must be raised, is this analytic method appropriate and practical for all patients? Given the increased burden on the patient in the form of ionizing radiation
exposure, coupled with the protracted length of time (25-40 hours total per patient) required to complete the segmentation, registration, and measurement processes, it seems that at this time such an analytic method has practical utility limited to research only. These issues need to be addressed before widespread use of such an analytic method becomes practical.
Variation in Treatment Response
51
the oldest patient was 13 years 3 months at T1 and he had the least maxillary and soft tissue changes. He also showed the second largest increase in MPA, and had the largest negative change at the anterior mandible. It cannot be said with certainty that age was the reason for this variation, but taken in conjunction with the available literature on the early treatment of Class III patients it seems plausible that it had some effect. Logic would suggest that beginning treatment earlier could increase the magnitude of orthopedic change. Recall that the timing of the initiation of this treatment is in part dictated by the patient reaching a
certain level of dental development (mandibular canines at or near eruption). This leaves one to wonder if the possible benefits of this approach (minimal dentoalveolar compensation and less increase in MPA compared to face mask use) outweigh the ability to begin treatment earlier with RPHG or even face mask protraction with the use of only maxillary TADs. The question requires further investigation with direct comparison of methods using a broad age range.
There were an equal number of males and females in this study and there does not appear to be any pattern with regard to treatment outcome and sex. However, the interplay between developmental age and sex may very well be relevant. That is, a 14 year old male may experience similar results to 11 year old female based on differences in timing of adolescent growth. For this reason, chronologic age alone is likely a poor predictor of treatment outcome.
until the clinical goals were achieved. Perhaps with a larger sample, a rate of change could be calculated. The expected relationship between treatment duration and magnitude of outcome was not seen in this study. In fact the case with the greatest orthopedic correction was treated for the shortest period of time. This prompts consideration of other factors that may influence treatment duration, such as patient compliance. One might expect that excellent compliance with this treatment would be easier to achieve than with the more cumbersome face mask appliance. But, there are varying degrees of compliance among orthodontic patients who wear conventional interarch elastics as part of their treatment. So why would we expect this sample to be different? It seems logical that more elastic wear would lead to increased magnitude of treatment change and decreased treatment duration, but again this remains to be tested.
Another treatment specific factor that may contribute to inter-patient variation is stability of the miniplates throughout the duration of treatment. To be able to deliver force to the maxilla and mandible all devices must maintain at least a minimum level of stability throughout treatment. There is likely a range of acceptability with regard to how stable the miniplate must be to do its job, however it is undoubtedly desirable for it remain as immobile as possible. All patients from the Belgian arm of this study had clinical success throughout the duration of their treatment, defined here as remaining in place and not becoming
53
to be postponed. While younger age groups have been reported to have lower success rates with these miniplates61, there still appears to be an inter-site disparity in failure of the devices in this study. A possible explanation for this difference may be the differing experience levels of the surgeons who placed the miniplates despite attempts to strictly follow the same surgical protocol. In Belgium all plates were placed by the same experienced oral surgeon, whereas at UNC the plates were placed by different oral surgery residents. No matter what the difference in success between the two sites, the importance of maintaining stable miniplates during treatment was highlighted. It is necessary to continue to study the variables that dictate clinical success with miniplates in patients of all ages.
a much greater area in the form of the entire maxillary dentition and its periodontium; whereas, the force is applied directly to the skeletal maxilla when miniplates are utilized.
The variation in outcomes seen in this sample is interesting, however further perspective can be gained by comparing them with data from existing studies.
Comparison to Existing 2D Data
The orthopedic outcomes seen in this study were at least comparable to those
expected with maxillary protraction using a facemask, and for some patients the results were perhaps better than expected. The dentoalveolar changes with treatment seem to follow a different pattern than is seen with face mask treatment. It has been well documented that face mask treatment results in an increase in maxillary incisor angulation and decrease in mandibular incisor angulation.11,15, 35, 71, 77 The results seen in this study were the opposite of this expected compensation—that is the maxillary incisors showed a range of response (-4.7 to 2.8 degrees) with a mean of -0.2 degrees of change, and the mandibular incisors increased in angulation in every case (0.1 to 7.4 degrees). These findings support the underlying hypothesis of this study which was that orthopedic treatment with TADs would result in maxillary protraction with minimal dentoalveolar compensation. These dentoalveolar effects are likely explained by alteration of soft tissue equilibrium forces. That is, perhaps increased tongue pressure results in proclination of lower incisors as the mandible is repositioned slightly more posterior. Also, advancement of the maxilla may increase the forces from the upper lip upon the maxillary incisors resulting in uprighting of these teeth. If this pattern of dentoalveolar changes could be shown to be a consistent finding with this treatment
55
Another 2D finding from this study that was a possible deviation from what may have been expected in face mask treatment was the change in mandibular plane angle. It is well documented that MPA tends to increase significantly during protraction facemask
therapy9,15,71,77, while it decreases over the same time in untreated Class III patients.14, 74 Change in mandibular plane in the patients assessed in this study ranged from -2.8 to 2.9 degrees with a mean of 0.28 degrees. Of the six patients, three showed negative change, one showed zero change, and two showed positive change in MPA. One might expect increases in MPA would be minimized with this treatment based on the force vectors involved. While facemask therapy is applying a downward and backward force to the mandible, this treatment applies an upward and backward force. The MPA findings are interesting because if MPA could be shown to consistently decrease or remain nearly the same over treatment, then it would perhaps represent a distinct advantage to protraction face mask therapy. This could certainly be a promising finding with regard to treatment of high angle Class III patients for whom any increase in MPA would be undesirable.
It is also possible to make comparisons between 2D data from this study and existing data from untreated Class III patients of similar ages. The existing data on untreated Class III growth falls into one of three categories: 1) longitudinal data of untreated Class III subjects, 2) cross-sectional data from untreated Class III samples, or 3) historical
cephalometric growth studies. The ideal source of this type of data would be from a large sample of untreated Class III individuals who were followed longitudinally. However, such a sample is not often found in the literature due to the low prevalence of Class III
colleagues14 compiled serial cephalometric records from 27 untreated Class III individuals and they compared the annualized changes to matched Class I subjects from the University of Michigan Growth Study, and to a sample of patients treated with protraction face mask. The comparison between the two control groups showed significantly less advancement of A point in the Class III group than the Class I group (0.41 mm versus 0.88 mm) Perhaps even more interesting was the differences found between the treatment group and Class III control group. SNA change for the treatment and control groups was 2.31 and 0.02 degrees
respectively, with a difference between the two of 2.59 degrees. SNB change for the



![Hexaaquadibromidoeuropium(III) bromide, [EuBr2(H2O)6]Br](data:image/gif;base64,R0lGODlhAQABAIAAAP///wAAACH5BAEAAAAALAAAAAABAAEAAAICRAEAOw==)