© The Author 2016. Published by Oxford University Press on behalf of The Gerontological Society of America. All rights reserved.
For permissions, please e-mail: [email protected] S87
cite as: J Gerontol A Biol Sci Med Sci,2016, Vol. 71, No. S1, S87–S99
doi:10.1093/gerona/glv099
Special Article
Correlates of Successful Aging in Racial and Ethnic
Minority Women Age 80 Years and Older: Findings from
the Women’s Health Initiative
Crystal W. Cené,
1Peggye Dilworth-Anderson,
2Iris Leng,
3Lorena Garcia,
4Viola Benavente,
5Milagros Rosal,
6Leslie Vaughan,
7Laura H. Coker,
7Giselle
Corbie-Smith,
8Mimi Kim,
9Christina L. Bell,
10Jennifer G. Robinson,
11JoAnn E. Manson,
12and
Barbara Cochrane
131UNC School of Medicine, Department of Medicine 2Gillings School of Global Public Health at UNC, Department of Health Policy and
Management 3Wake Forest School of Medicine, Department of Biostatistics 4UC Davis School of Medicine, Department of Public Health
Sciences 5Boston College William F. Connell School of Nursing 6University of Massachusetts Medical School, Department of Medicine 7Wake Forest School of Medicine, Department of Social Sciences & Health Policy 8UNC School of Medicine, Departments of Social
Medicine and Medicine 9UNC Chapel Hill School of Medicine, NC Translational and Clinical Sciences Institute 10University of Hawaii John
A. Burns School of Medicine, Department of Geriatric Medicine 11University of Iowa, Departments of Epidemiology & Medicine 12Brigham
and Women’s Hospital, Harvard Medical School 13University of Washington School of Medicine
Address correspondence to Crystal W. Cené, MD, MPH, UNC School of Medicine, Department of Medicine. Email: [email protected]
Received July 21, 2014; Accepted June 5, 2015
Decision Editor: Sally A. Shumaker, PhD
Abstract
Background. Most research has focused on definitions and predictors of successful aging. However, racial/ethnic minorities are often under represented in this research. Given that the U.S. population is aging and becoming more racially diverse, we examined correlates of “successful aging,” as defined by physical functioning and overall quality of life (QOL), among racial/ethnic minority women aged 80 years and older in the Women’s Health Initiative.
Methods. Participants included 1,924 racial/ethnic minority women (African Americans, Asian/Pacific Islanders, Hispanic/Latinos, and American Indian/Alaskan Natives) 80 years of age and older who are enrolled in the Women’s Health Initiative and have physical functioning data after turning 80 years of age. Analysis of covariance was used to examine between and within group differences in physical functioning and selfrated overall QOL for African Americans, Asian/Pacific Islanders, and Hispanic/Latinos.
Results. We found no significant differences in physical functioning between racial/ethnic minority groups in adjusted analyses. However, overall QOL was significantly different between racial/ethnic minority groups. Age, recreational physical activity, and overall selfrated health were independent correlates of physical functioning across racial/ethnic minority groups, whereas overall selfrated health was the only consistent correlate of overall QOL across the minority groups for the within minority group comparisons.
Conclusions. Between racial/ethnic minority group differences in physical functioning are largely explained by demographic, psychosocial, behavioral, and health-related variables. We found statistically significant differences in selfrated overall QOL between racial/ethnic minority groups.
Key Words: Minority aging—Successful aging—Physical function
Research on “successful aging” is not new to the field of social gerontology (1). Many manuscripts have been published since
1987 when John Rowe and Robert Kahn published their semi-nal article. Interestingly, there is no agreed upon definition of the
construct. A previous review of quantitative studies by Depp and Jeste identified 29 definitions in the 28 studies examined, with most including a measure of disability or physical function (2). Physical functioning is one aspect of health-related quality of life (QOL) (2) and is often considered a component of successful aging. Prior work has demonstrated associations between successful aging and the following sociodemographic and behavioral factors: higher income and education, white race, absence of comorbid illnesses, not smoking, physical activity, and moderate alcohol consumption (3–8). In addition, psychosocial variables such as social support, optimism, subjective well-being/happiness, and depression have been shown to be significant predictors of successful aging in prior studies (9,10).
In the face of changing demographics in the United States (ie, the “browning” of society and the impending “silver tsunami”), the intersection of race/ethnicity and older age are important areas for research on successful aging (1,11). The prevalence of successful aging, including indicators of physical functioning, differs by race/ ethnicity (12–14) and racial/ethnic minorities are less likely to be categorized as successful. However, most studies on correlates of successful aging either do not report the racial or ethnic profile of the sample (15) or have under-represented racial/ethnic minorities in their samples (16,17). Scholars and older racial/ethnic minorities themselves question whether the use of objective indicators such as physical health/functioning to define successful aging captures the full essence of the construct or the lived experiences of diverse groups of older adults (2,12,17–20). Older adults indicate that they value more subjective criteria such as QOL as much if not more than longevity (2). Therefore, scholars need to consider both global (eg overall QOL) and domain specific indicators of successful aging. Additionally, they should examine a broad array of sociodemo-graphic, psychosocial, behavioral, and health-related factors which may influence aging.
Drawing upon the well-characterized and racial/ethnic diver-sity of the Women’s Health Initiative (WHI) study, one of the larg-est cohort studies of older women in the United States, the goals of this study are to: (a) characterize the racial/ethnic minority women (African American, Asian or Pacific Islander, Hispanic/Latino, and American Indian or Alaskan native) who are 80 years of age and older along a broad range of demographic, psychosocial, behavioral, and health-related variables and (b) examine independent correlates of self-reported physical functioning and overall QOL between and within racial/ethnic minority groups.
Methods
Design
This is a secondary analysis of WHI data. Details of the WHI study design, recruitment strategies, data collection methods and baseline data have been previously described (21–24). The WHI enrolled 161,809 postmenopausal women aged 50–79 years from 1993 to 1998 at 40 clinical centers across the United States into either one or more randomized clinical trials, including the hormone therapy trials (with four arms: conjugated equine estrogens-alone interven-tion, conjugated equine estrogens-alone control, conjugated equine estrogens+medroxyprogesterone acetate intervention and conju-gated equine estrogens+medroxyprogesterone acetate control) (24), the dietary modification trial and the Calcium and Vitamin D trial, or in an observational study. This resulted in a diverse population of postmenopausal women with 18% from underrepresented racial and ethnic groups. Participants were followed at least annually for
vital status and WHI medical outcomes through study closeout (October 2004–March 2005). After closeout, all participants were invited to enroll in an extension study; those who consented were followed annually.
Sample
To be included in this analytic sample, women must have been enrolled in one of the randomized clinical trials or in the observa-tional study cohort; consented and participated in the second WHI Extension study (2010–2015) (25); selfidentified as racial/ethnic minorities (African American, Asian/Pacific Islander, Hispanic/ Latino, or Native American/Alaskan Native); and had physical func-tioning data collected after turning 80 years of age (cutoff date was September 17, 2012). Of the 2,684 racial/ethnic minority women with eligible physical functioning data, only 1,924 were included in this analysis due to missing covariates.
Measures
Independent Variables
Demographic, psychosocial, behavioral, and health-related variables (described below) were collected using established and validated measures. WHI study arm, race/ethnicity, educational level, and optimism were all measured at enrollment; all other covariates were measured at the most recent assessment before or at turning 80+ years.
Race/ethnicity
Was based on selfreport.
Outcome Measures
We examined two indicators of successful aging from participants’ most recent assessment after turning 80: physical functioning and selfrated overall QOL. These variables were measured 15.1 (range: 7.8–18.5) years after enrollment in the WHI study.
Physical Functioning
The physical functioning subscale of the Rand 36-item health survey (26) was our main outcome measure. This subscale asks respond-ents to rate their degree of limitation in doing the following activi-ties: (a) vigorous activities such as running, lifting heavy objects, or participating in strenuous sports; (b) moderate activities such as moving a table, pushing a vacuum cleaner, bowling, or playing golf; (c) lifting or carrying groceries; (d) climbing several flights of stairs; (e) climbing one flight of stairs; (f) bending, kneeling, or stooping; (g) walking more than a mile; (h) walking several blocks; (i) walk-ing one block; and (j) bathwalk-ing or dresswalk-ing yourself. Values on this subscale range from 0 to 100; the subscale score is standardized to a mean of 50 and a standard deviation of 10; higher scores indicate better functioning.
Selfrated Overall QOL
Participants’ rated this using a single item question with responses ranging from worst (0) to best (10). Such single item measures have demonstrated reliability and validity and have been shown to be predictive of clinically important outcomes, such as survival (27– 29). Data from >9,200 individuals from 36 clinical trials and six observational studies with various populations showed the average overall QOL score was 7.39 (SD = 2.11) on a 1–10 scale, with a score of 5 or below indicating a clinically significant deficit in over-all QOL (28).
Demographic Variables
we assessed current age at visit with physical functioning data (cal-culated using date of birth); educational level (dichotomized as at least high school vs not); annual household income (less than or greater than or equal to $35K); and living arrangement (currently living alone vs not).
Psychosocial Variables
Perceived social support: was measured using 9 items from four
subscales of the Medical Outcomes Study Social Support Measure (30): emotional/informational support (4 items), affection (1 item), tangible support (2 items), and positive social interaction (2 items). The nine questions ask respondents to indicate how often each kind of support listed is available to them. Responses are scored on a 5-point scale ranging from “none of the time” to “all of the time.” Overall scores range from 9 to 45; higher scores indicate more sup-port. We created quartiles of perceived social support using scores derived from this sample. Lower quartiles represent lower values.
Optimism: represents a cluster of constructs (perceived control, posi-tive expectations, empowerment, fighting spirit, lack of helplessness; measured using six items from the life orientation test-revised (31), with scores ranging from 6 to 30; higher scores represent greater optimism. We also created quartiles of optimism using scores derived from this sample. Subjective well-being: was assessed using a single item from the emotional well-being subscale of the RAND-36 ask-ing women “how much of the time durask-ing the past 4 weeks have you been happy.” Response options range from 0 (all of the time) to 6 (none of the time). We categorized this variable as all/most of the time versus a good bit/some versus a little bit/none.
Depressive Symptoms
was measured by the 8-item Burnham short version of the CESD-D (21). Responses for each item were weighted according to the Burnham algorithm with a final range from 0 to 1; higher scores indicate greater likelihood of depression. Scores >0.06 are indicative of significant depressive symptoms and scores ≤0.06 are indicative of no/minimal depressive symptoms.
Behavioral Variables
Smoking: was selfreported and categorized as never, past, or current smoker; Alcohol use: was selfreported based on number of drinks per day and categorized as 0, <1, 1–2, and ≥3. Recreational physi-cal activity: was based on selfreported total number of minutes per week and categorized according to quartiles; higher quartiles indi-cate more weekly recreational physical activity
Health-Related Variables
Overall selfrated health: measured using a single-item question from the Rand SF-36, rated using a 5-point scale (excellent to poor); Comorbidities: included self-reported (yes vs no) data on the following eight comorbidities: history of hypertension requir-ing pills, history of treated diabetes mellitus, history of hip fracture ≥55 years, history of arthritis, history of stroke, history of coronary heart disease, history of congestive heart failure, history of chronic obstructive pulmonary disease. For the analyses, we included five categories based on the number of comorbidities; Body mass index
(BMI; weight in kg/divided by height in m2): categorized as ≤ 24.9,
25.0–29.9, and ≥30. Functional independence: assessed with four items about: ability to eat, dress, get in and out of bed, and shower; rated on a scale from 1 (no need for help) to 3 (inability to care for oneself). We summed the items, resulting in scores ranging from
4–12; higher scores indicate greater limitations. Finally, we included Hormone Therapy Trial arm as a covariate.
Statistical Analysis
Women in the 80+ minority cohort were categorized with respect to race/ethnicity. We describe participants’ characteristics as means (standard deviations) for continuous variables or count (percent-ages) for categorical variables. First, we performed comparisons of different race/ethnicity groups using analysis of variance for contin-uous variables or chi-square tests for categorical variables (Table 1). Then, analysis of covariance was used to examine race/ethnicity differences in physical function and selfrated overall QOL, with and without adjustment for current age, education, income, living alone, social support score, optimism score, subjective well-being/ happiness, depressive symptoms, smoking status, alcohol intake, recreational physical activity, BMI, number of comorbidities, selfre-ported health, and hormone therapy trial arm (Table 2). Then, a similar analysis was performed within each race/ethnicity group to explore possible independent predictors for physical functioning and selfrated overall QOL (Tables 3 and 4, and Figures 1 and 2, respectively). Least square means and the corresponding standard errors were reported in all the models. Due to the relatively large percentage of missing data on covariates, we also examined base-line characteristics of those with and without missing covariates, as well as their physical functioning and QOL scores after turning 80 in sensitivity analyses. Multiple imputations were used to impute the missing categorical covariates using baseline characteristics. Then, sensitivity analyses were performed based on the imputed datasets to determine if there were differences. These imputed data are included as Supplementary Appendix. All tests were two-sided and set at a significance level of 0.05. All analyses were performed using SAS 9.3 (Cary, NC). Given the small sample size of the Native American/Alaskan Indian group which made the estimates unstable, we excluded this group from the multivariable analysis. We pro-vide descriptive statistics only for Native American/Alaskan Indians (Table 1).
Results
Sample Characteristics
Out of a total of 26,005 racial/ethnic minority women at baseline in WHI, N = 2,684 (5.8% of the total cohort) survived and made it into the 80+ cohort. There was a significant “survival dispar-ity” by group, with 12.5% African American, 7.8% Asian/Pacific Islander, 7.1% Hispanic/Latino women, and 14.7% of American Indian/Alaskan Natives not entering the 80+ cohort due to death (p < 0.0001). Of these 2,684 racial/ethnic minority women, 1,924 were included in the analytic sample, due to 760 women with miss-ing values on covariates. Comparmiss-ing women with and without missing covariates at baseline, we found significant differences by race/ethnicity (p < 0.0001), mean age (p = 0.05), income <$35,000 (p < 0.01), arthritis (p < 0.01), stroke (p = 0.02), congestive heart fail-ure (p < 0.01), BMI (p = 0.03), physical functioning score (p < 0.01), and selfrated overall QOL (p = 0.03). There were significant dif-ferences in physical functioning, but not QOL, at the most recent visit after turning 80 years, based on missing covariate data. Women with missing covariates had a mean (SD) physical functioning score of 56.0 (28.7), whereas women without missing covariate data had a mean (SD) physical functioning score of 58.9 (27.6) (p = 0.01). Women with missing covariates had a mean (SD) QOL score of 7.3 (1.8) while women without missing covariates had a mean (SD) QOL score of 7.4 (1.7) (p = 0.07).
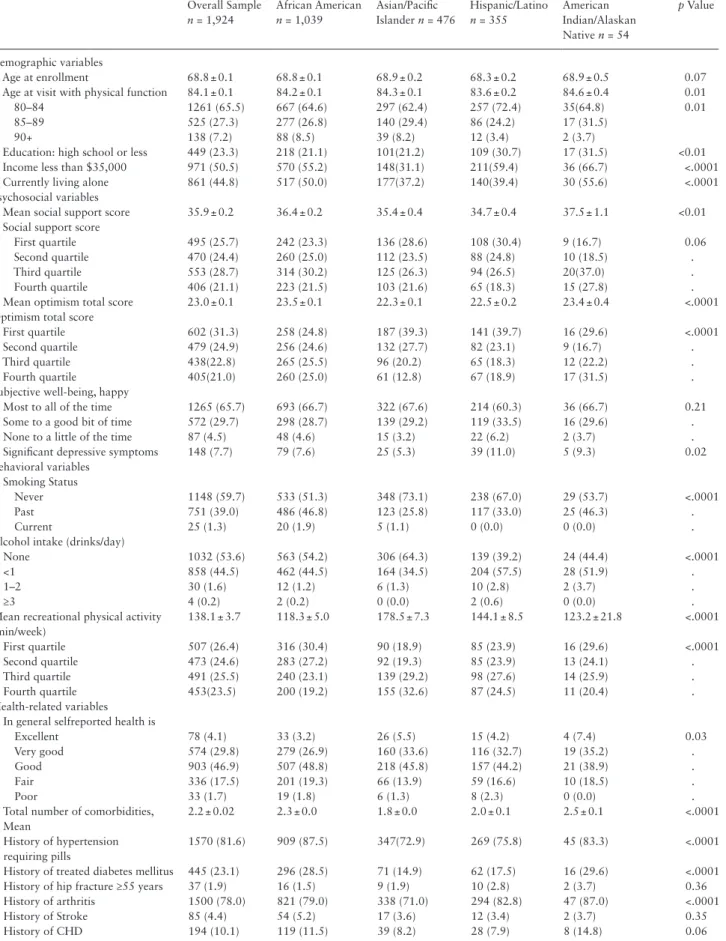
Table 1. Characteristics at 80+ Racial/Ethnic Minority Women at Baseline
Overall Sample
n = 1,924
African American
n = 1,039
Asian/Pacific Islander n = 476
Hispanic/Latino
n = 355
American Indian/Alaskan Native n = 54
p Value
Demographic variables
Age at enrollment 68.8 ± 0.1 68.8 ± 0.1 68.9 ± 0.2 68.3 ± 0.2 68.9 ± 0.5 0.07
Age at visit with physical function 84.1 ± 0.1 84.2 ± 0.1 84.3 ± 0.1 83.6 ± 0.2 84.6 ± 0.4 0.01
80–84 1261 (65.5) 667 (64.6) 297 (62.4) 257 (72.4) 35(64.8) 0.01
85–89 525 (27.3) 277 (26.8) 140 (29.4) 86 (24.2) 17 (31.5)
90+ 138 (7.2) 88 (8.5) 39 (8.2) 12 (3.4) 2 (3.7)
Education: high school or less 449 (23.3) 218 (21.1) 101(21.2) 109 (30.7) 17 (31.5) <0.01
Income less than $35,000 971 (50.5) 570 (55.2) 148(31.1) 211(59.4) 36 (66.7) <.0001
Currently living alone 861 (44.8) 517 (50.0) 177(37.2) 140(39.4) 30 (55.6) <.0001
Psychosocial variables
Mean social support score 35.9 ± 0.2 36.4 ± 0.2 35.4 ± 0.4 34.7 ± 0.4 37.5 ± 1.1 <0.01
Social support score
First quartile 495 (25.7) 242 (23.3) 136 (28.6) 108 (30.4) 9 (16.7) 0.06
Second quartile 470 (24.4) 260 (25.0) 112 (23.5) 88 (24.8) 10 (18.5) .
Third quartile 553 (28.7) 314 (30.2) 125 (26.3) 94 (26.5) 20(37.0) .
Fourth quartile 406 (21.1) 223 (21.5) 103 (21.6) 65 (18.3) 15 (27.8) .
Mean optimism total score 23.0 ± 0.1 23.5 ± 0.1 22.3 ± 0.1 22.5 ± 0.2 23.4 ± 0.4 <.0001
Optimism total score
First quartile 602 (31.3) 258 (24.8) 187 (39.3) 141 (39.7) 16 (29.6) <.0001
Second quartile 479 (24.9) 256 (24.6) 132 (27.7) 82 (23.1) 9 (16.7) .
Third quartile 438(22.8) 265 (25.5) 96 (20.2) 65 (18.3) 12 (22.2) .
Fourth quartile 405(21.0) 260 (25.0) 61 (12.8) 67 (18.9) 17 (31.5) .
Subjective well-being, happy
Most to all of the time 1265 (65.7) 693 (66.7) 322 (67.6) 214 (60.3) 36 (66.7) 0.21
Some to a good bit of time 572 (29.7) 298 (28.7) 139 (29.2) 119 (33.5) 16 (29.6) .
None to a little of the time 87 (4.5) 48 (4.6) 15 (3.2) 22 (6.2) 2 (3.7) .
Significant depressive symptoms 148 (7.7) 79 (7.6) 25 (5.3) 39 (11.0) 5 (9.3) 0.02
Behavioral variables Smoking Status
Never 1148 (59.7) 533 (51.3) 348 (73.1) 238 (67.0) 29 (53.7) <.0001
Past 751 (39.0) 486 (46.8) 123 (25.8) 117 (33.0) 25 (46.3) .
Current 25 (1.3) 20 (1.9) 5 (1.1) 0 (0.0) 0 (0.0) .
Alcohol intake (drinks/day)
None 1032 (53.6) 563 (54.2) 306 (64.3) 139 (39.2) 24 (44.4) <.0001
<1 858 (44.5) 462 (44.5) 164 (34.5) 204 (57.5) 28 (51.9) .
1–2 30 (1.6) 12 (1.2) 6 (1.3) 10 (2.8) 2 (3.7) .
≥3 4 (0.2) 2 (0.2) 0 (0.0) 2 (0.6) 0 (0.0) .
Mean recreational physical activity (min/week)
138.1 ± 3.7 118.3 ± 5.0 178.5 ± 7.3 144.1 ± 8.5 123.2 ± 21.8 <.0001
First quartile 507 (26.4) 316 (30.4) 90 (18.9) 85 (23.9) 16 (29.6) <.0001
Second quartile 473 (24.6) 283 (27.2) 92 (19.3) 85 (23.9) 13 (24.1) .
Third quartile 491 (25.5) 240 (23.1) 139 (29.2) 98 (27.6) 14 (25.9) .
Fourth quartile 453(23.5) 200 (19.2) 155 (32.6) 87 (24.5) 11 (20.4) .
Health-related variables In general selfreported health is
Excellent 78 (4.1) 33 (3.2) 26 (5.5) 15 (4.2) 4 (7.4) 0.03
Very good 574 (29.8) 279 (26.9) 160 (33.6) 116 (32.7) 19 (35.2) .
Good 903 (46.9) 507 (48.8) 218 (45.8) 157 (44.2) 21 (38.9) .
Fair 336 (17.5) 201 (19.3) 66 (13.9) 59 (16.6) 10 (18.5) .
Poor 33 (1.7) 19 (1.8) 6 (1.3) 8 (2.3) 0 (0.0) .
Total number of comorbidities, Mean
2.2 ± 0.02 2.3 ± 0.0 1.8 ± 0.0 2.0 ± 0.1 2.5 ± 0.1 <.0001
History of hypertension requiring pills
1570 (81.6) 909 (87.5) 347(72.9) 269 (75.8) 45 (83.3) <.0001
History of treated diabetes mellitus 445 (23.1) 296 (28.5) 71 (14.9) 62 (17.5) 16 (29.6) <.0001
History of hip fracture ≥55 years 37 (1.9) 16 (1.5) 9 (1.9) 10 (2.8) 2 (3.7) 0.36
History of arthritis 1500 (78.0) 821 (79.0) 338 (71.0) 294 (82.8) 47 (87.0) <.0001
History of Stroke 85 (4.4) 54 (5.2) 17 (3.6) 12 (3.4) 2 (3.7) 0.35
History of CHD 194 (10.1) 119 (11.5) 39 (8.2) 28 (7.9) 8 (14.8) 0.06
Table 1 presents sample characteristics overall and by racial/ ethnic group. Demographic characteristics: overall, 66% of the women are 80–84 years and 7% are 90 years or older; 51% reported an annual household income of <$35K; 23% reported having a high school or less education; 45% reported living alone.
Psychological characteristics: mean social support score was 35.9, with Asian/Pacific Islander women having a higher mean perceived social support score than the other groups; overall mean optimism score was 23.0 and there were significant differences between groups; 66% of women reported feeling subjectively happy “most to all of the time,” without significant differences between groups; 8% of the overall sample had significant depressive symptoms and the percentage was significantly higher among Hispanic/Latino women. Health behaviors: 60% of the women were never smok-ers; selfreported alcohol consumption was low, with 60% of the women overall reporting no alcohol consumption and 45% report-ing <1 drink daily; average amount of recreational physical activ-ity minutes per week was 138.1 overall. Asian/Pacific Islanders had the best behavioral profile among the groups as reflected by greater percentages of never smokers, women with no daily alco-hol intake, and the highest percentage of selfreported recreational
physical activity per week. Health-related variables: overall self-rated health was “good” in about half (47%) of the sample, with another 30% reporting “very good” overall health; mean number of comorbidities (of the 8 examined) was 2.2 overall, with hyper-tension and arthritis being most commonly reported; few women reported functional limitations in activities of daily livings (mean score was 4.1); mean BMI overall was 27.6, with 29% of the sam-ple having a BMI ≥30.
Overall, the mean physical functioning score was 58.9 and mean selfrated overall QOL score was 7.4.
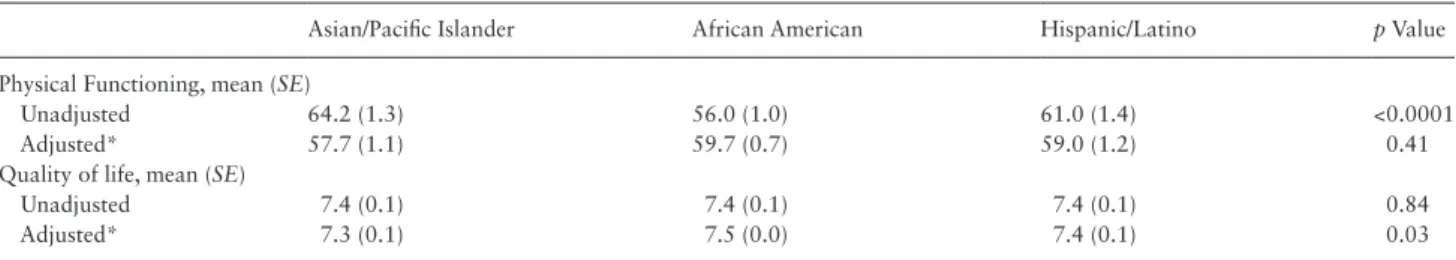
Between Group Differences in Physical Functioning and Selfrated Overall QOL
We did not find significant between racial/ethnic minority group dif-ferences in physical functioning between groups after adjusting for demographic, psychosocial, behavioral, and health-related variables (Table 2). We did not find any differences in overall QOL among the racial/ethnic groups in unadjusted analyses; however, in adjusted analyses, racial/ethnic differences in overall QOL became statisti-cally significant, suggesting residual confounding.
Overall Sample
n = 1,924
African American
n = 1,039
Asian/Pacific Islander n = 476
Hispanic/Latino
n = 355
American Indian/Alaskan Native n = 54
p Value
History of CHF 42 (2.2) 28 (2.7) 2 (0.4) 9 (2.5) 3(5.6) 0.01
History of COPD 141 (7.3) 92 (8.9) 23 (4.8) 19 (5.4) 7(13.0) 0.001
Number of comorbidities
0 80 (4.2) 36 (3.5) 32 (6.7) 10 (2.8) 2(3.5) <0.0001
1 408 (21.2) 169 (16.3) 141 (29.6) 92 (25.9) 6(10.5) .
2 836 (43.5) 444 (42.7) 200 (42.2) 169 (47.6) 23(40.4) .
3 392 (20.4) 243 (23.4) 83 (17.4) 52 (14.6) 14(24.6) .
≥4 208 (10.8) 147 (14.1) 19 (4.0) 32 (9.0) 12(21.1) .
Mean ADL score 4.12 ± 0.02 4.16 ± 0.02 4.05 ± 0.03 4.10 ± 0.04 4.13 ± 0.13 0.03
Mean BMI (kg/m2) 27.6 ± 0.1) 29.4 ± 0.2 24.0 ± 0.2 27.2 ± 0.3 28.5 ± 0.7 <0.0001
BMI category < 25 657 (34.1) 212(20.4) 309 (64.9) 122 (34.4) 14 (25.9) <0.0001
25 –29.9 705 (36.5) 402 (38.7) 134 (28.2) 146 (41.1) 20 (37.0) .
≥ 30 565 (29.4) 425(40.9) 33 (6.9) 87 (24.5) 20 (37.0) .
Hormone replacement therapy (HRT) study arm
Not in HRT 1555(80.8) 826(79.5) 408(85.7) 277(78.0) 44(81.5) <0.0001
CEE-Alone Intervention
94(4.9) 67(6.4) 8(1.7) 15(4.2) 4(7.4)
CEE-Alone Control
95(4.9) 63(6.1) 9(1.9) 19(5.4) 4(7.4)
CEE+MPA Intervention
96(5.0) 46(4.4) 21(4.4) 27(7.6) 2(3.7)
CEE+MPA Control
84(4.4) 37(3.6) 30(6.3) 17(4.8) 0(0.0)
SF-36 physical functioning 58.9 (0.6) 56.0 (0.8) 64.2 (1.3) 61.0 (1.5) 54.9 (3.7) <0.0001
Selfrated quality of life 7.4 (0.04) 7.4 (0.1) 7.4 (0.1) 7.4 (0.1) 7.6 (0.2) 0.76
Note: p Values indicates the overall difference among ethnic groups, mean ± SE or count (%).
Table 2. Unadjusted and Adjusted Between Racial/Ethnic Group Comparisons in Physical Functioning and Overall Selfrated QOL
Asian/Pacific Islander African American Hispanic/Latino p Value
Physical Functioning, mean (SE)
Unadjusted 64.2 (1.3) 56.0 (1.0) 61.0 (1.4) <0.0001
Adjusted* 57.7 (1.1) 59.7 (0.7) 59.0 (1.2) 0.41
Quality of life, mean (SE)
Unadjusted 7.4 (0.1) 7.4 (0.1) 7.4 (0.1) 0.84
Adjusted* 7.3 (0.1) 7.5 (0.0) 7.4 (0.1) 0.03
*Overall R2 for physical functioning is 0.38; overall R2 for overall selfrated QOL is 0.45
Table 1. Continued
Table 3. Unadjusted and Adjusted Average SF-36 Physical Functioning Score (Mean [SE]) of Each Predictor Within Each Race/Ethnicity (Stratified Analyses)
African American Asian/Pacific Islander Hispanic/Latino
Unadjusted Adjusted§ Unadjusted Adjusted|| Unadjusted Adjusted¶
Demographic variables Age at visit with physical
function
80–84 57.8 (1.1)† 57.9 (0.9)* 67.9(1.5)† 66.7(1.2)† 64.5 (1.6)† 64.1 (1.4)†
85–89 54.9 (1.7) 54.7 (1.3) 59.6 (2.2) 60.2 (1.8) 52.1 (2.8) 53.5 (2.5)
90+ 44.9 (3.0) 44.9 (2.5) 52.7 (4.1) 59.7 (3.6) 50.4 (7.5) 47.5 (6.7)
Education: at least high school
No 51.7(1.9)‡ 56.0 (1.5) 63.6 (2.6) 67.2 (2.3) 57.7(2.5) 60.6 (2.3)
Yes 57.1(1.0) 56.0 (0.8) 64.4 (1.4) 63.4 (1.1) 62.5 (1.7) 61.2(1.5)
Income less than $35,000 Yes 53.1 (1.2)† 55.2 (1.0) 58.9 (2.1)† 63.5 (1.9) 58.4 (1.8)‡ 60.4 (1.6)
No 59.5 (1.3) 56.9 (1.1) 66.7 (1.4) 64.6 (1.2) 64.8 (2.2) 61.9 (2.0)
Currently living alone No 54.2 (1.2)‡ 54.0 (1.0)† 65.2 (1.5) 63.2 (1.2) 60.8 (1.8) 60.9 (1.6)
Yes 57.8 (1.2) 58.0 (1.0) 62.6 (2.0) 66.1 (1.7) 61.3 (2.2) 61.1 (2.0)
Psychosocial variables
Social support score First quartile 53.6 (1.8)† 55.7 (1.5) 58.9(2.2)‡ 61.7 (2.0) 59.5 (2.6) 61.6 (2.4)
Second quartile 52.3 (1.7) 54.1 (1.4) 63.8 (2.5) 65.2 (2.0) 61.8 (2.8) 63.0 (2.4) Third quartile 57.1 (1.6) 57.3 (1.3) 67.2 (2.3) 65.9 (1.9) 63.9 (2.7) 61.4 (2.4) Fourth quartile 61.3 (1.9) 56.7 (1.5) 68.1 (2.6) 64.6 (2.2) 58.4 (3.3) 56.6 (3.0) Optimism total score First quartile 52.6 (1.7)* 56.5 (1.4) 61.9 (1.9) 65.7 (1.6) 55.2 (2.2)† 58.4 (2.0)
Second quartile 54.8 (1.7) 56.5 (1.4) 64.7 (2.3) 63.5 (1.9) 61.4 (2.9) 62.2 (2.6) Third quartile 53.8 (1.7) 53.8 (1.4) 65.3 (2.7) 62.7 (2.2) 63.0 (3.2) 61.7 (2.9) Fourth quartile 62.7 (1.7) 57.2 (1.4) 68.6 (3.4) 63.8 (2.8) 70.7 (3.2) 64.5 (3.0) Subjective well-being,
happy
Most to all of the time 58.5 (1.1)* 56.2 (0.9) 70.2 (1.4)* 67.5 (1.2)* 63.0 (1.8) 60.9 (1.7) Some to a good bit of time 51.9 (1.6) 55.6 (1.4) 53.6 (2.1) 59.2 (1.9) 57.9 (2.4) 60.3 (2.2) None to a little of the time 45.3 (4.0) 54.8 (3.4) 34.0 (6.3) 42.2 (5.9) 58.6 (5.7) 65.8 (5.5)
Depressive symptoms No 56.5 (0.9)‡ 55.9 (0.7) 64.8 (1.2)‡ 64.2 (1.0) 61.7 (1.5) 61.2 (1.3)
Yes 50.0 (3.1) 56.7 (2.7) 53.4 (5.2) 65.7 (4.6) 55.7 (4.3) 59.8 (4.1)
Behavioral variables
Smoking status Never 56.5 (1.2) 56.4 (1.0) 64.9 (1.4) 64.5 (1.1) 62.9 (1.7) 63.0(1.5)‡
Past 55.0 (1.3) 55.3 (1.0) 62.0 (2.4) 63.4 (2.0) 57.1 (2.4) 56.8 (2.2)
Current 67.0 (6.2) 61.5 (5.0) 74.0 (11.7) 70.1 (9.8)
Alcohol intake (drinks/ day)
0 53.4 (1.2)† 54.9 (1.0) 64.0 (1.5) 64.8 (1.2) 59.1 (2.3) 61.6 (2.0)
<1 59.1 (1.3) 57.2 (1.1) 65.0 (2.0) 63.9(1.7) 62.2 (1.9) 60.4 (1.6)
1–2 60.8 (8.0) 60.9 (6.5) 53.3 (10.7) 46.4(9.0) 61.5 (8.4) 62.0 (7.8)
≥ 3 30.0 (19.7) 38.8 (16) 70.0 (18.8) 77.3 (16)
Recreational physical activity (min/week)
First quartile 44.0 (1.5)* 47.7 (1.3)* 47.9 (2.6)* 53.9 (2.4)* 44.2 (2.7)* 49.5(2.6)* Second quartile 53.7 (1.6) 54.2 (1.3) 62.8 (2.6) 62.9 (2.3) 63.1 (2.7) 65.3 (2.5) Third quartile 60.7 (1.7) 59.3 (1.4) 66.7 (2.1) 66.0 (1.8) 64.9 (2.5) 63.5 (2.3) Fourth quartile 72.4 (1.8) 67.6 (1.6) 72.4 (2.0) 69.5 (1.7) 71.0 2.7) 65.1 (2.6) Health-related variables
In general, self-rated health
Excellent 87.8 (4.3)* 75.5 (4.0)* 84.8 (4.4)* 78.6 (4.3)* 79.3 (6.2)* 72.4 (6.2)*
Very Good 69.2 (1.5) 66.2 (1.4) 75.8 (1.8) 73.3 (1.8) 71.7 (2.2) 68.4 (2.3)
Good 55.7 (1.1) 56.1 (1.0) 61.8 (1.5) 62.0 (1.5) 59.4 (1.9) 60.5 (1.8)
Fair 37.4 (1.7) 42.0 (1.6) 40.6 (2.8) 48.1 (2.8) 44.5 (3.2) 47.9 (3.2)
Poor 10.6 (5.6) 17.0 (5.2) 15.8 (9.2) 21.8 (9.4) 25.0 (8.6) 38.9 (8.6)
Number of comorbidities 0 74.2 (4.5)* 64.0 (3.8)* 75.3(4.5)* 70.4 (3.8)‡ 73.5 (8.1)* 61.6 (7.5)
1 69.6 (2.1) 63.3 (1.8) 68.8 (2.2) 66.2 (1.8) 69.5 (2.7) 66.5 (2.4)
2 56.2 (1.3) 54.8 (1.1) 63.4 (1.8) 64.1 (1.5) 61.1 (2.0) 60.4 (1.8)
3 50.8 (1.7) 54.1 (1.4) 58.7 (2.8) 61.4 (2.4) 54.3 (3.5) 57.6 (3.3)
≥ 4 43.8 (2.2) 52.3 (1.9) 45.0 (5.9) 53.1 (5.0) 42.8 (4.5) 53.6 (4.2)
BMI (kg/m2) Less than 25 67.1 (1.8)* 61.7 (1.6)* 66.3 (1.5)‡ 65.6 (1.2) 67.4 (2.3)* 63.9 (2.1)
25–29 59.4 (1.3) 59.8 (1.1) 62.0 (2.2) 63.1 (1.9) 61.7 (2.1) 61.7 (1.9)
At least 30 47.2 (1.3) 49.5 (1.1) 53.6 (4.5) 56.4 (3.8) 50.9 (2.8) 55.7 (2.6)
HRT ARM Not in HRT 55.7 (1.0) 55.0 (0.8) 64.1 (1.3) 63.9 (1.0) 61.6 (1.6) 61.3 (1.4)
CEE-alone intervention 53.4 (3.4) 58.9 (2.8) 56.4 (9.3) 52.8 (7.6) 49.7 (6.8) 55.9 (6.1) CEE-alone control 53.7(3.5) 57.9(2.8) 59.4(8.8) 70.7 (7.4) 54.7 (6.1) 58.1 (5.4) CEE+MPA intervention 66.0 (4.1) 63.2 (3.3) 69.5 (5.7) 70.3 (4.7) 67.7 (5.1) 64.8 (4.6) CEE+MPA control 57.4 (4.6) 59.7 (3.7) 65.6 (4.8) 65.3 (4.0) 57.9 (6.4) 58.5 (5.9)
Analyses were done within each race/ethnicity. Statistical significance was indicated by three symbols: *p < 0.0001; †p < 0.01; ‡p < 0.05. §R2 for African Americans 0.40; ||R2 for Asian/Pacific Islanders 0.41; ¶ for Hispanic/Latinos 0.38.
Table 4. Unadjusted and Adjusted Average Selfreported Quality of Life (Mean [SE]) of Each Predictor Within Each Race/Ethnicity (Stratified Analyses)
African American Asian/Pacific Islander Hispanic/Latino
Unadjusted Adjusted§ Unadjusted Adjusted|| Unadjusted Adjusted¶
Demographic variables
Age at visit with physical function 80–84 7.5 (0.1) 7.5 (0.0)‡ 7.6 (0.1)* 7.5 (0.1)‡ 7.4 (0.10 7.5 (0.1)
85–89 7.4 (0.1) 7.5 (0.1) 7.2 (0.1) 7.3 (0.1) 7.5 (0.2) 7.5 (0.2)
90+ 7.1 (0.2) 7.0 (0.1) 6.3 (0.3) 7.0 (0.2) 6.8 (0.5) 6.5 (0.4)
Education: high school or less Yes 7.3 (0.1) 7.5 (0.1) 7.0 (0.2)‡ 7.3 (0.1) 7.4 (0.2) 7.6 (0.1)
No 7.5 (0.1) 7.4 (0.0) 7.5 (0.1) 7.4 (0.1) 7.4 (0.1) 7.4 (0.1)
Income less than $35,000 Yes 7.3 (0.1)‡ 7.5 (0.1) 6.9 (0.1)* 7.3 (0.1) 7.4 (0.1) 7.5 (0.1)
No 7.6 (0.1) 7.4 (0.1) 7.6 (0.1) 7.4 (0.1) 7.5 (0.2) 7.3 (0.1)
Currently living alone No 7.5 (0.1) 7.4 (0.1) 7.5 (0.1)‡ 7.4 (0.1) 7.5 (0.1) 7.4 (0.1)
Yes 7.4 (0.1) 7.5 (0.1) 7.1 (0.1) 7.4 (0.1) 7.4 (0.2) 7.4 (0.1)
Psychosocial variables
Social support score First quartile 6.9 (0.1)* 7.2 (0.1)‡ 6.7(0.1)* 6.9(0.1)† 6.8 (0.2)* 7.2 (0.1)
Second quartile 7.3 (0.1) 7.4 (0.1) 7.3(0.2) 7.5(0.1) 7.5 (0.2) 7.6 (0.2)
Third quartile 7.6 (0.1) 7.5 (0.1) 7.7(0.2) 7.5(0.1) 7.8 (0.2) 7.5 (0.2)
Fourth quartile 8.0 (0.1) 7.6 (0.1) 8.1(0.2) 7.7(0.1) 8.0 (0.2) 7.5 (0.2) Optimism total score First quartile 7.0 (0.1)* 7.3 (0.1)† 6.8(0.1)* 7.2(0.1) 6.9 (0.1)* 7.2 (0.1)†
Second quartile 7.2 (0.1) 7.3 (0.1) 7.6(0.1) 7.4(0.1) 7.4 (0.2) 7.5 (0.2)
Third quartile 7.5 (0.1) 7.5 (0.1) 7.7(0.2) 7.5(0.1) 7.4 (0.2) 7.3 (0.2)
Fourth quartile 8.1 (0.1) 7.7 (0.1) 8.2(0.2) 7.7(0.2) 8.5 (0.2) 8.0 (0.2) Subjective well-being, happy Most to all of the time 7.7 (0.1)* 7.5 (0.1) 7.9 (0.1)* 7.6 (0.1)† 8.0(0.1)* 7.7 (0.1)†
Some to a good bit of time 7.0 (0.1) 7.4 (0.1) 6.4 (0.1) 7.1 (0.1) 6.7(0.2) 7.0 (0.1) None to a little of the time 6.3 (0.2) 7.1 (0.2) 5.4 (0.4) 6.5 (0.3) 6.0 (0.4) 6.9 (0.3)
Depressive symptoms No 7.5 (0.1)* 7.5 (0.0)† 7.5 (0.1)* 7.4 (0.1)† 7.6 (0.1)† 7.4 (0.1)
Yes 6.4 (0.2) 7.0 (0.2) 5.7 (0.3) 6.6 (0.3) 6.4 (0.3) 7.4 (0.2)
Behavioral variables
Smoking status Never 7.5 (0.1) 7.4 (0.1) 7.4 (0.1) 7.4 (0.1) 7.4 (0.1) 7.4 (0.1)
Past 7.4 (0.1) 7.5 (0.1) 7.3 (0.2) 7.4 (0.1) 7.5 (0.2) 7.5 (0.1)
Current 7.6 (0.4) 7.4 (0.3) 7.0 (0.9) 6.4 (0.7)
Alcohol intake (drinks/day) 0 7.4 (0.1) 7.4 (0.1) 7.4 (0.1) 7.4 (0.1) 7.3 (0.2) 7.5 (0.1)
<1 7.5 (0.1) 7.4 (0.1) 7.4 (0.1) 7.3 (0.1) 7.5 (0.1) 7.4 (0.1)
1–2 8.0 (0.5) 8.1 (0.4) 8.0 (0.7) 7.9 (0.5) 7.2 (0.6) 7.0 (0.5)
≥ 3 5.5 (1.2) 6.5 (0.9) 9.0 (1.3) 8.6 (1.0)
Recreational physical activity (min/week)
First quartile 7.2 (0.1)* 7.5 (0.1)‡ 6.6 (0.2)* 7.2 (0.1) 6.8 (0.2)* 7.4 (0.2)
Second quartile 7.2 (0.1) 7.3 (0.1) 7.3 (0.2) 7.3 (0.1) 7.2 (0.2) 7.3 (0.2) Third quartile 7.7 (0.1) 7.5 (0.1) 7.5 (0.1) 7.4 (0.1) 7.6 (0.2) 7.5 (0.1) Fourth quartile 7.9 (0.1) 7.6 (0.1) 7.8 (0.1) 7.5 (0.1) 8.1 (0.2) 7.6 (0.2) Health-related variables
In general, selfrated health Excellent 9.2 (0.3)* 9.0 (0.3)* 9.7 (0.2)* 9.4 (0.2)* 9.6 (0.4)* 9.2 (0.4)*
Very good 8.5 (0.1) 8.3 (0.1) 8.5 (0.1) 8.4 (0.1) 8.4 (0.1) 8.2 (0.1)
Good 7.0 (0.1) 7.0 (0.1) 7.4 (0.1) 7.4 (0.1) 7.3 (0.1) 7.4 (0.1)
Fair 5.6 (0.2) 5.9 (0.2) 6.0 (0.1) 6.1 (0.1) 5.8 (0.2) 5.9 (0.2)
Poor 4.3 (0.6) 5.1 (0.6) 4.3 (0.3) 4.4 (0.3) 4.3 (0.5) 4.8 (0.5)
Number of comorbidities 0 7.7 (0.3) 7.2 (0.2) 8.2 (0.3)* 7.5 (0.2) 8.0 (0.6) 7.0 (0.5)
1 7.5 (0.1) 7.4 (0.1) 7.8 (0.1) 7.5 (0.1) 7.7 (0.2) 7.5 (0.1)
2 7.4 (0.1) 7.5 (0.1) 7.5 (0.1) 7.4 (0.1) 7.4 (0.1) 7.5 (0.1)
3 7.1 (0.2) 7.3 (0.1) 7.2 (0.1) 7.4 (0.1) 7.2 (0.3) 7.4 (0.2)
≥ 4 6.6 (0.4) 7.2 (0.3) 6.9 (0.1) 7.5 (0.1) 6.9 (0.3) 7.5 (0.3)
BMI (kg/m2) Less than 25 7.4 (0.1) 7.4 (0.1) 7.8 (0.1)† 7.5 (0.1) 7.7 (0.2)‡ 7.5 (0.1)
25–29 7.4 (0.2) 7.4 (0.1) 7.4 (0.1) 7.4 (0.1) 7.5 (0.1) 7.4 (0.1)
At least 30 7.4 (0.3) 7.5 (0.2) 7.3 (0.1) 7.4 (0.1) 7.0 (0.2) 7.3 (0.2)
HRT ARM Not in HRT 7.4 (0.1) 7.4 (0.1) 7.4 (0.1) 7.4 (0.0) 7.4 (0.1) 7.4 (0.1)
CEE-alone intervention 7.1 (0.6) 6.8 (0.5) 7.5 (0.2) 7.6 (0.2) 7.1 (0.5) 7.3 (0.4) CEE-alone control 7.1 (0.6) 7.8 (0.5) 7.4 (0.2) 7.6 (0.2) 7.1 (0.4) 7.5 (0.3) CEE+MPA intervention 7.4 (0.4) 7.4 (0.3) 7.6 (0.2) 7.4 (0.2) 7.9 (0.4) 7.3 (0.3) CEE+MPA control 7.5 (0.3) 7.4 (0.2) 7.3 (0.3) 7.0 (0.2) 7.7 (0.4) 7.7 (0.4)
Notes: Analyses were done within each race/ethnicity. Statistical significance was indicated by three symbols: *p < 0.0001; †p < 0.01; ‡p < 0.05. § for African Americans 0.44; || for Asian/Pacific Islanders 0.54; ¶ for Hispanic/Latinos 0.50.
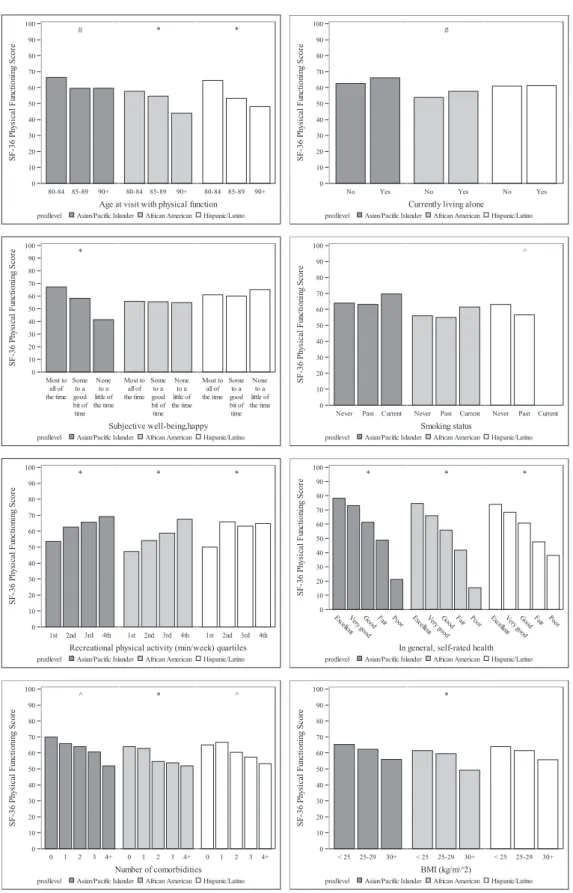
Correlates of Successful Aging as Defined by Physical Functioning Within Racial/Ethnic Groups
Table 3 reports the average physical functioning scores of each predictor within each race/ethnicity group and Figure 1
graphically depicts the average physical functioning scores of each predictor after multivariable adjustment within race/ ethnicity group. Hispanic/Latino African American Asian/Pacific Islander predlevel
Age at visit with physical function * *
#
80-84 85-89 90+ 80-84 85-89 90+
80-84 85-89 90+ 0 10 20 30 40 50 60 70 80 90 100 SF -36 Ph ys ic al Fu nc tion in g Sc or e Hispanic/Latino African American Asian/Pacific Islander predlevel
Currently living alone # No Yes No Yes No Yes 0 10 20 30 40 50 60 70 80 90 100 SF -3 6P hys ic al Fu nc tion in gS co re Hispanic/Latino African American Asian/Pacific Islander predlevel Subjective well-being,happy *
the timeall of Most to
time bit of goodto a Some
the timelittle of to a None
the timeall of Most to
time bit of goodto a Some
the timelittle of to a None
the timeall of Most to
time bit of goodto a Some
the timelittle of to a None 0 10 20 30 40 50 60 70 80 90 100 SF -3 6P hys ic al Func tion in g Sc or e Hispanic/Latino African American Asian/Pacific Islander predlevel Smoking status ^
Never Past Current Never Past Current
Never Past Current 0 10 20 30 40 50 60 70 80 90 100 SF -3 6P hys ic al Func tion in gS co re Hispanic/Latino African American Asian/Pacific Islander predlevel
Recreational physical activity (min/week) quartiles * *
*
1st 2nd 3rd 4th 1st 2nd 3rd 4th
1st 2nd 3rd 4th 0 10 20 30 40 50 60 70 80 90 100 SF -36 Ph ys ic al Fu nc tion in g Sc or e Hispanic/Latino African American Asian/Pacific Islander predlevel
In general, self-rated health * * * Excellen t Very
goodGood Fair Poor Excellen
t Very
goodGoodFair Poor Excellen
t Very
goodGood Fair Poor
0 10 20 30 40 50 60 70 80 90 100 SF-36 Ph ys ic al Fu nc tion in gS co re Hispanic/Latino African American Asian/Pacific Islander predlevel
Number of comorbidities ^ *
^
0 1 2 3 4+ 0 1 2 3 4+
0 1 2 3 4+ 0 10 20 30 40 50 60 70 80 90 100 SF -36 Ph ys ic al Fu nc tion in g Sc or e Hispanic/Latino African American Asian/Pacific Islander predlevel BMI (kg/m\^2) *
< 25 25-29 30+ < 25 25-29 30+
< 25 25-29 30+ 0 10 20 30 40 50 60 70 80 90 100 SF -3 6P hy si ca lF un ct io ni ng Sc or e
Figure 1. Adjusted average SF-36 physical functioning by age (at visit with physical function), currently living alone, subjective wellbeing/happy, smoking status, recreational physical activity, selfrated health, number of comorbidities and BMI within race/ethnicity. Statistical significance was indicated by three symbols: *p < 0.0001; #p < 0.01; ^p < 0.05.
African American
Mean physical functioning scores remained significantly higher for women in the 80–84 year group after multivariable adjust-ment (Figure 1). Among the psychosocial variables, mean physical
functioning scores were highest for those in the highest quartiles of social support and optimism, those who reported being happy “most to all of the time” (as compared to “some” or “none” of the time), and those without depressive symptoms. However, these differences Hispanic/Latino
African American Asian/Pacific Islander
predlevel
Age at visit with physical function # ^
^
80-84 85-89 90+ 80-84 85-89 90+
80-84 85-89 90+ 0 1 2 3 4 5 6 7 8 9 10 LI FEQ UA L LS M EA N
predlevel Asian/Pacific Islander African American Hispanic/Latino
Social support score quartiles ^ #
1st 2nd 3rd 4th 1st 2nd 3rd 4th
1st 2nd 3rd 4th 0 1 2 3 4 5 6 7 8 9 10 LI FE QU AL LS ME AN Hispanic/Latino African American Asian/Pacific Islander predlevel
Optimism total score quartiles # #
^
1st 2nd 3rd 4th 1st 2nd 3rd 4th
1st 2nd 3rd 4th 0 1 2 3 4 5 6 7 8 9 10 LI FEQ UA L LS M EA N
predlevel Asian/Pacific Islander African American Hispanic/Latino
Subjective well-being,happy * ^
#
the timeall of Most to
time bit of goodto a Some
the timelittle of to a None
the timeall of Most to
time bit of goodto a Some
the timelittle of to a None
the timeall of Most to
time bit of goodto a Some
the timelittle of to a None 0 1 2 3 4 5 6 7 8 9 10 LI FE QU A L LSM EA N Hispanic/Latino African American Asian/Pacific Islander
predlevel Depressive symptoms
^ ^ No Yes No Yes No Yes 0 1 2 3 4 5 6 7 8 9 10 LI FEQ UA L LS M EA N
predlevel Asian/Pacific IslanderRecreational physical activity (min/week) quartilesAfrican American Hispanic/Latino
^
0 Exc
ellentVerygood Good
0 Exc
ellentVerygood Good
0 Exc
ellentVerygood Good 0 1 2 3 4 5 6 7 8 9 10 LI FE QUA LL SM EA N
Hispanic/Latino African American Asian/Pacific Islander
predlevel In general, self-rated health
* * * Excellen t Very
gooGooddFair Poor Excellen
t Very
gooGooddFair Poor Excellen
t Very
gooGooddFair Poor
0 1 2 3 4 5 6 7 8 9 10 LI FE Q U AL LSM EA N
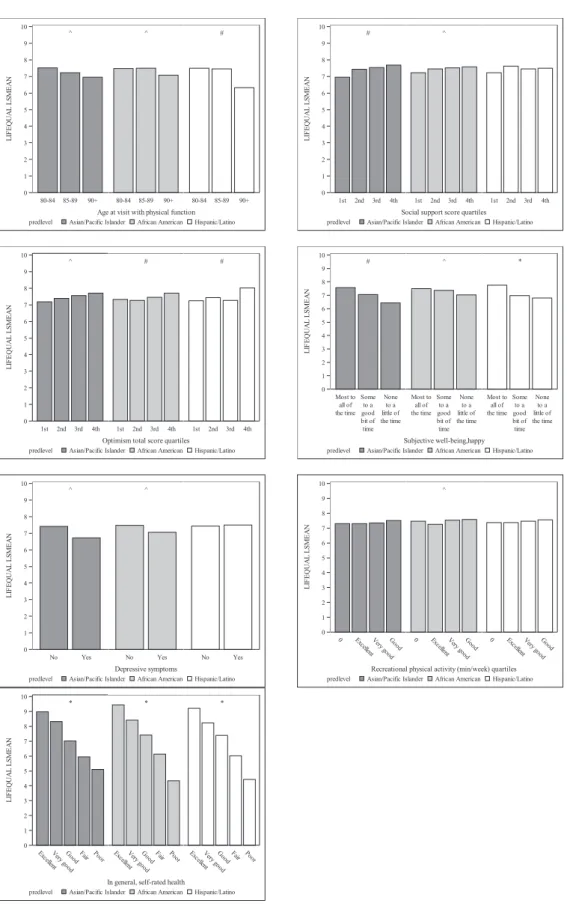
Figure 2. Adjusted average quality of life score by age (at visit with physical function), social support score, optimism total score, happy, depressive symptoms, recreational physical activity, and selfrated health, within race/ethnicity. Statistical significance was indicated by three symbols: *p < 0.0001; #p < 0.01; ^p < 0.05.
did not remain statistically significant after multivariable adjustment (Figure 1). Neither smoking status nor alcohol intake was associated with physical functioning in adjusted analyses. Physical functioning was positively related to the amount of recreational physical activ-ity in both unadjusted and adjusted analyses. Of the health-related variables, physical functioning was positively associated with over-all selfrated health in both unadjusted and adjusted analyses. African American women with no comorbidities had significantly higher physical functioning scores compared to those with any comorbidities and the statistical significance of this association persisted in adjusted analyses. BMI category was significantly associated with physical functioning such that women in the obese BMI category (BMI ≥ 30) had the lowest mean physical functioning scores and normal BMI women had the highest scores.
Asian/Pacific Islander
Increasing age was associated with worse mean physical functioning score in both unadjusted and adjusted analyses. None of the other demographic factors were associated with physical functioning in adjusted analyses (Figure 1). Among the psychosocial variables, only subjective well-being/happiness was associated with physical func-tioning in adjusted analysis, such that women who reported being happy “most to all” of the time compared to “some” or “none” of the time had the highest physical functioning scores. With respect to behavioral variables, amount of recreational physical activity was positively associated with physical functioning (Table 3). Not surprisingly, better selfrated health and lack of comorbidities (com-pared with any number of comorbidities) was associated with higher mean physical functioning scores.
Hispanic/Latino
Increasing age was associated with worse mean physical function-ing scores in both unadjusted and adjusted analyses (Table 3). Of the psychosocial variables, optimism was positively associated with mean physical functioning scores in unadjusted, but not adjusted results (Table 3). Similar to the pattern in the other minority groups, more weekly recreational physical activity was associated with significantly higher mean physical functioning scores in both adjusted and unadjusted analyses. There was a significant positive association between physical functioning scores and better self-rated health.
Correlates of successful aging as indicated by selfrated QOL within racial/ethnic groups
Table 4 reports the unadjusted and adjusted average overall selfrated QOL scores of each predictor within race/ethnicity groups. Figure 2 graphically depicts the average overall QOL scores of each predictor after multivariable adjustment.
African American
Besides age, none of the other demographic variables were associ-ated with overall QOL in adjusted analyses. Among the psychosocial variables, lower perceived social support, lower optimism, and the presence of depressive symptoms were associated with lower mean QOL scores in both unadjusted (Table 4) and adjusted analyses (Figure 2). Of the behavioral variables, only recreational physical activity was associated with overall QOL score, with women in the lowest quartiles having the worse overall QOL. There was a signifi-cant positive association between overall self-rated health and QOL scores.
Asian/Pacific Islander
Age was associated with overall QOL score in both adjusted and unadjusted analyses (Table 4). Higher quartiles of social support, more subjective well-being/happy, and absence of depressive symp-toms were associated with significantly higher QOL scores in unad-justed and adunad-justed analyses. None of the behavioral variables were associated with overall QOL in adjusted analyses. Of the health-related variables, only selfrated health was associated with overall QOL.
Hispanic/Latino
None of the demographic variables were associated with significant differences in mean overall QOL. Among the psychosocial variables, lower optimism scores were associated with significantly worse over-all QOL scores. Women who reported being happy “most to over-all” of the time compared with lesser amounts of time had the highest overall QOL in adjusted analyses. None of the behavioral variables were significantly associated with overall mean QOL scores in mul-tivariate analyses. Better self-rated health was associated with higher overall QOL in unadjusted and adjusted analyses. The other health-related variables were not significantly associated with QOL.
Discussion
We examined a broad array of correlates of “successful aging” as defined by the physical functioning aspect of health-related QOL and selfrated overall QOL among a large sample of older racial/ ethnic minority women in the WHI. Our findings reveal several key results. First, physical functioning did not differ significantly between racial/ethnic minority groups, after adjusting for key demo-graphic, psychosocial, behavioral, and health-related variables. To our knowledge, no other population-based studies have compared physical functioning scores (using the same measure we used) across groups of older racial/ethnic minority women and therefore we can-not draw comparable comparisons with prior literature.
Second, in within group analyses, we found that age, recreational physical activity, and overall selfrated health were consistently asso-ciated with physical functioning across each racial/ethnic groups in adjusted and unadjusted analyses. The “youngest old” (80–84 year old) had higher physical functioning scores than women over age 84. Previous studies have also shown that older adults and some racial ethnic minorities have worse health-related QOL, as mani-fest by physically unhealthy days, although these studies did not further stratify age categories beyond age 80 years (32,33). Similar to our findings, other studies in racial/ethnic minority groups have also found that engagement in regular exercise is a correlate of self-rated successful aging (17,33). Given that individuals’ perceptions of their overall selfrated health is greatly influenced by their physi-cal health condition (34), it is not surprising that selfrated health was consistently associated with physical functioning and selfrated overall QOL.
Third, we found statistically significant differences in overall QOL ratings between racial/ethnic minority groups, with African Americans having the highest mean QOL rating (7.5), followed by Hispanic/Latinos (7.4), then Asian/Pacific Islanders (7.3). These differences however, are likely not clinically meaningful (5).Notably, our model accounted for 45% of the variance in QOL scores between groups, suggesting that much of the vari-ance in overall QOL remains unexplained. Fourth, upon closer examination of the correlates of overall QOL within each racial/
ethnic minority group, we found that overall selfrated health status was the only consistent (ie statistically significant in both unad-justed and adunad-justed analyses) and independent correlate of over-all QOL ratings across over-all minority groups. However, perceived social support, optimism, subjective well-being/happiness, depres-sive symptoms, and amount of recreational physical activity, were independently associated with overall QOL scores within certain racial/ethnic minority groups. For example, lower perceived social support was independently associated with worse QOL in African Americans and Asian/Pacific Islanders, but not among Hispanic/ Latinos; higher subjective well-being was independently associ-ated with better overall QOL scores in Asian/Pacific Islanders and Hispanic/Latinos, but not in African Americans.
In addition to this study providing substantive information on QOL among older racial/ethnic minority women, it also provides methodological insights on QOL assessment. The use of a single-item assessment of overall QOL, in combination with a multi-single-item domain specific measure (ie physical functioning aspect of health-related QOL) was advantageous in this study. Not only is a single-item measure attractive because of its simplicity and practicality, but it also captures any domains that the respondent deems impor-tant to her QOL. By comparing categories of variables associated with overall QOL and physical functioning, we can draw impor-tant comparisons for both outcomes, which are related but still conceptually distinct, and examine how associations differ between and within racial/ethnic minority groups. Obviously, any observed deficits in overall QOL require deeper exploration into the precise nature of the deficit (eg whether the deficit is in physical, mental, or social functioning).
Further, although there is no agreed upon definition of success-ful aging, it is well-established that successsuccess-ful aging is a multidi-mensional construct (18,19). Most studies use composite measures to operationalize successful aging, whereas we examined physical functioning and selfrated overall QOL as individual indicators. We recognize, and studies show, that older adults often base their defini-tions of successful aging on attitudinal factors (eg selfacceptance/ selfcontentment) rather than solely relying on physical health sta-tus, and they consider well-being and social functioning to be more important than physical and psychocognitive functioning (35–37). The fact that only about half of the variance in physical functioning and overall QOL within each of the racial/ethnic minority groups was explained by our models suggests that there are important correlates of these outcomes that we did not consider. Attempts to understand what successful aging means and identify its correlates in older racial/ethnic minorities should consider this construct within broader social, economic and political contexts.
Predominant definitions and models of successful aging (eg Rowe and Kahn) focus on success or failure and individual responsibility for success based on one’s choices and behaviors, without regard to factors beyond individual control that influence aging. “Contextualization” of the aging experience is important and necessary in research con-ducted with racial and ethnic minority groups considering the social and structural inequalities experienced by these groups. Such ine-qualities (eg lower quality education, lower or unskilled jobs with more physically demanding tasks, lower pay at equivalent levels of education, lower incomes at retirement, higher exposure to toxic or unsafe working and living conditions, less access to health insurance or higher co-pays and deductibles even when insured, less access to or lower quality health care, greater receipt of health care in suboptimal settings, and less continuity of care) often place racial/ethnic minor-ity groups and women at greater risk of negative health outcomes in
later life (38–42). Moreover, the potential for poor health and less “successful aging” is further compounded among older individuals because the advantages and disadvantages that accrue across the life course become more salient in later life when individuals are also faced with ageism and age-related discrimination.
As in all studies, our findings should be considered in light of study limitations. First, our study is largely cross-sectional. Longitudinal analyses are needed to more fully establish the directionality of the relationships. Second, our use of self-reported measures may be problematic. When psychosocial predictors, in particular, and health outcomes are both assessed via selfreports, they share common method variance, and this shared variance may lead to inflated associations. For example, there may be com-mon processes underlying some of the psychological constructs (ie subjective well-being/happiness, optimism) and ratings of physi-cal functioning and selfrated overall QOL. Third, the associations we demonstrated may be spurious, due to multiple comparisons.
Despite these limitations, our study has several strengths. First, the WHI is the largest cohort study of older women in the United States and to our knowledge this is the only study to examine pre-dictors of the successful aging both within and between a diverse group of racial/ethnic minority women 80 years and older. Second, we used established and validated measures as correlates in our anal-yses. This approach informs the literature on how these measures are operationalized in an aging and racially diverse cohort.
Our study provides a unique contribution to the literature because we compare physical functioning and overall QOL across samples of older racial/ethnic minority women. To our knowledge, no other population based studies have done this. Older adults from minority populations experience a disproportionate burden of disease and death, as well as more disability and functional limitations (43,44). Studies which compare racial/ethnic minor-ity groups and racial/ethnic subgroups within minorminor-ity groups are necessary for understanding the heterogeneity that exists within ethnic minority groups. Improving health-related and overall QOL among older adults and racial/ethnic minorities in particular, is an important public health goal given the shifting demographics of the U.S. population. Our research provides valuable input for under-standing the broad array of factors that influence physical func-tioning and QOL in current and future cohorts of older minority women. This work is relevant for individuals, their families, health care providers, health care systems, and policymakers as we seek to support the health and well-being of our increasingly diverse population of older women.
Supplementary Material
Supplementary material can be found at: http://biomedgerontology. oxfordjournals.org/
Funding
The WHI program was supported by the National Heart Lung and Blood Institute at the National Institutes of Health; the U.S. Department of Health and Human Services (HHSN268201100046C, HHSN268201100001C, HHSN268201100002C, HHSN2682011 00003C, HHSN268201100004C); the National Center for Research Resources [grant number KL2RR025746 to C.W.C]; and the National Heart, Lung, and Blood Institute [grant number K23HL107614 to C.W.C]
Acknowledgments
The authors would like to acknowledge all of the women who have graciously given their time to participate in the WHI study over the years. We would also like to thank the members of the Race and Minority Health Scientific Interest Group of the WHI for their contributions to this manuscript and commitment to advancing the science of minority health and aging. Correspondence about this manuscript should be addressed to Dr. Crystal W. Cené at crystal_cene@ med.unc.edu
Conflict of Interest. None of the authors on this manuscript have any conflicts of interest to disclose.
References
1. Alley DE, Putney NM, Rice M, Bengtson VL. The increasing use of the-ory in social gerontology: 1990–2004. J Gerontol B Psychol Sci Soc Sci. 2010;65(5):583–590. doi: 10.1093/geronb/gbq053.
2. Depp CA, Jeste DV. Definitions and predictors of successful aging: a com-prehensive review of larger quantitative studies. Am J Geriatr Psychiatry. 2006;14(1):6–20. doi: 10.1097/01.JGP.0000192501.03069.bc.
3. Berkman LF, Seeman TE, Albert M, et al. High, usual and impaired func-tioning in community-dwelling older men and women: findings from the MacArthur foundation research network on successful aging. J Clin Epi-demiol. 1993;46:1129–1140.
4. Guralnik JM, LaCroix AZ, Abbott RD, et al. Maintaining mobility in late life. I. Demographic characteristics and chronic conditions. Am J Epide-miol. 1993;137:845–857.
5. Guralnik JM, Kaplan GA. Predictors of healthy aging: prospective evidence from the Alameda County study. Am J Public Health. 1989;79:703–708. 6. Seeman TE, Charpentier PA, Berkman LF, et al. Predicting changes in
phys-ical performance in a high-functioning elderly cohort: MacArthur studies of successful aging. J Gerontol. 1994;49:M97–108.
7. LaCroix AZ, Guralnik JM, Berkman LF, Wallace RB, Satterfield S. Main-taining mobility in late life. II. Smoking, alcohol consumption, physical activity, and body mass index. Am J Epidemiol. 1993;137:858–869. 8. Strawbridge WJ, Wallhagen MI, Cohen RD. Successful aging and
well-being: self-rated compared with Rowe and Kahn. Gerontologist. 2002;42:727–733.
9. Achat H, Kawachi I, Spiro A 3rd, DeMolles DA, Sparrow D. Optimism and depression as predictors of physical and mental health functioning: the Normative Aging Study. Ann Behav Med. 2000;22:127–130. 10. Brenes GA, Rapp SR, Rejeski WJ, Miller ME. Do optimism and pessimism
predict physical functioning? J Behav Med. 2002;25:219–231.
11. U.S. Census Bureau. Sixty-five plus in the United States. https://www.
census.gov/population/socdemo/statbriefs/agebrief.html. Updated 2011.
Accessed June 13,2014.
12. Woods NF, Cochrane BB, LaCroix AZ, et al. Toward a positive aging phe-notype for older women: observations from the women’s health initiative.
J Gerontol A Biol Sci Med Sci. 2012;67(11):1191–1196. doi: 10.1093/ gerona/gls117; 10.1093/gerona/gls117.
13. Moody-Ayers SY, Mehta KM, Lindquist K, Sands L, Covinsky KE. Black-white disparities in functional decline in older persons: the role of cog-nitive function. J Gerontol A Biol Sci Med Sci. 2005;60(7):933–939. doi:10.1093/gerona/60.7.933.
14. Atkinson HH, Cesari M, Kritchevsky SB, et al. Predictors of combined cognitive and physical decline. J Am Geriatr Soc. 2005;53(7):1197–1202. doi: 10.1111/j.1532-5415.2005.53362.x.
15. Andrews G, Clark M, Luszcz M. Successful aging in the Australian longi-tudinal study of aging: applying the MacArthur model cross-nationally. J Soc Iss. 2002;58(4):749–765. doi: 10.1111/1540–4560.00288.
16. Vaillant GE, Mukamal K. Successful aging. Am J Psychiatry. 2001;158:839–847.
17. Cernin PA, Lysack C, Lichtenberg PA. A comparison of self-rated and objectively measured auccessful aging constructs in an urban sample of African American older adults. Clin Gerontol. 2011;34(2):89–102. doi: 10.1080/07317115.2011.539525.
18. Phelan EA, Anderson LA, LaCroix AZ, Larson EB. Older adults’ views of “successful aging”–how do they compare with researchers’ definitions? J Am Geriatr Soc. 2004;52:211–216.
19. Ferri C, James I, Pruchno R. Successful aging: definitions and subjective assessment according to older adults. Clin Gerontol. 2009;32(4):379–388. doi: 10.1080/07317110802677302.
20. McCarthy H, Thomas G. Home Alone: Combating Isolation with Older Housebound People. London, UK: Demos; 2004.
21. Anderson GL, Manson J, Wallace R, et al. Implementation of the women’s health initiative study design. Ann Epidemiol. 2003;13(suppl 9):S5–S17. doi: 10.1016/S1047-2797(03)00043-7.
22. Langer RD, White E, Lewis CE, Kotchen JM, Hendrix SL, Trevisan M. The women’s health initiative observational study: baseline characteris-tics of participants and reliability of baseline measures. Ann Epidemiol. 2003;13(suppl 9):S107–S121. doi: 10.1016/S1047-2797(03)00047-4. 23. Ritenbaugh C, Patterson RE, Chlebowski RT, et al. The women’s health
initiative dietary modification trial: overview and baseline characteristics of participants. Ann Epidemiol. 2003;13(suppl 9):S87–S97. doi: 10.1016/ S1047-2797(03)00044-9.
24. Stefanick ML, Cochrane BB, Hsia J, Barad DH, Liu JH, Johnson SR. The women’s health initiative postmenopausal hormone trials: overview and baseline characteristics of participants. Ann Epidemiol. 2003;13(suppl 9):S78–S86. doi: 10.1016/S1047-2797(03)00045-0.
25. Espeland MA, Pettinger M, Falkner KL, et al. Demographic and health factors associated with enrollment in posttrial studies: the women’s health initiative hormone therapy trials. Clin Trials. 2013;10(3):463–472. doi: 10.1177/1740774513477931.
26. Andresen EM, Bowley N, Rothenberg BM, Panzer R, Katz P. Test-retest per-formance of a mailed version of the Medical Outcomes Study 36-Item Short-Form Health Survey among older adults. Med Care. 1996;34:1165–1170. 27. Zimmerman M, Ruggero CJ, Chelminski I, et al. Developing brief scales
for use in clinical practice: the reliability and validity of single-item self-report measures of depression symptom severity, psychosocial impairment due to depression, and quality of life. J Clin Psychiatry. 2006;67:1536– 1541.
28. Singh JA, Satele D, Pattabasavaiah S, Buckner JC, Sloan JA. Normative data and clinically significant effect sizes for single-item numerical linear analogue self-assessment (LASA) scales. Health Qual Life Outcomes. 2014;12(1):187. doi: s12955-014-0187-z [pii].
29. Sloan JA, Zhao X, Novotny PJ, et al. Relationship between deficits in over-all quality of life and non-smover-all-cell lung cancer survival. J Clin Oncol. 2012;30(13):1498–1504. doi: 10.1200/JCO.2010.33.4631.
30. Sherbourne CD, Stewart AL. The MOS social support survey. Soc Sci Med. 1991;32:705–714.
31. Scheier MF, Carver CS, Bridges MW. Distinguishing optimism from neu-roticism (and trait anxiety, self-mastery, and self-esteem): a reevaluation of the life orientation test. J Pers Soc Psychol. 1994;67:1063–1078. 32. Zack MM. Health-related quality of life—United states, 2006 and 2010.
CDC Health Disparities and Inequalities Report—United States, 2013. 2013;62(3):105.
33. Kwon SC, Wyatt LC, Kranick JA, et al. Physical activity, fruit and vegeta-ble intake, and health-related quality of life among older chinese, hispan-ics, and blacks in new york city. Am J Public Health. 2015;105(0):e1–e9. 34. Krause NM, Jay GM. What do global self-rated health items measure?
Med Care. 1994;32:930–942.
35. Reichstadt J, Depp CA, Palinkas LA, Folsom DP, Jeste DV. Building blocks of successful aging: a focus group study of older adults’ perceived contrib-utors to successful aging. Am J Geriatr Psychiatry. 2007;15(3):194–201. doi: 10.1097/JGP.0b013e318030255f.
36. Reichstadt J, Sengupta G, Depp CA, Palinkas LA, Jeste DV. Older adults’ perspectives on successful aging: qualitative interviews. Am J Geriatr Psy-chiatry. 2010;18:567–575.
37. Laditka SB, Corwin SJ, Laditka JN, et al. Attitudes about aging well among a diverse group of older americans: Implications for promoting cognitive health. Gerontologist. 2009;49(suppl 1):S30–S39. doi: 10.1093/geront/ gnp084.
38. DeNavas-Walt C, Proctor BD, Smith JC. Income, poverty, and health insurance coverage in the united states. U S Census Bureau, Curr Popula-tion Rep. 2013;P60–245.
39. Williams DR. Racism and health. In: Whitfield KE, ed. Closing the Gap: Improving the Health of Minority Elders in the New Millennium. Wash-ington, D.C.: Gerontological Society of America; 2004:69–79.
40. Brown E. Work, retirement, race, and health disparities. In: Anto-nucci TC, Jackson JS, Sterns H, eds. Annual Review of Gerontology and Geriatics: Life-Course Perspectives on Late-Life Health Inequali-ties. Vol. 29. New York, NY: Springer Publishing Company; 2009: 233–249.
41. Institute of Medicine. A Shared Destiny: Community Effect of Insurance. Washington, D.C.: The National Academies Press; 2003.
42. Bird CE, Rieker PP. Gender and Health: The Effects of Constrained Choices and Social Policies. New York: Cambridge University Press; 2008. 43. Manton KG, Gu X. Changes in the prevalence of chronic disability in the united states black and nonblack population above age 65 from 1982 to 1999. Proc Natl Acad Sci U S A. 2001;98(11):6354–6359. doi: 10.1073/ pnas.111152298.
44. Malmstrom TK, Wolinsky FD, Andresen EM, Miller JP, Miller DK. Cognitive ability and physical performance in middle-aged african americans. J Am Ger-iatr Soc. 2005;53(6):997–1001. doi: 10.1111/j.1532-5415.2005.53318.x.
![Table 3. Unadjusted and Adjusted Average SF-36 Physical Functioning Score (Mean [SE]) of Each Predictor Within Each Race/Ethnicity (Stratified Analyses)](https://thumb-us.123doks.com/thumbv2/123dok_us/8248780.2185739/6.892.84.810.119.1009/unadjusted-adjusted-physical-functioning-predictor-ethnicity-stratified-analyses.webp)
![Table 4. Unadjusted and Adjusted Average Selfreported Quality of Life (Mean [SE]) of Each Predictor Within Each Race/Ethnicity (Stratified Analyses)](https://thumb-us.123doks.com/thumbv2/123dok_us/8248780.2185739/7.892.94.812.132.1011/unadjusted-adjusted-average-selfreported-predictor-ethnicity-stratified-analyses.webp)