arXiv:1612.00886v2 [nucl-ex] 11 Apr 2017
Violation, and Electron Decay from the M
ajorana
D
emonstrator
N. Abgrall,1 I.J. Arnquist,2 F.T. Avignone III,3, 4 A.S. Barabash,5 F.E. Bertrand,4 A.W. Bradley,1
V. Brudanin,6 M. Busch,7, 8 M. Buuck,9T.S. Caldwell,10, 8 Y-D. Chan,1 C.D. Christofferson,11 P.-H. Chu,12
C. Cuesta,9 J.A. Detwiler,9 C. Dunagan,11 Yu. Efremenko,13 H. Ejiri,14 S.R. Elliott,12 T. Gilliss,10, 8
G.K. Giovanetti,16 J. Goett,12 M.P. Green,17, 8, 4J. Gruszko,9 I.S. Guinn,9 V.E. Guiseppe,3 C.R.S. Haufe,10, 8
R. Henning,10, 8 E.W. Hoppe,2 S. Howard,11 M.A. Howe,10, 8 B.R. Jasinski,15 K.J. Keeter,18M.F. Kidd,19
S.I. Konovalov,5R.T. Kouzes,2 A.M. Lopez,13 J. MacMullin,10, 8 R.D. Martin,20 R. Massarczyk,12
S.J. Meijer,10, 8 S. Mertens,21, 22 C. O’Shaughnessy,10, 8 A.W.P. Poon,1 D.C. Radford,4 J. Rager,10, 8
A.L. Reine,10, 8 K. Rielage,12 R.G.H. Robertson,9 B. Shanks,10, 8 M. Shirchenko,6 A.M. Suriano,11
D. Tedeschi,3 J.E. Trimble,10, 8 R.L. Varner,4S. Vasilyev,6 K. Vetter,1,∗ K. Vorren,10, 8,† B.R. White,12
J.F. Wilkerson,10, 8, 4 C. Wiseman,3 W. Xu,15 E. Yakushev,6 C.-H. Yu,4 V. Yumatov,5 I. Zhitnikov,6and B.X. Zhu12
(The Majorana Collaboration)
1
Nuclear Science Division, Lawrence Berkeley National Laboratory, Berkeley, California 94720, USA 2
Pacific Northwest National Laboratory, Richland, Washington 99352, USA 3
Department of Physics and Astronomy, University of South Carolina, Columbia, South Carolina 29208, USA 4
Oak Ridge National Laboratory, Oak Ridge, Tennessee 37831, USA 5
National Research Center “Kurchatov Institute” Institute for Theoretical and Experimental Physics, Moscow 117218, Russia 6Joint Institute for Nuclear Research, Dubna 141980, Russia
7
Department of Physics, Duke University, Durham, North Carolina 27708, USA 8
Triangle Universities Nuclear Laboratory, Durham, North Carolina 27708, USA 9
Center for Experimental Nuclear Physics and Astrophysics, and Department of Physics, University of Washington, Seattle, Washington 98195, USA 10
Department of Physics and Astronomy, University of North Carolina, Chapel Hill, North Carolina 27599, USA 11South Dakota School of Mines and Technology, Rapid City, South Dakota 57701, USA
12
Los Alamos National Laboratory, Los Alamos, New Mexico 87545, USA 13
Department of Physics and Astronomy, University of Tennessee, Knoxville, Tennessee 37996, USA 14
Research Center for Nuclear Physics, Osaka University, Ibaraki, Osaka 567-0047, Japan 15
Department of Physics, University of South Dakota, Vermillion, South Dakota 57069, USA 16
Department of Physics, Princeton University, Princeton, New Jersey 08544, USA 17
Department of Physics, North Carolina State University, Raleigh, North Carolina 27695, USA 18
Department of Physics, Black Hills State University, Spearfish, South Dakota 57799, USA 19
Tennessee Tech University, Cookeville, Tennessee 38505, USA 20
Department of Physics, Engineering Physics and Astronomy, Queen’s University, Kingston, Ontario K7L 3N6, Canada 21
Max-Planck-Institut f¨ur Physik, M¨unchen 80805, Germany 22
Physik Department and Excellence Cluster Universe, Technische Universit¨at, M¨unchen 80805, Germany
(Dated: March 21, 2017)
We present new limits on exotic keV-scale physics based on 478 kg d of Majorana D emon-stratorcommissioning data. Constraints at the 90% confidence level are derived on bosonic dark
matter (DM) and solar axion couplings, Pauli exclusion principle violating (PEPV) decay, and electron decay using monoenergetic peak signal-limits above our background. Our most stringent DM constraints are set for 11.8 keV mass particles, limiting gAe< 4.5×10⁻¹³ for pseudoscalars
and α′
α <9.7×10
−28
for vectors. We also report a 14.4 keV solar axion coupling limit ofgeff
AN×
gAe < 3.8×10⁻¹⁷, a 1 2β
2
< 8.5×10−48 limit on the strength of PEPV electron transitions, and
a lower limit on the electron lifetime ofτe>1.2×1024 yr fore−→invisible.
PACS numbers: 95.35.+d
The Majorana Demonstrator, described in
de-tail in Ref. [1], is a neutrinoless double-beta decay (0νββ) experiment located 4850 ft underground at the Sanford Underground Research Facility in Lead, South Dakota [2]. Majoranaconsists of two separate custom
ultralow background modules, each containing seven ar-rays ofP-type point contact (PPC) high-purity germa-nium (HPGe) detectors with a total mass of 44.1 kg, of
which 29.7 kg is enriched to 88%76Ge.
particles (WIMP) and bosonic dark matter (DM) [6–8] as well as 0νββdecay searches [9–11].
In this Letter, we set limits on multiple keV-scale rare-event interactions from monoenergetic signal limits with 478 kg d of Majorana commissioning data. Bosonic
pseudoscalar (i.e. axionlike) and vector DM, with mass scale of 1–100 keV, offer an explanation for the observed subgalactic structure in the Universe, assuming a large number density compensates for their light mass. With suitable electronic coupling strength, they may be de-tectable via a pseudoscalar or vector-electric effect that is analogous to photoelectric absorption [12–14]. In addi-tion, we report limits on the coupling of 14.4 keV solar ax-ions competing in theM1 transition of57Fe nuclei, Pauli
exclusion principle violating (PEPV) electronic transi-tions, and electron decay,e−→invisible.
Majorana relies on careful material selection and
handling [15] to reduce intrinsic and extrinsic radioactive background, making it well suited for dark matter and other rare-event searches. Majorana modules are
sur-rounded by a copper shield, a lead shield, an active muon veto [16], and a polyethylene neutron shield. Within the shielding, radon is purged via liquid nitrogen boil-off. The inner 5 cm of the copper shield, the cryostats that house the detectors, and the crystal support structures are fabricated from radiopure (<0.1 µBq/kg U) copper electroformed in an underground facility.
The data presented here were acquired during the June 30 to September 22, 2015 commissioning of M ajo-ranaModule 1 (M1). During this time, Module 2 was
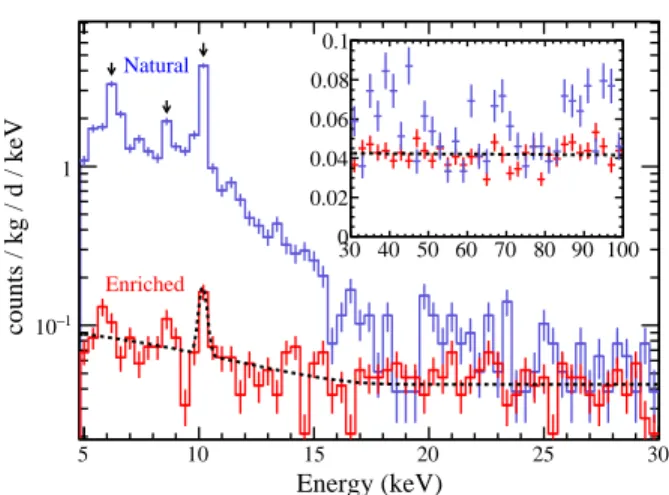
under construction and not operational. The shield was incomplete: the innermost 5 cm of electroformed copper shielding was not yet installed, the active muon-veto sys-tem was not finished, and the exterior neutron shielding did not fully enclose the inner layers. Shielding inside and outside the vacuum and cryogenic services still had to be added. The natural (unenriched) detectors had a high cosmogenic background compared to the enriched detectors because of different handling procedures, and were only used here for systematic studies; see Fig. 1. Seven of the enriched detectors were inoperable due to failed electrical connections or high noise rates. The ac-tive mass of the remaining 13 enriched detectors was com-puted from detector dead layer measurements provided by ORTEC [17] and verified via collimated133Ba source
scans, totaling 10.06±0.13 kg. The commissioning live time was 47.503±0.001 d, resulting in an exposure of 478±6 kg d.
The data-acquisition (DAQ) system is controlled and monitored by the ORCA software package [18]. Signals from the PPC detectors are amplified and shaped by a custom low-noise resistive-feedback preamplifier with a measured equivalent noise charge of ∼85 eV in Ge-detector-equivalent FWHM resolution [19]. The ampli-fier provides low-gain and high-gain outputs that are digi-tized separately by a custom 14-bit 100 MHz VME-based
Energy (keV)
5 10 15 20 25 30
counts / kg / d / keV 10−1 1
30 40 50 60 70 80 90 100 0
0.02 0.04 0.06 0.08 0.1 Natural
Enriched
FIG. 1. Energy spectra from 195 kg d of natural (blue) and 478 kg d of enriched (red) detector data. A fit of the back-ground model (linear + tritium beta spectrum + 68
Ge K
shell) to the enriched spectrum is also shown (dotted black). The background rate and slope, along with the tritium andK -shell rate were floated in the fit. The background fitχ2
/NDF is 75.7/85. Cosmogenic isotopes in the natural detectors pro-duce peaks at 10.36 (68
Ge), 8.9 (65
Zn), and 6.5 keV (55
Fe) on top of a tritium beta decay continuum. The FWHM of the 10.4 keV peak is∼0.4 keV. The spectrum shown does not
include aT /Ecut acceptance correction.
digitizer designed for the GRETINA experiment [20]. Signals are digitized continuously and triggers are gen-erated when the output of a firmware-based trapezoidal filter trigger exceeds the preset threshold for that chan-nel. An internal pulser (∼0.1 Hz), implemented by in-jecting charge through capacitive coupling to the gate of the preamplifier’s front-end JFET, is used to monitor detector live time and gain stability.
Transient and other irregular noise pulses from the DAQ hardware contaminate the energy spectrum be-tween 2 − 70 keV. Most of the nonphysical waveforms are due to accidental retriggering during baseline restora-tion after pulser events. These are removed by eliminat-ing events with more than one detector hit or by useliminat-ing pulse-shape discrimination. The acceptance of these cuts is 99.98% with negligible uncertainty.
Slow-pulse waveforms with rise times of∼1µs or longer constitute a significant background below 30 keV, as rec-ognized by previous experiments [6–8, 21]. Slow pulses are energy-degraded events that originate in low-field re-gions of the detector near the surface dead layer, where diffusion is the dominant mode of charge transport. At energies<10 keV, discriminating slow pulses using pulse rise-time measurements becomes difficult since signal to noise ratio decreases with energy.
and the maximum (T) value of the result was measured. The T value was normalized by an energy parameter, (E), which was reconstructed offline by finding the max-imum [22] of a trapezoidal filtered waveform with a fil-ter rise time of 4 µs and flat-top time of 2.5 µs. This parameter exhibited good separation between fast and slow-pulse waveforms down to∼3 keV, below the 5 keV analysis threshold.
The signal acceptance of the T /E cut was measured by capacitively injecting simulated signal pulses of vary-ing amplitude directly onto the detector’s outer contact using a precision waveform generator. The energy depen-dent acceptance was determined by finding the fraction of these events that pass the cut at set pulse amplitudes. An error function was fit to the acceptance fractions to estimate the acceptance between pulser-peak events. Only three of the 13 analysis detectors were instrumented with the required electronics to perform this test and the smallest-valued (most conservative) acceptance function, ranging from 96% at 5 keV to 100% at 20 keV, was ap-plied in the DM rate analysis, Eq. 4. The detector ac-ceptance functions varied by at most 1%. The energy dependent acceptance uncertainty was determined from the error function fit,
η(E) = Erf(√E−µ)
2σ (1)
The fit values wereµ = −26 ± 4 keV andσ = 13.7 ±
1.7 keV with a strong anticorrelation, corr(µ, σ) ∼ −1. A 228Th line source inserted into a helical calibration
track surrounding the cryostat was used for energy cal-ibration. Multiple calibration periods were interspersed between background data collection to track and account for long-term drift in gain. Statistically significant peaks in the228Th decay chain energy spectrum were used to
calibrate the energy spectra of each detector indepen-dently. To extend our calibration to lower energies, we included the measured baseline noise as the zero point energy in the fit. For an overview of the calibration sys-tem, see [23].
We combined the calibration spectra from the 13 de-tectors, and summed a total of 102.8 hours of calibration data over all of the calibration periods. The resulting high statistics spectrum permitted peaks from Bixrays and from Th and Pb gamma rays. These were used to help quantify biases and uncertainties in the energy scale below 120 keV. A small systematic offset in the energy scale (ES) of∼0.2 keV from known peak energies was
ob-served in this region. The offset is consistent with resid-ual digitizer nonlinearity effects, which were estimated by comparing energy measurements from low-gain and high-gain channels. A linear correction (∆E),
∆E(ES) =αE(ES−95.0 keV) +E0, (2)
was applied to mitigate the offset. The parametersαE= −0.0014±0.0008 andE0=−0.256±0.016 keV were
de-termined by fitting a line to the peak-centroid offset val-ues of the low-statistics peaks between 70 and 120 keV. The correlation coefficient was corr(αE, E0) = −0.22.
The correction was then extrapolated to lower energies. As a check, the predicted offset at 10.36 keV, the68Ge
cosmogenic K-shell cascade peak, was computed and found to be−0.12±0.07 keV. In the natural detectors, this peak was measured at 10.22 keV, and is consistent with the correction model prediction in Eq. 2 to within the parameter uncertainties. We are improving our non-linearity correction and expect to remove this offset in future analyses.
A multipeak fitting routine was applied to the summed
228Th calibration spectrum to determine the energy
de-pendent widths (σ) of peaks in the 1–260 keV energy range. The widths were fit to
σE(E) =
q
σ2
0+hεiF E , (3)
with resulting fit values of σ0 = 0.16±0.04 keV and
F= 0.11±0.02. The fit parameters were fully correlated, corr(σ0, F) ∼ 1. The constant hεi = 2.96 eV, is the
average energy required to produce an electron-hole pair in Ge.
Limits on pseudoscalar dark matter axioelectric cou-pling were calculated using a method similar to [24]. For comparison with other experiments, we set the Milky Way halo density toρDM = 0.3 GeV cm−3 [25] and
as-sumed that pseudoscalar DM constitutes the total den-sity. The expected number of detected counts,dN/dEat energyE, assuming a pseudoscalar mass ofmA in keV,
is given by [24, 26]
dN
dE(E;mA) = ΦDM(mA)σAe(mA)
η(E)√ 1
2πσE(mA)
exp
−(E−mA) 2
2σ2 E(mA)
M T , (4)
ΦDM =ρDM
vA
mA
= 7.8×10⁻⁴
1
mA
·β[/barn/day],
(5)
σAe(mA) =σpe(mA)
g2
Ae
β 3m2
A
16παm2 e
1−β
2 3
3
!
. (6)
whereβ=vA/cis the average DM velocity with respect
to the earth, ΦDMis the average DM flux at Earth,σAe
is the axioelectric cross section as a function of energy, σE is the energy resolution atE=mA (given by Eq. 3),
M Tis the exposure of the detectors used in this analysis, andη(E) is theT /Ecut acceptance function (Eq. 1). In Eq. 6, σpe is the photoelectric cross section in Ge [27].
In this analysis, the peak energy of interest is the pseu-doscalar mass (mA). We takeβ= 0.001 [24, 28], roughly
(keV)
A
m
10 102
Ae
g
13
− 10
12
− 10
11
−
10 EDELWEISS
XENON100
XMASS MAJORANA
CDEX
XENON100*
LUX
FIG. 2. The 90% UL on the pseudoscalar axionlike particle dark mater coupling from the Majorana Demonstrator
(red) compared to EDELWEISS [24] (orange), XMASS [33] (dark green), and XENON [28] (blue). XENON has recently published an erratum [34] (dashed blue). Results by LUX (dashed, light green) have not yet been published [35], and new results from CDEX (dashed, black) are available in [32].
We place an upper limit on the pseudoscalar dark mat-ter coupling constant, gAe, at multiple mA values
be-tween 5 and 100 keV using an unbinned profile likelihood method [29–31]. The likelihood function incorporates a DM signal probability density function that is modeled separately with Eq. 4 for each individualmAvalue, a
lin-ear background, the tritium spectrum and a 10.36 keV cosmogenic x-ray peak. A multidimensional Gaussian penalty term floats the nuisance parameters (αE,E0,σE,
andη) in the likelihood function according to their covari-ance matrices. The penalty term affects the final limit by a few percent at most. The best fit to the background model is shown in Fig. 1.
A comparison of ourgAe-limits, as a function of
pseu-doscalar mass, to previous results is shown in Fig. 2. Our limits are an improvement over other germanium ex-periments, EDELWEISS [24] and CDEX [32], especially for mA < 18.6 keV due to the low cosmogenic
activ-ity in Majoranaenriched detectors. The XMASS [33]
experiment has the best limits for mA > 40 keV. Two
XENON limits are shown: the original published in [28] (solid), and a correction from an erratum [34] (dashed). Preliminary LUX results [35] are comparable to the re-vised XENON results. Currently the xenon experiments XMASS, XENON, and LUX report the best limits due to the>10×larger exposure of their fiducial mass.
Using the same data and analysis technique with a Gaussian modeled signal, we also set limits on the elec-tronic coupling of vector bosonic DM [12]. The
interac-tion rate for vector DM is
ΦDM(mV)σV e(mV) =
4×10²³
mV
α′
α
σ
pe(mV)
A [/kg/d],
(7) whereAis the atomic mass of Ge,mV is the vector
bo-son mass in keV, andα′ is the coupling of vector DM to
electrons, analogous to the electromagnetic fine structure constant, α. The expected number of detector counts at energyE is found by replacing the axioelectric inter-action rate in Eq. 4 with the vector-electric rate, with mV substituted for mA. Limits on the vector coupling
from the unbinned likelihood analysis described above are shown in Fig. 3. In the case of vector DM, the exper-imental constraints are more stringent than astrophysical limits, except for red giant (RG) stars.
(keV)
V
m
0 20 40 60 80 100
)
α
’/
α
log(
30
−
28
−
26
−
24
−
22
−
20
−
18
−
16
−
14
−
HB Stars BG
γ
Abundance
XMASS
MAJORANA
RG Stars Xe(An)
FIG. 3. The 90% UL on the vector particle dark matter cou-pling from the MajoranaDemonstrator(red) compared to
the astrophysical limits (dashed) from the gamma background (orange), the observed dark matter abundance (black), hor-izontal branch stars (blue), and RG stars (maroon) [12, 36]. Experimental results (solid) from XMASS [33] (green) along with a 2σ limit computed from XENON100 [28] data by H. Anetal.[14] are also shown.
In addition to generic pseudoscalar and vector DM, we analyzed our sensitivity to solar axions. 57Fe has a large
solar abundance and its first excited state at 14.4 keV is thermally excited within the Sun’s interior. Axion emis-sion is possible from the decay of this state [37]. Electric coupling of these axions to atomic electrons in the detec-tor would manifest as a peak at 14.4 keV. No such peak was observed in Majorana, and a limit on the
prod-uct of the effective axionuclear coupling, geff
AN, of solar
axions (see [38]) and the axioelectric coupling,gAe, was
determined. Replacing the flux in Eq. 5 with [24]
Φ14.4=β3×4.56×1023(geffAN)
2[/cm2/s], (8)
and substitutingmA in Eq. 4 with 14.4 keV, we use the
coupling constant. Since this is a monoenergetic transi-tion, the reduced axion velocity,β, depends on the mass of the axion, which can range from 0 to 14.4 keV. In the low mass limit where β → 1, we find a 90% UL of
geff
AN×gAe<3.8×10⁻¹⁷. A comparison of the Majorana
and EDELWEISS coupling limits is shown in Fig. 4.
Axion Mass (keV)
0 2 4 6 8 10 12 14
eff AN
g
×
Ae
g
17
− 10
16
− 10
15
− 10
EDELWEISS
MAJORANA
FIG. 4. The 90% UL coupling of 14.4-keV solar axions from the Majorana Demonstrator (red) data compared with
the limit set by EDELWEISS (orange). The product of the axionuclear coupling in the sun and the axioelectric coupling in the detector is shown. Comparative astrophysical limits assuminggeff
AN follows the DFSZ model is shown in Ref. [24].
Two other non-DM related rare-event searches were carried out using the low energy data and analysis, a Pauli exclusion violating decay, and an electron decay search. While the Pauli exclusion principle is a fun-damental law of nature, its physical origin is still not fully understood [39–44]. Majorana searched for the
PEPV transition of anL-shell Ge electron to theKshell that would manifest as a 10.6 keV [43] shoulder on the 10.36 keV 68Ge peak. Using the unbinned likelihood
method with a generic signal plus background model, we set a 90% C.L. on the excess signal rate of 0.03 /kg/d. This equates to a lifetime τ >2.0×1031 s. Comparing
to the 1.7×10⁻¹⁶ s lifetime of a standardK
αtransition
in Ge, one derives an upper limit on the PEPV param-eter 1
2βˆ
2 <8.5×10−48, a∼35% improvement over the
previous limit [45].
Our data can also be used to set a limit on the de-cay of the electron. Charge conservation arises from an exact gauge symmetry of quantum electrodynamics with the associated gauge boson being exactly massless. Even so, the possibility of its violation has been theoretically explored [46–52]. For example, the charge-conservation violating process e− → ννν¯ produces an atomic-shell
hole. If an electron disappears from the K shell of a Ge atom, resulting atomic emissions deposits 11.1 keV of energy within the detector. We search for events of
this characteristic energy as possible indications of elec-tron decay using a similar analysis as for the PEPV and solar axion search. We determined a lifetime limit of >1.2×1024 yr. The best limit on the lifetime for this
process is>2.4×1024 yr (90% CL) [53].
We found no indication of new physics that would man-ifest as a peak in the energy spectrum of the Module 1 commissioning data presented in this Letter. Upgrades to Majorana, detector repairs, and the addition of
Mod-ule 2 will significantly improve the sensitivity to new physics. Lower background rates in subsequent data sets have already been observed with the installation of the inner electroformed copper and additional polyethylene neutron shielding. Analysis thresholds below 5 keV will allow us to constrain additional processes including light-WIMP scattering.
This material is based upon work supported by the U.S. Department of Energy, Office of Science, Office of Nuclear Physics under Award Numbers DE-AC02-05CH11231, DE-AC52-06NA25396, DE-FG02-97ER41041, DE-FG02-97ER41033, DE-FG02-97ER41042, de-sc0012612, DE-FG02-10ER41715, de-sc0010254, and DE-FG02-97ER41020. We acknowl-edge support from the Particle Astrophysics Program and Nuclear Physics Program of the National Science Foundation through grant numbers PHY-0919270, PHY-1003940, 0855314, PHY-1202950, MRI 0923142 and 1003399. We acknowledge support from the Russian Foundation for Basic Research, grant No. 15-02-02919. We acknowledge the support of the U.S. Department of Energy through the Los Alamos National Lab/Laboratory Directed Research and Development Program. This research used resources of the Oak Ridge Leadership Computing Facility, which is a DOE Office of Science User Facility supported under Contract DE-AC05-00OR22725. This research used resources of the National Energy Research Scientific Computing Center, a DOE Office of Science User Facility supported under Contract No. DE-AC02-05CH11231. We thank our hosts and colleagues at the Sanford Underground Research Facility for their support.
∗ Alternate address: Department of Nuclear Engineering,
University of California, Berkeley, CA, USA
† Corresponding author. Email: [email protected]
[1] N. Abgrall et al., Advances in High Energy Physics, 2014, 1 (2014).
[2] J. Heise, J. Phys. Conf. Ser., 606, 012015 (2015), arXiv:1503.01112.
[3] P. N. Luke, F. S. Goulding, N. W. Madden, and R. H. Pehl, IEEE Trans. on Nucl. Sci.,36, 926 (1989). [4] P. S. Barbeau, J. I. Collar, and O. Tench,
JCAP,09, 009 (2007).
Yocum, Nucl. Instrum. Meth. A,629, 303 (2011), ISSN 0168-9002.
[6] G. Giovanetti et al., Phys. Proc., 61, 77 (2015), ISSN 1875-3892.
[7] C. E. Aalsethet al., (2014), arXiv:1401.3295.
[8] W. Zhao et al., Phys. Rev. D, 88, 052004 (2013), arXiv:1306.4135.
[9] H. V. Klapdor-Kleingrothaus, A. Dietz, H. L. Harney, and I. V. Krivosheina, Mod. Phys. Lett., A16, 2409 (2001), arXiv:hep-ph/0201231 [hep-ph].
[10] C. E. Aalsethet al., Phys. Rev. D,65, 092007 (2002). [11] K.-H. Ackermannet al., The European Physical Journal
C,73, 2330 (2013), ISSN 1434-6052.
[12] M. Pospelov, A. Ritz, and M. Voloshin, Phys. Rev. D, 78, 115012 (2008).
[13] J. Redondo and M. Postma, J. Cosm. Astropart. Phys., 2, 5 (2009).
[14] H. An, M. Pospelov, J. Pradler, and A. Ritz, Physics Letters B,747, 331 (2015), ISSN 0370-2693.
[15] N. Abgrall et al., Nucl. Instrum. Meth. A, 828, 22 (2016).
[16] N. Abgrall et al. (Majorana), (2016),
arXiv:1602.07742 [nucl-ex].
[17] ORTEC, 801 South Illinois Avenue Oak Ridge, TN 37830, USA.
[18] M. A. Howe, G. A. Cox, P. J. Harvey, F. McGirt, K. Rielage, J. F. Wilkerson, and J. M. Wouters, IEEE Trans. Nucl. Sci.,51, 878 (2004).
[19] P. Barton, P. Luke, M. Amman, Y.-D. Chan, J. Detwiler, J. Loach, R. Martin, A. Poon, C. Tindall, and K. Vetter, in Proceedings, 2011 IEEE Nuclear Science Symposium and Medical Imaging Conference (NSS/MIC 2011): Va-lencia, Spain, October 23-29, 2011(2011) pp. 1976–1979. [20] S. Paschalis et al., Nucl. Instrum. Meth. A, 709, 44
(2013), ISSN 0168-9002.
[21] E. Aguayo et al., Nucl. Instrum. Meth. A, 701, 176 (2013).
[22] Except for use in theT /E parameter, the actual calcu-lated energy is the filtered value at a fixed time of 6µs after the start of the rising edge, identified using a sec-ond trapezoidal filter with a 1µs ramp time and∼1 keV
threshold. The energy scale is also subject to a digitizer non-linearity correction.
[23] N. Abgrall et al., (2017), arXiv:1702.02466 [physics.ins-det].
[24] E. Armengaudet al., JCAP,11, 067 (2013).
[25] Recent results suggest that the local density is closer to 0.4 GeV cm−3
. See Ref. [54].
[26] F. Alessandria et al., JCAP, 05, 007 (2013), arXiv:1209.2800.
[27] “NIST Physical Meas. Laboratory,”
http://physics.nist.gov/PhysRefData/Xcom/html/xcom1.html
(2016), last checked 3/14/16.
[28] E. Aprileet al., Phys. Rev. D,90, 062009 (2014). [29] S. S. Wilks, Ann. Math. Statist.,9, 60 (1938).
[30] W. A. Rolke, A. M. L´opez, and J. Conrad, Nuclear In-struments and Methods in Physics Research A,551, 493 (2005).
[31] F. James, Statistical Methods in Experimental Physics
(World Scientific Publishing, 2006) ISBN 9789812705273. [32] S. K. Liuet al., (2016), arXiv:1610.07521 [hep-ex]. [33] K. Abeet al., Phys. Rev. Lett.,113, 121301 (2014). [34] E. Aprileet al., Phys. Rev. D,95, 029904 (2017). [35] “IDM2016 Identification of Dark Matter 2016,”
https://idm2016.shef.ac.uk/ (2016), last checked
10/10/16.
[36] R. Essiget al., inProceedings, Community Summer Study 2013: Snowmass
(2013) arXiv:1311.0029 [hep-ph].
[37] S. Moriyama, Phys. Rev. Lett.,75, 3222 (1995). [38] S. Andriamonjeet al., JCAP,12, 002 (2009).
[39] A. Y. Ignatiev and V. A. Kuzmin, Sov. J. Nucl. Phys., 461, 786 (1987).
[40] O. W. Greenberg and R. N. Mohapatra, Phys. Rev. Lett., 59, 2507 (1987).
[41] O. W. Greenberg, Phys. Rev. D,43, 4111 (1991). [42] O. W. Greenberg, AIP Conf. Proc.,545, 113 (2000). [43] S. R. Elliott, B. H. LaRoque, V. M. Gehman, M. F. Kidd,
and M. Chen, Found. Phys.,42, 1015 (2012), ISSN 1572-9516.
[44] N. Abgrallet al., The European Physical Journal C,76, 619 (2016), ISSN 1434-6052.
[45] R. Bernabeiet al., Eur. Phys. J. C,62, 327 (2009), ISSN 1434-6052.
[46] L. B. Okun and Y. B. Zeldovich, Phys. Lett. B,78, 597 (1978).
[47] M. B. Voloshin and L. B. Okun, JETP Lett., 28, 145 (1978).
[48] A. Ignatiev, V. Kuzmin, and Shaposhnikov, Phys. Lett. B,84, 315 (1978).
[49] R. N. Mohapatra, Phys. Rev. Lett.,59, 1510 (1987). [50] L. B. Okun, Sov. Phys. Usp.,32, 543 (1989).
[51] R. N. Mohapatra and S. Nussinov, International Journal of Modern Physics A,7, 3817 (1992).
[52] A. Y. Ignatiev and G. Joshi, Phys Lett B, 381, 216 (1996).
[53] P. Belliet al., Phys. Lett. B,460, 236 (1999).
![FIG. 2. The 90% UL on the pseudoscalar axionlike particle dark mater coupling from the Majorana Demonstrator (red) compared to EDELWEISS [24] (orange), XMASS [33]](https://thumb-us.123doks.com/thumbv2/123dok_us/8274125.2191315/4.918.88.421.97.348/pseudoscalar-axionlike-particle-coupling-majorana-demonstrator-compared-edelweiss.webp)

