ARFI-Monitored Hemostatic Challenge for Assessment of In Vivo Hemostasis in Canine Models of Inherited Bleeding Disorders
Leslie M. Baggesen
A thesis submitted to the faculty of the University of North Carolina at Chapel Hill in partial fulfillment of the requirements for the degree of Master of Science in the
Department of Biomedical Engineering
Chapel Hill 2012
Approved by:
ii
Abstract
LESLIE M. BAGGESEN: ARFI-Monitored Hemostatic
Challenge for Assessment of In Vivo Hemostasis in Canine Models of Inherited Bleeding Disorders
(Under the direction of Caterina M. Gallippi, Ph.D.)
The need for a validated in vivo assay to test the efficacy and safety of therapeutic agents for hemostatic disorders is paramount as new clotting factor replacement therapies are developed. Current hemostatic assays are almost exclusively ex vivo. Conventional in vivo assays are limited in application to relevant animal models, and suffer from a lack of reproducibility. This thesis demonstrates that Acoustic Radiation Force Impulse -
Monitored Hemostatic Challenge (ARFI-MHC) may be an alternative in vivo assay for the measurement of hemostatic metrics. Time to hemostasis (TTH) and rate of
hemorrhage (RH) were measured in dogs for six hemostatic phenotypes. Two algorithms were compared for TTH and RH measurements with spatial clustering for noise
iii
Acknowledgements
I would like to thank my family for encouraging me to be my very best. Your endless support has allowed me to be confident in who I am and what I do.
Thank you to the entire staff at the Francis Owen Blood Research Laboratory, without whom this research would not have been possible. I would like to specifically thank Timothy Nichols, Vickie Hamlett, and John Nowicki for their countless hours spent in experiments and for convincing me to get a dog. Thank you to Melissa Caughey for your amazing vessel locating skills.
An additional thank-you goes out to Chih-Da Wu and Hongtu Zhu for their statistical expertise.
I would also like to thank Mallory Scola for her substantial effort in getting this project off of the ground.
iv
Table of Contents
List of Tables ... vi
List of Figures ... 1
1 Introduction ... 1
2 Hemostatic Disorders and Technological Innovation ... 4
2.1Motivation for Technology Development ... 4
2.1.1 Need for Validated In Vivo Hemostasis Assay ... 4
2.1.2 Hemostatic Disorders and Current Therapies ... 5
2.1.3 Current Methods for Assessing Hemostasis – Ex Vivo and In Vivo Technologies ... 9
2.2In Vivo Diagnostics – Ultrasonic Imaging ... 10
2.2.1 Ultrasonic Imaging Principles ...10
2.2.2 Elastography ...12
2.2.3 Acoustic Radiation Force Impulse Ultasound ...13
2.3Hemorrhage Detection Using ARFI Techniques ... 15
2.3.1 Impact of Hemorrhage on ARFI Measured Displacement and Correlation ...16
2.3.2 Methods for Identifying Hemorrhage Using ARFI Ultrasound...19
3 Optimization of Measurements from ARFI Monitored Hemostatic Challenge ... 23
3.1Imaging Parameters and Methods ... 23
v
3.2.1 Discrete, Non-Overlapping Windows ...31
3.2.2 Sliding Window ...33
3.3Calculation of Time to Hemostasis ... 36
3.3.1 Time to Hemostasis Based on Measured Hemorrhagic Area ...36
3.3.2 Time to Hemostasis Based on Rate of Hemorrhage ...37
3.4Spatial Clustering to Remove Noise ... 39
4 In Vivo Implementation of ARFI Monitored Hemostatic Challenge ... 44
4.1Effect of Bleeding Phenotype on Time to Hemostasis and Rate of Hemorrhage ... 44
4.2Reproducibility of Time to Hemostasis and Rate of Hemorrhage Measurements ... 47
4.2.1 Reproducibility after Multiple Imaging Sessions ...47
4.2.2 Within Dog Reproducibility ...51
4.3Gene Therapy in Dogs ... 54
5 Validation of ARFI Monitored Hemostatic Challenge Derived Metrics ... 58
5.1Autologous Infusion Protocol for Validation Studies ... 58
5.2Future Modifications to Validation Methods ... 66
6 Conclusions and Future Directions ... 69
6.1New Technology for ARFI Monitored Hemostatic Challenge ... 69
6.2Clinical and Pre-Clinical Applications ... 71
vi
List of Tables
3.1: Detailed breakdown of bleeding phenotypes imaged in these studies, the number of dogs imaged in each phenotype,
and the number of imaging sessions for each dog.. ... 26 4.1: Previously reported rate of hemorrhage and time to
hemostasis measurements for each bleeding phenotype
reported as mean ± standard deviation.. ... 45 4.2: Rate of hemorrhage and time to hemostasis
measurements for each bleeding phenotype reported
as mean ± standard deviation. ... 46 4.3: Reproducibility of primary and secondary cuticle and
saline bleeding measures in 6 normal, 8 naïve hemophilia A,
8 hemophilia A with infused FVIII, and 6 naïve VWD dogs.. ... 51 4.4: Reproducibility of TTH and RH calculated using the
Maximum Method in 6 normal, 8 naïve hemophilia A, 8 hemophilia A with infused FVIII, and 4 naïve hemophilia
A expressing cFVIIa. ... 52 4.5: Reproducibility of TTH and RH calculated using the
Rate Method in 6 normal, 8 naïve hemophilia A, 8 hemophilia
1
List of Figures
Figure 2.1: General method for ARFI Imaging.. ... 15
Figure 2.2: Correlation values measured in soft tissue and
hemorrhage over ARFI observation period.. ... 18
Figure 2.3: Method of hemorrhage detection using acoustic radiation force impulse (ARFI) Monitored Hemostatic
Challenge. ... 21
Figure 2.4: Resulting normalized area vs. time plot for ARFI
Monitored Hemostatic Challenge... ... 22
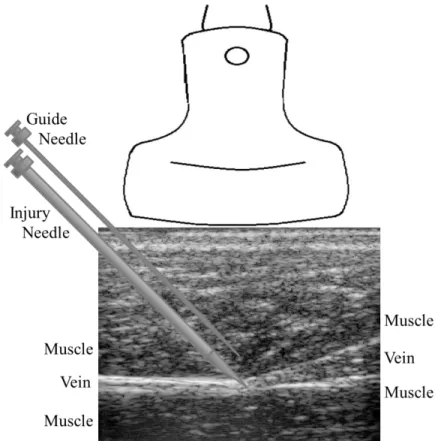
Figure 3.1: Placement of the imaging transducer and needles
during ARFI monitored hemostatic challenge. ... 25
Figure 3.2: ARFI beam sequence acquired in 40 lateral locations
spanning a 2.1 cm lateral field of view.. ... 27
Figure 3.3: Comparison between hemorrhage detection with
different beam sequences. ... 29
Figure 3.4: Typical normalized hemorrhagic area vs. time plots for five bleeding phenotypes investigated here: normal (a), naïve hemophilia A treated with infused cFVIII after 30 minutes (b), naïve hemophilia A
expressing cFVIIa (c), naïve VWD (d), VWD + VWF (e). ... 30
Figure 3.5: First algorithm for the measurement of the rate of
hemorrhage in a representative normal dog.. ... 32
Figure 3.6: Bleeding profile for a dog with naïve Hemophilia
A expressing cFVIIa at 1.5 μg/ml. ... 33
Figure 3.7: Measured hemorrhagic area vs. time plots for a
representative normal dog. ... 35
Figure 3.8: Rate of hemorrhage vs. time calculated for the
bleeding profiles in Figure 3.7. ... 35
Figure 3.9: Time to hemostasis as measured using the time to 75% of the maximum measured hemorrhagic
area in a representative normal dog. ... 37
Figure 3.10: Measured hemorrhagic area (left) and calculated rate of hemorrhage (right) from a single hemophilia
2
Figure 3.11: Determination of lower and upper threshold
values for hemorrhage detection. ... 41
Figure 3.12: Spatial clustering technique to remove falsely identified hemorrhagic pixels from within and
below the vessel lumen. ... 43
Figure 3.13: Application of the spatial clustering technique to remove falsely identified hemorrhagic pixels
from within and below the vessel lumen. ... 43
Figure 4.1: Reproducibility of Rate of Hemorrhage and Time
to Hemostasis calculated using the Maximum Method. ... 48
Figure 4.2: Reproducibility of Rate of Hemorrhage and Time
to Hemostasis calculated using the Rate Method... 49
Figure 4.3: Area of hemorrhage and rate of hemorrhage vs. time plots for a single FVIII deficient dog before (top) and after (bottom) gene therapy to express
canine FVIIa. ... 56
Figure 4.4: Measured hemorrhagic area vs. time in a FVII
deficient dog.. ... 57
Figure 4.5: Rate of hemorrhage calculated from the data
presented in Figure 4.4. ... 57
Figure 5.1: Lateral placement of needle in initial validation studies. ... 61
Figure 5.2: Elevational placement of needle in initial validation studies ... 61
Figure 5.3: Measured blood area vs. time and associated rate measurements calculated using the Rate
Method for validation of ARFI Hemostatic Challenge. ... 66
Figure 5.4: Hybrid B-mode/ARFI images showing a volume
of blood mimic enclosed inside of a tissue phantom. ... 68
Figure 5.5: Hybrid B-mode/ARFI volumetric image of blood mimic
Chapter 1
Introduction
A validated method for determining the onset of hemostasis in vivo is necessary for developing effective therapeutic agents for patients with bleeding disorders such as hemophilia A and von Willebrand’s disease (VWD). This thesis will present a novel method of in vivo hemostasis assessment, Acoustic Radiation Force Impulse (ARFI)-Monitored Hemostatic Challenge. Chapter 2.1 describes current methods for assessing hemorrhage in animal models and in the clinic. Weaknesses of these methods, such as high variance between measurements, have driven the development of ARFI-based techniques. A background of ultrasonic and elastographic imaging is presented in Chapter 2.2. A discussion of the unique impact of blood on measured displacements in soft tissue for ARFI implementation for hemorrhage detection is contained in Chapter 2.3.
Rate of hemorrhage and time to hemostasis are important metrics that ARFI is able to derive from visualized hemorrhage over time. Chapter 3 presents technical
2
in Chapter 3.2 with associated in vivo results. A robust method for the removal of noise as discussed in Chapter 3.3. Accurate TTH and RH measurements without corruption from physiological noise allow for assessment of hemostasis in vivo, which may provide valuable information about efficacy of therapeutics.
In vivo implementation of RH and TTH measurements in a canine model of hemophilia is presented in Chapter 4. Dogs are an ideal large animal model for ARFI Monitored Hemostatic Challenge due to similarities between bleeding phenotypes in healthy dogs, dogs with hemophilia A and von Willebrand’s Disease, and their human
counterparts. The reproducibility of the imaging protocol and associated measurements are examined across groups after separate imaging events and within each dog. Initial results after inducing the expression of canine Factor VIIa (cFVIIa) are presented, as are results from a FVII deficient dog in Chapter 4.3.
Validation of this hemostatic challenge is described in Chapter 5. There are no comparable in vivo hemostasis assays to verify that ARFI derived TTH and RH accurately reflect the behavior of each dog after injury. Moreover, it is necessary to validate this protocol before translating this research into a clinical setting. Known volumes of citrated blood injected into muscle tissue over known times during serial ARFI imaging may be a viable validation technique for ARFI derived hemostasis measurements. In-depth protocols are presented, along with difficulties encountered in accurately validating rate of hemorrhage and time to hemostasis measurements. Future modifications to the protocol are discussed.
pre-3
clinical implementations. Future research is necessary to bring ARFI Monitored
Chapter 2
Hemostatic Disorders and Technological Innovation
2.1 Motivation for Technology Development
2.1.1 Need for Validated In Vivo Hemostasis Assay
There exists a need for a validated in vivo hemostasis assay to test the efficacy and safety of therapeutic agents for inherited and acquired bleeding disorders. Inherited bleeding disorders are caused by the absence of certain plasma coagulation proteins, such as missing or deficient Factor VIII (FVIII) in hemophilia A and von Willebrand’s factor (VWF) in von Willebrand’s disease (VWD). Clotting factor replacement products can be introduced through intravenous infusion to reduce bleeding events [1–4]. Regular
5
individuals to undergo costly and time-consuming infusion procedures either in the home or in the clinic; frequent prophylactic use is directly correlated with a decrease in
bleeding episodes that require treatment [8], [10]. Although these individuals may have reduced frequency of hemorrhage, there is still significant time, cost and energy required to maintain hemostatic normalcy. The most serious complication in hemostatic disorder management is the development of neutralizing antibodies to therapeutic clotting factors [11]. Immune responses can render the most effective therapeutics useless due to
dangerous reactions [2], [10]. Complications and cost associated with current on-demand and prophylactic therapies have driven the development of new therapeutic agents. There exists a need for a validated in vivo hemostasis assay to test the efficacy and safety of new therapeutic agents for inherited and acquired bleeding disorders as they are
developed. The ability to determine early bleeding, the formation of clots, and sustained hemostasis is necessary to demonstrate the direct effect therapeutics may have on individual bleeding events and overall hemostatic maintenance.
2.1.2 Hemostatic Disorders and Current Therapies
Inherited bleeding disorders such as Hemophilia A and von Willebrand’s Disease
6
times more patients than hemophilia B [13]. Von Willebrand’s Disease occurs about twice as frequently as hemophilia B [13].
Acquired bleeding disorders typically arise after antithrombotic or antiplatelet therapies such as Coumadin or aspirin. In very rare cases, acquired hemophilia A occurs when individuals develop antibodies to intrinsic FVIII, resulting in FVIII deficiency due to neutralization of the clotting factor [14], [15]. Von Willebrand’s Disease can also be acquired, resulting in decreased functionality of VWF [16]. Both acquired hemophilia A and VWD are usually associated with additional complications, such as autoimmune disease and the use of certain pharmaceuticals. The development of therapeutics, particularly for acquired hemophilia A, is driven by the same need that exists in the inherited bleeding disorders community; reduction of cost and increased efficacy and safety of therapeutics are necessary for improved quality of life in these individuals. Certain therapeutics, such as recombinant FVIIa, are utilized for both acquired and inherited bleeding disorders [6], [12], [15], [17], [18]. Overlap in treatments for acquired and inherited bleeding disorders renders animal models of inherited bleeding disorders relevant for the development of therapeutics that function globally for all hemostatically abnormal patients.
Patients with severe bleeding disorders used to suffer from a reduced quality of life. Complications from bleeding disorders included frequent bleeding episodes,
7
became widely available in the United States in the 1960s; however early concentrates were not used for home-care until the 1970s [1]. At this time, increased access to coagulation factor replacements was associated with increased risk of transmission of disease. Through the 1980s the transmission of hepatitis and HIV decreased quality of life and life expectancy for hemophiliacs; in the early 1980s 60-70% of all hemophiliacs in Western Europe and the US became infected with HIV from plasma concentrates [1], [20]. Modern advances in purification of replacement coagulation factors have reduced the risk of viral infection through infusions. However, current factor replacement therapies are not perfect; immune reactions to introduced clotting factors are a large problem for a significant portion of patients with clotting disorders.
The continued development of prophylactic and on-demand therapies is driven by the need for highly effective and globally safe treatments for hemostatic disorders. The development of antibodies against clotting factors can render common therapies ineffective in a significant percentage of hemostatically deficient individuals.
Alloantibodies develop in individuals with congenital and acquired hemostatic disorders; they neutralize introduced clotting factors, leading to continued hemostatic dysfunction after treatment along with severe inflammatory reactions [15], [19], [21], [22].
8
of circulating FVIII prior to hemostatic therapies[24]. After alloantibodies develop, the morbidity and mortality associated with hemophilia worsens [22], [25]. This percentage of the patient population is in dire need of treatments that are capable of bypassing immune responses without severe immunosuppression therapies.
The developments of recombinant coagulation factors as well as gene therapy are promising new therapeutics for individuals with bleeding disorders and inhibitor
formation. On-demand use of clotting factors, such as FVIII, is the first line of treatment against acute hemorrhage for most individuals with clotting disorders. Recombinant clotting factors as well as immune tolerance therapies are able to bypass FVIII
9
accessible treatment regimens through expansion of gene therapy into the clinic and the development of recombinant factors with extended half-lives [6].
2.1.3 Current Methods for Assessing Hemostasis – Ex Vivo and In Vivo
Technologies
There is a range of methods to used determine an individual’s bleeding
phenotype. Coagulation factor and thrombosis assays are able to aid in measuring vital characteristics of hemostasis, but are unable to provide in vivo measurements.
Coagulation factor assays include aPTT, two stage, and chromogenic assays, which can be used to diagnose hemophilia A and monitor treatment efficacy; however, these assays may not fully describe bleeding phenotype or accurately reflect patient response to FVIII treatment and cannot be performed in vivo [28]. Whole blood assays include whole blood clotting time (WBCT) and thromboelastography [29]. Thromboelastography is capable of determining the onset of clot formation and strength of the clot over time, but is an ex vivo procedure requiring highly specific equipment and training [30]. Whole blood thrombin generation can be monitored with thrombogram-based assays ex vivo [31]. Although these assays are important in diagnosing deficiencies of coagulation factors, correlation between such assays and clinical outcome is minimal, thus driving the need for a validated assay to assess treatment efficacy and hemostatic status [32],[33].
10
time (2°CBT) in dogs with hemophilia A [34]. Primary and secondary bleeding times suffer from a lack of reproducibility, described in later chapters.
Additional studies in small animal models, such as rabbits and mice, have used clinical coagulation factor assays [35], enzymatic assays to assess the efficacy of hemostatic therapies, cuticle bleeding times [36], thromboelastography [37–39], flow-based assays [40], and tail transection bleeding time [35]. Each of the small animal hemostatic assays is exclusively ex vivo with the exception of cuticle and tail transection bleeding times. Many suffer from the same reproducibility problems as 1°CBT, 2°CBT, and 1°SBT in dogs. Coagulation has also been measured using ultrasonic means,
typically based on Doppler signal intensity changes, attenuation, and integrated backscatter [41–44]. These methods are also exclusively ex-vivo.
2.2 In Vivo Diagnostics – Ultrasonic Imaging
2.2.1 Ultrasonic Imaging Principles
Ultrasonic (US) imaging is a non-ionizing, non-invasive diagnostic imaging technique that is capable of visualizing underlying tissue morphology in real time, and with minimum discomfort for patients. Unlike other imaging modalities such as computed tomography (CT), ultrasonic imaging is free from ionizing radiation. US imaging systems are able to be wheeled directly to the patient’s bedside for on-demand imaging and diagnostics. Given these benefits, the applications for US imaging are widespread, from fetal to vascular imaging.
11
reflect off of regions of acoustic impedance mismatch, typically at tissue boundaries. As longitudinal waves generated by ultrasonic excitation pass through regions of differing acoustic impedance, a portion of the incident wave reflects at the boundary while the rest continues to propagate deeper into the tissue. The reflected wave, or echo, relays
information about the location and shape of this boundary back to the imaging system, which is able to translate such information into real-time images. Information about the depth of the boundary is determined based on the assumed speed of sound in soft tissue of 1540 m/s and the time required to receive each echo back at the transducer face. Resolution of the resulting image is dependent upon the characteristics of the imaging probe and the emitted ultrasonic beam.
The type of information relayed to clinicians using ultrasonic imaging varies based on the diagnostic imaging configuration utilized for differing applications. A-mode, or amplitude A-mode, scans a single lateral region in the body and displays echoes as a function of depth. This particular ultrasound modality is useful for obtaining positional information with minimum computational requirements [45]. Brightness (B) mode creates two-dimensional (2D) images of tissue structures. These images are axial cross sections of the region being imaged created by modulating the brightness of the displayed information based on the amplitude of received echoes. B-mode is used frequently in obstetric, cardiac, and abdominal imaging [45]. M-mode, or motion-mode, collects
information about axial displacements that vary over time, such as the motion observed in heart valves. Successive A-mode acquisitions create a single M-mode image [45].
12
within the body; CW and pulsed Doppler measure the velocity of moving fluids, such as blood. The Doppler principle allows for the measurement of velocity due to a frequency shift measured in reflected waves that is proportional to the velocity of scatterers [45]. Each of these modalities provides clinically relevant information about the morphology of underlying tissue structures and boundaries as well as the movement of these
structures in normal and pathological physiologies. Other modalities of ultrasonic imaging are able to provide further information about underlying tissues, such as displaying the mechanical properties of tissues using elastography.
2.2.2 Elastography
Changes in the mechanical properties of tissue are highly dependent upon pathological features within the tissue structure [46–48]. Tumor growth, scar tissue formation, and other pathologies that result in the deposition of fibrotic tissue are stiffer than surrounding healthy tissues [48]. Physicians are able to manually determine the location of stiff lesions in tissues using palpation. However, there are several challenges to manual palpation, including localization of small or deep lesions that may not be discernible by touch. Additionally, manual palpation is highly operator dependent and qualitative in nature [49].
13
Elastography is able to supplement B-mode imaging by providing valuable data about changes in the mechanical properties of tissues [50–52].
Elastographic images are made using multiple techniques to induce mechanical changes in tissue that elucidate differences in tissue stiffness. Elastograms display the elasticity of tissues based on estimated strain as a result of applied stress. Tissue compression is achieved by externally applying force through the use of the imaging transducer itself or mechanical vibrators, or through internal methods such as cardiac pulsation or high intensity acoustic impulses [53]. Axial strain from pre- and post-compression images is measured using correlation-based techniques, such as cross-correlation or Kasai’s method [50], [51]. Comparison of successive A-lines renders
displacement measures over time, allowing elastography to track peak displacements as well as recovery characteristics.
2.2.3 Acoustic Radiation Force Impulse Ultrasound
Acoustic radiation force impulse (ARFI) ultrasound uses the properties of energy transfer to induce micrometer level displacements in underlying tissues. The transfer of momentum between introduced sound waves, as in ARFI imaging, and the medium through which these waves travel is capable of generating force on this medium [46]. This force is defined as,
Equation 2.1
where F (kg/(s2cm2)) is radiation force exerted on the medium, Wabsorbed (Watts/100cm3)
is the power absorbed by the medium, α (1/m) is the attenuation coefficient of the
14
through tissues in the body. Based on variations in the speed of sound and acoustic attenuation in tissues, Equation 2.1 relates the intensity of the acoustic field to the force applied. This applied force results in measurable displacements near the focal region. Recovery characteristics after displacement, as well as the magnitude of the displacement itself, are directly affected by the mechanical properties of underlying tissues. Additional metrics can be measured from the behavior of displaced tissue, as is discussed in later chapters.
Elastic properties of tissue can be directly measured by tracking the movement of shear waves after acoustic radiation force (ARF) excitation. Compressive waves, which propagate in the axial direction, are what induce measurable axial displacements in the region of excitation. However, energy transferred after ARFI excitation creates waves that also propagate lateral to induced axial displacements, known as shear waves. Shear wave velocity (SWV) is proportional to the shear modulus of tissues, as seen in Equation 2.2,
√ Equation 2.2
where SWV (m/s) is the shear wave velocity, µ (kPa) is the shear elastic modulus and ρ (g/m3) is the density of the tissue through which the wave propagates [54].
ARFI displacements are measured in the region of excitation [46]. The
15
subsequently track the resulting displacement and recovery profile of the tissue over time, creating a 2D matrix of displacement profiles (Figure 2.2). Parametric images are made from measurements of the peak displacement at each axial and lateral position over the 2D imaging field.
Figure 2.1: General method for ARFI Imaging. A high intensity acoustic impulse (red arrow) induces displacements in the region of excitation (blue dot). The tissue is allowed to recover, and characteristics such as peak displacement are measured.
ARFI ultrasound is well suited to the application of in vivo hemostasis
monitoring. Unlike conventional ultrasound, which is best suited for imaging underlying morphology but does not take into account changes in mechanical properties, ARFI is able to visualize localized regions of stiffening or softening that may be associated with hemorrhage. ARFI is also advantageous compared to transient elastography due to the behavior of fluids after ARFI excitation and after elastic deformation. Hemorrhage isolation using conventional elastography and ultrasound is complicated by intersecting frequency information and low amplitude signal from blood versus soft tissues [55], [56]. The behavior of hemorrhage after ARFI excitation is discussed further in Chapter 2.3.
2.3 Hemorrhage Detection Using ARFI Techniques
16
bleeding that may continue to occur after injury in individuals with inherited or acquired bleeding disorders [57]. This is typically due to clot formation at the skin surface while bleeding continues at the site of vascular injury below [58].
ARFI ultrasound is a viable alternative to visual inspection to determine the onset of hemostasis. Previous work has shown that ARFI ultrasound is capable of inducing streaming in human carotid arteries and fluid filled lesions [59], [60]. Sonorheometry measures blood coagulation times using ARF methods by measuring the mechanical properties of developing clots ex vivo [61]. ARFI specifically has been shown to be a relevant technique for monitoring the onset of hemostasis after cardiac catheterization of the femoral artery [62] and in canine models of hemophilia A and von Willebrand’s disease [34], [63]. This body of previous research supports further development of ARFI as a noninvasive tool to assess hemostasis in vivo.
2.3.1 Impact of Hemorrhage on ARFI Measured Displacement and Correlation
The presence of extravasated blood after injury to a vessel has distinguishable effects on ARFI induced displacements. Behler et al. [58] found that ARFI-induced peak displacements were larger in regions of pooled hemorrhagic blood in soft tissues than in surrounding soft tissues alone. Importantly, recovery characteristics in the hemorrhagic blood were highly decorrelated, suggesting that pooled blood did not elastically recover from ARFI-induced displacement.
17
Hemorrhage takes longer to recover, while luminal blood flows with cardiac pulsation. The authors demonstrated that due to this behavior, luminal blood decorrelated quickly relative to hemorrhagic blood, which decorrelated faster than soft tissue [64].
The decorrelation found in hemorrhagic and luminal blood is visible as regions of high variance toward the end of associated displacement profiles. Variance in the
displacement estimate, colloquially termed “jitter,” occurs with signal decorrelation in
ARFI displacement tracking measurements. Jitter is defined as:
√
( )[ ( ) ]
where fc is the center frequency of the imaging transducer, T is the kernel size used for
18
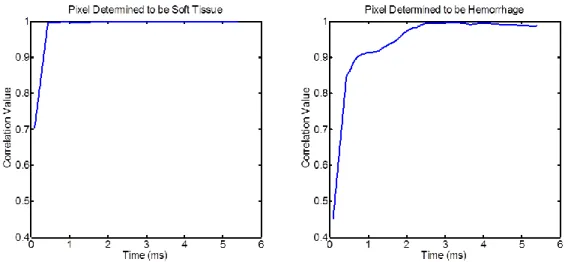
displacement measured in the hemorrhagic pixel is approximately ten times greater than in the soft tissue pixel.
Figure 2.2: Correlation values measured in soft tissue and hemorrhage over ARFI observation period. Note that the correlation in the hemorrhagic pixel is generally lower than the correlation in soft tissue. Additionally, the peak displacement measured in the hemorrhagic pixel was approximately 10 times larger than the peak displacement measured in the soft tissue.
Increased jitter in displacement tracking is evident after soft tissue has
presumably recovered from ARFI excitation after approximately 2 ms. Differences in the amount of displacement tracking error between soft tissues, pooled extravasated blood, and luminal blood displacements is amplified using a second derivative operator. Luminal blood is expected to have the highest displacement estimation variance after applying the second derivative operator, indicative of a high level of jitter in the
19
2.3.2 Methods for Identifying Hemorrhage Using ARFI Ultrasound
Building upon previously discussed effects of hemorrhage on displacement profiles and correlation measurements, a method for identifying hemorrhage has been developed. As described by Scola et al. [63] and depicted in Figure 2.3, luminal blood, extravasated blood, and soft tissue are distinguishable using ARFI ultrasound. Figure 2.3 is specific to the protocol used to acquire much of the data presented herein, in which injury is caused to a vein using a large gauge needle. Bleeding is observed after injury, and hemorrhage is identified using the algorithm depicted in Figure 2.3. An ultrasonic imaging probe is placed on the skin surface, and displacement profiles are obtained from a 2D field of view. As soft tissue is expected to have fully recovered by approximately 4 ms, all data prior to this time is discarded. The second derivative of ARFI induced displacements from 4 ms onward is obtained (indicated by the red squares on the
displacement profiles in Figure 2.3), magnifying the presence of displacement estimation variance, or jitter, in the displacement profile. The second derivative operator is a high pass filter that amplifies variance in the displacement estimation. Notice that the second derivative of displacement in the lumen has much larger amplitude than in soft tissue, while hemorrhage is somewhat in the middle. The variance of this measurement is then taken, resulting in a high variance measure in the lumen, low variance in soft tissue, and moderate variance in hemorrhage. Thresholding on the variance of the second derivative of displacement after soft tissue recovery as well as on the peak displacement of soft tissue distinguishes regions of suspected hemorrhage.
The hemorrhagic area can be measured by multiplying the pixel size by the
20
21
22
Chapter 3
Optimization of Measurements from ARFI Monitored Hemostatic Challenge
The bulk of work presented in this thesis involves technical optimization of the ARFI-monitored hemostatic challenge. The ability to noninvasively detect hemorrhage using ultrasonic imaging allows for continuous measurement of metrics such as the rate of hemorrhage and the time required to achieve hemostasis. Two methods of calculating the rate of hemorrhage are presented and compared, as are two methods for measuring the time to hemostasis. Additionally, a spatial clustering method used to remove noise beneath the focal depth is described.
3.1 Imaging Parameters and Methods
24
Dogs were imaged on two occasions separated by a number of months to allow each dog to recover after the procedure. Prior to imaging, dogs were fully anesthetized with approximately 2% isoflurane. Blood pressure, heart rate, oxygen saturation, and core body temperature were monitored throughout the procedure.
Dogs were situated in a prone position for the duration of imaging. The hind limb was shaved and prepped with an aseptic method. To reduce motion caused by the dog’s breathing or fluctuations in the dog’s response to anesthesia, the hind limb was tethered
25
B-mode frames were acquired before the puncture as a baseline measurement, every minute for 15 minutes after the puncture, every two minutes from 15-25 minutes, and every 5 minutes from 25-100 minutes after puncture. Imaging ended after a total period of 100 minutes. The standard hemostatic challenge was completed on a variety of dogs exhibiting different bleeding phenotypes, outlined in Table 3.1. Each normal dog, dog
with naïve hemophilia A, and dog treated with infused FVIII or gene therapy to express canine FVIIa (cFVIIa) was imaged twice for reproducibility measures, with imaging events separated by a minimum of 2 months. Six phenotypically normal dogs were used as controls. Eight dogs with naïve hemophilia A were monitored for 30 consecutive minutes of bleeding, after which time they were administered an infusion of canine FVIII
26
(cFVIII) to approximately 10% activity followed by an additional 70 minutes of ARFI monitoring. Administration of cFVIII for these particular dogs directly combatted the formation of large hematomas caused by excessive bleeding in hemophiliacs. Four naïve hemophilia A dogs underwent gene therapy to express cFVIIa at 1.3-2 µg/mL [27]. Gene therapy is a potential prophylactic treatment for hemophiliacs [26], [67], [68], while infusion with cFVIII is an on-demand treatment [2]; inclusion of both treatments in the experimental design allows for insight into the benefits and drawbacks of on-demand vs. prophylactic therapies. Six dogs with naïve von Willebrand’s Disease (VWD) were imaged before and after use of prophylactic von Willebrand’s Factor. Each of these dogs
was imaged in a single event.
Table 3.1: Detailed breakdown of bleeding phenotypes imaged in these studies, the number of dogs imaged in each phenotype, and the number of imaging sessions for each dog. All
phenotypes, with the exception of von Willebrand’s Disease and von Willebrand’s Disease with therapeutic von Willebrand’s Factor, were imaged twice for reproducibility.
Bleeding Phenotype N Number of Imaging Sessions
Normal 6 2
Naïve Hemophilia A 8 2
Naïve Hemophilia A +
Infused cFVIII 8 2
Naïve Hemophilia A
Expressing cFVIIa 4 2
Naïve von Willebrand’s Disease 6 1
von Willebrand’s Disease +
Infused von Willebrand’s Factor 6 1
ARFI imaging was performed using a Siemens SONOLINE Antares™ ultrasonic
27
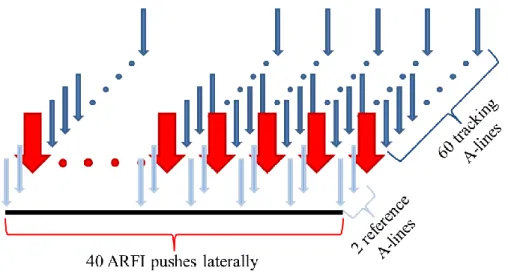
for this application consisted of two conventional, two-cycle A-lines, followed by a 300-cycle (70 μs) ARFI excitation impulse centered at 4.21 MHz. The excitation impulse had an F/1.5 focal configuration. ARFI excitation was followed by a tracking ensemble of 60 (6 ms) conventional A-lines at a center frequency of 6.15 MHz and pulse repetition frequency of 11 kHz. The entire excitation-tracking ensemble was repeated in 40 lateral locations over a 2.1 cm lateral field of view resulting in 0.53 mm spacing, as illustrated in Figure 3.2. The focal depth for imaging was positioned at the proximal venous wall, which was typically located between 20 and 25 mm in depth. A 2 cm thick standoff pad was utilized when the hind limb was too lean to locate a vessel at the appropriate depth; the standoff pad was not necessary except when imaging dogs with von Willebrand’s Disease, as they are a smaller breed.
Figure 3.2: ARFI beam sequence acquired in 40 lateral locations spanning a 2.1 cm lateral field of view. Light blue arrows show two reference A-lines prior to ARFI excitation. Red arrows indicate the ARFI excitation, while dark blue arrows are the tracking ensemble of 60 conventional A-lines after ARFI excitation.
28
Natick, MA). One-dimensional (1-D) axial displacements were estimated along each acquired excitation-tracking ensemble using cross-correlation with a 1.5 λ kernel, an interpolation factor of 4, and a search window length of 80 μm [69]. A linear filter applied to the measured ARFI displacement profiles was utilized to reject physiologic motion artifacts [70]. Localized regions of hemorrhage caused by needle puncture were isolated using custom software outlined in Chapter 2.3. The area of hemorrhage found in each ARFI acquisition was estimated by multiplying the number of identified
hemorrhage pixels by the pixel area, approximately 0.01 mm2. Plots of area identified as hemorrhage vs. time were created for each dog.
29
Figure 3.3: Comparison between hemorrhage detection with different beam sequences. The push sequence used an ARFI excitation impulse followed by 60 conventional, tracking A-lines (a). The no-push sequence did not have the excitation impulse (b) for hemorrhage detection. Pixels identified as hemorrhage are colored red.
Normalized plots of detected hemorrhage area vs. time were created for each dog imaged. From these plots time to hemostasis and hemorrhage rate were measured. Representative plots in Figure 3.4 show the different bleeding profiles for different phenotypes. The bleeding profiles created using the ARFI Monitored Hemostatic Challenge agree with expected behaviors for each phenotype. Normal dogs will bleed quickly and clot quickly, while naïve hemophilia A results in an extended, slow bleeding profile without any discernible plateau in the amount of hemorrhage detected prior to treatment with infused cFVIII at 30 minutes. Hemophilia A after gene therapy to express cFVIIa begins to resemble a normal phenotype, with a tapering in the amount of
hemorrhage over time. VWD and VWD + VWF illustrate the prophylactic effects of administered VWF. Naïve VWD bleeds extensively initially, and may saturate the
30
Measurements of interest obtained from measured hemorrhagic area vs. time plots include the rate of hemorrhage (RH) in mm2/min and the time necessary to achieve hemostasis (time to hemostasis, TTH). The remainder of this chapter will discuss two algorithms for the calculation of RH followed by two algorithms for the calculation of TTH, as well as examples of in vivo implementation.
31
3.2 Calculation of Rate of Hemorrhage
3.2.1 Discrete, Non-Overlapping Windows
The rate of hemorrhage is defined herein as the change in measured hemorrhagic area over time for purposes of assessing hemostatic normalcy or dysfunction. The first algorithm developed for this measurement utilized discrete, non-overlapping 10-minute intervals over which the slope of the detected hemorrhage area vs. time plot was
measured (Figure 3.5) [63]. Hemorrhage area was divided into 10 discrete,
non-overlapping 10-minute intervals. The measured hemorrhage area in each interval was fit using a piecewise linear-least square approximation. The slope of each fit line can be used as a direct measurement of hemorrhage rate.
Utilization of discrete 10 minute intervals was advantageous in noisy datasets, in which outliers negatively affect rate measurements. Effects caused by outliers would be amplified if rate were calculated based on the instantaneous time derivative at each point. Measuring the slope over a ten minute period has a slight averaging effect on the data by fitting a best fit line through the center of the data, thus negating any extreme outliers and their influence on rate measurements. Assuming that the majority of hemorrhage is located within the ARFI imaging plane and field of view, the general trend of
hemorrhage is accounted for in each ten minute segment; however, minute-to-minute variations in bleeding behavior are minimized using this method due to the
aforementioned noise reduction over the observed time period.
32
impact on the rate measurement. Typically, these slight changes in the bleeding profile should not drastically alter the rate measurement. However, fluctuations in the measured hemorrhagic area may be indicative of the breakage of weak clots, and therefore provide important information about the stability of the clot over time. This is particularly evident when inspecting the bleeding profile of naïve Hemophilia A expressing cFVIIa at 1.3 μg/ml (Figure 3.6). When compared to naïve Hemophilia A without treatment (Figure
3.4b), the genetic therapy drastically reduces the amount of bleeding. However,
fluctuations seen in the raw data, shown in red circles, in Figure 3.6 and Figure 3.4c may provide insight into the fragile nature of the forming clot in this particular dog after therapy. Instantaneous changes in measured hemorrhagic area over time are minimized in each fitted line segment, thus removing high frequency noise from the bleeding profile along with any relevant physiological data the high frequency information may carry.
33
Figure 3.6: Bleeding profile for a dog with naïve Hemophilia A expressing cFVIIa at 1.5 μg/ml. The slope of each fit line over ten minutes is calculated as the rate of hemorrhage. The data points acquired during the imaging session (red circles) fluctuate intensely between 40 and 70 minutes.
3.2.2 Sliding Window
The second algorithm was developed to provide minute-by-minute information about the hemorrhage while minimizing the effect of noise in the signal. A sliding window of an empirically determined length was used rather than discrete,
non-overlapping ten minute segments. Three, five, and ten-minute windows were chosen for use in this method with one set of results shown in Figure 3.7. To create rate of
hemorrhage vs. time plots, the initial window begins at the first point on the hemorrhage area vs. time curve (t = 0). A linear-least square line is fit through the number of
34
The sliding window method with a kernel size of 10 minutes has several
advantages over the static 10 minute window calculations. More detail about the transient rate of hemorrhage over time is available when calculating rate with the sliding window. Rather than measuring 10 unique rates over a 100 minute acquisition, this method measures 90 individual rates corresponding to every position over which the window slides. This provides valuable insight into the fluctuations of bleeding profiles. However, depending on the window length utilized, rate measured using the sliding window method is vulnerable to noise or high frequency information in the signal.
A window length of ten minutes was empirically determined for analysis of the 100 minute observation period utilized in this protocol. The use of a ten minute kernel length provided significant noise reduction without excessive removal of valid high frequency information in the bleeding profile. Unfortunately, noise and natural
35
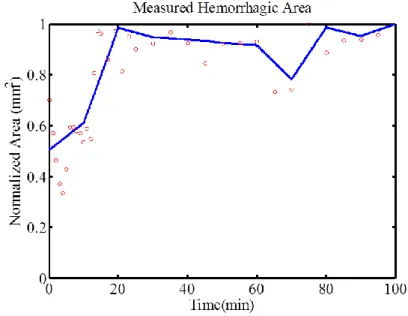
Figure 3.7: Measured hemorrhagic area vs. time plots for a representative normal dog. Data points measured during the imaging session (red circles) are fit using a linear least-square approximation over a ten minute sliding window (blue lines). The slope of each fit line is measured as the average rate over the ten minute window. The kernel length for each sliding window is 10 minutes (top), 5 minutes (bottom left), and 3 minutes (bottom right).
36
3.3 Calculation of Time to Hemostasis
The time to hemostasis measurement pinpoints the cessation of bleeding after injury in each of the bleeding phenotypes examined herein. Two separate methods were utilized for TTH measurements: time necessary to reach 75% of the maximum
hemorrhagic area measured, and time at which the rate of bleeding approaches zero or becomes negative for 5 consecutive minutes.
3.3.1 Time to Hemostasis Based on Measured Hemorrhagic Area
The time to 75% of maximum measured hemorrhagic area provides information about the time at which bleeding substantially slows. It is found by locating the time at which detected hemorrhage area reaches a maximum on the area vs. time plot, such as those presented in Figures 3.5, 3.6, and 3.8. The algorithm then searches from t = 0 to the time at which this maximum occurs, t = tmax, to determine the first point where the
detected hemorrhage area is equal to 75% of the maximum, denoted as the time required to achieve hemostasis [34], [63]. Time to 75% of maximum is indicated in Figure 3.9 by the vertical lines intersecting the y-axis at 0.75 mm2 and the x-axis around 13 minutes. Previously reported results using this measurement of time to hemostasis [34], [63] successfully demonstrated different TTH based on bleeding phenotype. Naïve hemophilia A resulted in significantly longer TTH than healthy dogs. However, the measurement of 75% of maximum is somewhat arbitrary. This metric corresponds to the time necessary to have a significant reduction in the rate of hemorrhage; yet, as is evident in Figure 3.9, the TTH denoted by the red lines does not necessarily align with a cessation in bleeding. The measured hemorrhagic area for this particular dog continues to increase even after
37
to provide a single, consistent metric, while determining hemostasis using bleeding rate may detect multiple instances of the onset of hemostasis, as described in Chapter 3.3.2.
Figure 3.9: Time to hemostasis as measured using the time to 75% of the maximum measured hemorrhagic area in a representative normal dog. TTH is approximately 13 minutes, as indicated by the horizontal red line beginning where the area is equal to 0.75 mm2 and intersecting the time axis at the measured TTH.
3.3.2 Time to Hemostasis Based on Rate of Hemorrhage
An alternate method for determining the time to hemostasis is based on
characteristics of the rate measurement. Rate of hemorrhage is first calculated using the 10 minute sliding window technique discussed in Chapter 3.2.2. Based on RH
38
as the clot breaks and reforms after injury. Measuring TTH using the rate calculation allows for the assessment of natural fluctuations in hemostatic status by providing information about the onset and duration of hemostasis associated with thrombus formation.
Figure 3.10 illustrates the concept of clot formation and breakage over time and the effect this has on TTH measurements. Data shown were acquired from a single dog with hemophilia A that expressed cFVIIa at 1.3 μg/ml. TTH measured using 75% of
maximum would find that this individual dog achieves hemostasis after approximately 27 minutes. However, from the plot of measured hemorrhagic area vs. time it can be seen that there are multiple instances where the measured area plateaus or decreases over time, then begins increasing again. Plateaus in hemorrhagic area occur around 10, 35, and 75 minutes. Calculating TTH based on zero or negative rate of hemorrhage directly corresponds to regions in the area vs. time plot during which bleeding is decreasing or stopping. Inspection of the measured rate of hemorrhage vs. time plot shows that rate approaches 0 mm2/min around 10 to 15 minutes, the time of the first plateau in
hemorrhage area. As the area begins increasing again, the rate becomes more positive. A second plateau in measured area occurs around minute 35, at which point the rate
becomes negative for 5 to 10 minutes. This is indicative of formation of a weak clot, followed by breakdown of the clot and continued bleeding.
39
resulting in a final TTH measurement much larger than the initial TTH reported.
However, variations in the bleeding profile of most dogs do not sufficiently taper over the 100 minute observation period due to noise in the measured signal or bleeding that
restarts at the site of injury. Reporting the first time at which rate is equal to or less than zero for a five minute period provides a more robust measurement for differentiation between bleeding phenotypes in vivo.
Figure 3.10: Measured hemorrhagic area (left) and calculated rate of hemorrhage (right) from a single hemophilia A dog expressing canine FVIIa at 1.3 μg/ml. The rate was calculated using a sliding window of ten minutes across area vs. time data. The dotted line on the rate plot indicates a rate of 0 mm2/min. TTH is calculated as 37 minutes.
3.4 Spatial Clustering to Remove Noise
40
SNR causes an increase in the measured jitter, thus causing these pixels to satisfy the thresholding criteria used to distinguish hemorrhage. To combat erroneous identification of noise pixels as hemorrhage, a spatial clustering method was implemented to remove data below the focal depth.
Typically, ARFI imaging is focused on or just above the near vessel wall so visualization of hemorrhage above the vessel can be properly identified. There is always a possibility of blood pooling beneath the vessel due to injury to the lower vessel wall or blood flowing around and below the vessel after injury. However, protocols used for all experiments presented in this thesis consistently utilized a focal depth above the vessel of interest. Expanded depth of field of ARFI measurements will allow future studies to observe above and below the injured vessel, which will further improve removal of falsely identified hemorrhage pixels. Spatial clustering for this application focused on removal of identified noise pixels above and below the focal depth, typically resulting in the removal of pixels within and below the vessel lumen.
41
which contains the smallest values. The curve corresponding to luminal blood has the largest values, and hemorrhage is intermediate between the soft tissue and luminal blood curves. The exponential value of where these three intersect on the histogram becomes the lower and upper threshold values for hemorrhage detection, shown graphically in Figure 3.11. The green circles on the experimentally derived histogram data indicate points chosen as lower and upper thresholds for hemorrhage identification.
Figure 3.11: Determination of lower and upper threshold values for hemorrhage detection. The histogram of the natural log of variance of the second derivative of displacement values contains three distinct curves, corresponding to luminal blood (blue), hemorrhagic blood (purple), and soft tissue (red). The green dots indicate the lower and upper threshold values, found at the intersection of each of these curves. The green dots on the histogram on the right indicate the lower and upper thresholds for this dataset.
After determination of the lower and upper thresholds for hemorrhage detection, a mask was made of pixels that do not satisfy the hemorrhagic threshold criteria. Pixels that contained VSDD values less than the lower threshold were identified; these pixels
42
than the lower threshold of both peak displacement and VSDD, effectively isolating pixels located in the vessel walls along with noise in the near field. Near field noise is removed by setting the first 5 mm of the binary mask to zero (Figure 3.12.2). Vessel wall pixels are easily identified due to the lack of blood pooling in the vessel wall itself. All pixels containing either luminal or hemorrhagic blood surround the vessel wall, but blood does not accumulate inside the vessel wall. Additionally, the vessel wall is highly elastic and therefore exhibits a lower magnitude displacement after ARFI excitation than surrounding blood pixels. Low displacement values combined with low VSDD make the vessel wall an ideal structural marker for this spatial clustering technique.
Spatial clusters of pixels equal to one are then sorted by size. The largest cluster of pixels corresponds to the upper wall of the vessel, evident as a white band across the image in Figure 3.12.2. The algorithm then moves laterally across the field of view, setting all pixels below the uppermost pixel in the vessel wall to zero, and all pixels above that position to one (Figure 3.12.3). This mask is then applied to data when
43
Figure 3.12: Spatial clustering technique to remove falsely identified hemorrhagic pixels from within and below the vessel lumen. (1) Pixels with peak displacement values and variation of the second derivative of displacement values below the lower thresholds are set equal to 1, while all other pixels are set equal to zero. (2) The first 5 mm of the image are removed as noise in the near field. (3) All pixels below the upper vessel wall, located in the white band in the center of (2), are removed. All pixels above the upper vessel wall are kept for identification of hemorrhagic pixels.
44
Chapter 4
In Vivo Implementation of ARFI Monitored Hemostatic Challenge
4.1 Effect of Bleeding Phenotype on Time to Hemostasis and Rate of Hemorrhage
Previously reported time to hemostasis and rate of hemorrhage indicate that bleeding phenotype has a strong effect on hemostatic metrics. Rate of hemorrhage and time to hemostasis were calculated for each of the dogs imaged using discrete, non-overlapping windows and time to 75% of maximum measured hemorrhagic area, respectively. Significance was assessed using a linear mixed-effect model and cox proportional hazard regression with correlated observations. Both methods accommodate repeated measurements in the data, while the cox proportional hazard regression is used to compare hemophilia A TTH measurements (reported as greater than 30 minutes) with TTH from other phenotypes.
45
values within the normal range as well (p < 0.79). TTH did not seem affected in naïve VWD and treated VWD with prophylactic infusion of VWF, with no significant differences from normal. The rate of hemorrhage was significantly elevated in VWD dogs compared to normal (p < 0.0000038). After treatment with prophylactic VWF the rate of hemorrhage was brought within normal range (p < 0.77). Additionally the rate of hemorrhage is slightly increased in naïve hemophilia A compared to normal (p < 0.015), which is corrected with on-demand and prophylactic treatment. These results are shown in Table 4.1
Table 4.1: Rate of hemorrhage and time to hemostasis measurements for each bleeding phenotype reported as mean ± standard deviation. Rate of hemorrhage was measured using discrete, non-overlapping windows. Time to hemostasis was measured as the time to 75% of maximum hemorrhagic area in each dog after each imaging session.
Hemostasis Phenotype n Number of Imaging Sessions
Rate of Hemorrhage
(mm2/min)
Time to Hemostasis
(min)
1 Normal 6 2 0.38 ± 0.31 24.55 ± 10.11
2 Naïve Hemophilia A 8 2 0.59 ± 0.41 > 30
3 Hemophilia A treated with FVIII to 10%
8 2 0.47 ± 0.32 25.26 ± 11.95
4 Hemophilia A expressing cFVIIa at 1.3μg/ml
4 2 0.56 ± 0.27 21.86 ± 8.72
5 Naïve von Willebrand’s Disease 6 1 1.72 ± 0.43 23.98 ± 9.90
6
von Willebrand’s Disease treated with prophylactic VWF to 7%
6 1 0.40 ± 0.34 23.21 ± 20.79
Rate Significance 1 vs. 2 – p < 0.015 1 vs. 3 – p < 0.269 1 vs. 4 – p < 0.139 1 vs. 5 – p < 0.0000038 1 vs. 6 – p < 0.779
TTH Significance 1 vs. 2 – p < 0.0015 1 vs. 3 – p < 0.804 1 vs. 4 – p < 0.792 1 vs. 5 – p < 0.741 1 vs. 6 – p < 0.735
46
least 5 consecutive minutes, respectively. Significant differences in time to hemostasis were seen between normal dogs and dogs with naïve hemophilia A (p < 0.003).
Treatment with infused FVIII to 10% and with gene therapy to express cFVIIa at 1.3 µg/ml brought TTH to within normal limits (p < 0.986 and p < 0.718, respectively). Naïve VWD had significantly different RH than normal (p < 0.0063), which was corrected with prophylactic VWF administration (p < 0.242). Of note, the rate of
hemorrhage in dogs expressing canine FVIIa was significantly different from normal (p < 0.0003) even with corrected time to hemostasis measurements. These data are reported in Table 4.2.
Table 4.2: Rate of hemorrhage and time to hemostasis measurements for each bleeding phenotype reported as mean ± standard deviation. Rate of hemorrhage was measured using a sliding window with a 10 minute kernel. Time to hemostasis was measured as the time at which RH became zero or negative.
Hemostasis Phenotype n Number of Imaging Sessions
Rate of Hemorrhage
(mm2/min)
Time to Hemostasis
(min)
1 Normal 6 2 0.26 ± 0.23 21.92 ± 9.14
2 Naïve Hemophilia A 8 2 0.43 ± 0.33 > 30
3 Hemophilia A treated with FVIII to 10%
8 2 0.27 ± 0.21 21.69 ± 10.96
4 Hemophilia A expressing cFVIIa at 1.3μg/ml
4 2 0.51 ± 0.51 20.29 ± 10.40 5 Naïve von Willebrand’s Disease 6 1 0.69 ± 0.17 21.5 ± 7.56
6
von Willebrand’s Disease treated with prophylactic VWF to 7%
6 1 0.13 ± 0.03 26.6 ± 5.46
Rate Significance 1 vs. 2 – p < 0.269 1 vs. 3 – p < 0.922 1 vs. 4 – p < 0.0003 1 vs. 5 – p < 0.0063 1 vs. 6 – p < 0.242
47
4.2 Reproducibility of Time to Hemostasis and Rate of Hemorrhage
Measurements
4.2.1 Reproducibility after Multiple Imaging Sessions
Reproducibility of TTH and RH measurements were assessed to determine the robustness of ARFI Monitored Hemostatic Challenge as an in vivo hemostatic assay. For reproducibility measures, normal, naïve hemophilia A, hemophilia A treated with infused FVIII to 10%, and hemophilia A expressing cFVIIa to 1.3 µg/ml dogs were imaged twice using identical protocols. Data were processed using both fixed ten minute windows for HR and time to 75% of maximum for TTH, which is designated as the Maximum Method, as well as calculating HR using a sliding window with a kernel of 10 minutes and TTH by determining the time at which HR becomes less than or equal to 0 mm2/min for at least 5 consecutive minutes, or the Rate Method. Statistical significance was determined using the two-sample t-test between imaging sessions of each phenotypic category for between-session reproducibility measures.
After two imaging sessions the Rate Method appears to be highly reproducible while the Maximum Method was unable to measure statistically similar values for RH and TTH in select hemostatic phenotypes. These reproducibility results are reported in Figures 4.1 and 4.2, which provide graphical representation of the median and range of data collected for each group of dogs. The Maximum Method was not repeatable in normal and naïve hemophilia A dogs between imaging sessions, with significant
48
with naïve hemophilia and normal or treated dogs were maintained; this is consistent with results reported in Chapter 4.1.
49
Figure 4.2: Reproducibility of Rate of Hemorrhage and Time to Hemostasis calculated using the Rate Method. TTH was determined to be the time at which measured rate of hemostasis reaches or dips below 0 mm2/min. TH was measured using a sliding 10 minute window. Boxplot showing the median (red line), 25th and 75th percentiles (blue box), and range (dashed lines) of data for all hemostatic phenotypes. Exp. 1 and Exp. 2 correspond to imaging sessions 1 and 2, respectively. N is the total number of dogs in each imaging session.
50
(2°CBT). 1°SBT is completed by immersing the tip of the ear in 37°C 0.9% saline for 2 minutes. The tip is then cut with a scalpel blade over ~0.5 cm, and then resubmerged in the saline. Bleeding is observed and the time to cessation of bleeding is noted. Normal hemostasis is defined as cessation of bleeding in less than 5 minutes, and abnormal is defined as greater than 15 minutes. 1°CBT and 2°CBT follow a similar protocol using the paw to monitor bleeding. A guillotine-style nail clipper is used to create a primary cut in the nail located at the quick. The bleeding nail is submersed in warm saline, as in saline bleeding time protocol, and the time to cessation of bleeding for a full minute is recorded as the primary bleeding time. The secondary bleeding time is measured by reinjuring the nail using the guillotine-style nail clippers two hours after the first injury, monitoring the bleeding in warm saline, and recording the time that bleeding ceases for a full minute [34].
Table 4.3 illustrates the lack of reproducibility in this large animal model hemostatic assay. Primary and secondary bleeding measurements were reproducible in normal dogs, with 6 of 6 exhibiting cessation of bleeding in less than five minutes on two separate occasions. However, naïve hemophilia A showed a secondary cuticle bleeding time of greater than 15 minutes, as expected, in only 4 of the 8 dogs. This was repeatable in 1 of these 4. Six of 8 naïve hemophilia A dogs had unclear endpoints, in which
51
for this dog. The Von Willebrand’s Disease population had no dogs within normal
bleeding cessation, and 3 of 6 dogs stopped bleeding in greater than 15 minutes.
Table 4.3: Reproducibility of primary and secondary cuticle and saline bleeding measures in 6 normal, 8 naïve hemophilia A, 8 hemophilia A with infused FVIII, and 6 naïve VWD dogs. Bleeding disorders are expected to have secondary measurements of greater than 15 minutes, which should be reproducible particularly in naïve Hemophilia A. Normal dogs are expected to have primary measurements of less than 5 minutes. Unclear endpoints occurred when bleeding slows drastically, and then suddenly increases during the observation period.
< 5 minutes on primary measurement
> 15 minutes on secondary measurement
Reproducible Excessive Bleeding
Unclear Endpoints Normal
(n = 6) 6/6 -- 6/6 -- --
Naïve Hemo A
(n = 6) -- 4/8 1/4 6/8 6/8
Hemo A + FVIII (n = 8)
1/8 1/8 1/1 -- --
VWD
(n = 6) -- 3/6 -- -- --
4.2.2 Within Dog Reproducibility
Within dog reproducibility was assessed to determine if, for each dog imaged twice, TTH values and RH values from imaging session 1 were reproducible in imaging session 2. Normal TTH was defined as time to hemostasis of less than 30 minutes. TTH greater than 30 minutes has been shown via ARFI Monitored Hemostasis to be typical of hemostatic disorders, and is particularly evident in naïve Hemophilia A. Similarly, ARFI derived RH have shown that hemostatically normal dogs typically have RH far less than 1 mm2/min while dogs with von Willebrand’s Disease have RH greater than 1 mm2/min.
52
FVIII in these dogs brought three of eight dogs within normal range, all of whom
reproducibly had TTH measurements under 30 minutes. Gene therapy to express cFVIIa appeared to be a more successful treatment, with four of four dogs having TTH within normal limits, and three of those four exhibiting reproducible results after the second imaging session. Almost all of the dogs, regardless of hemostatic phenotype, were within normal limits for RH. These RH values appear highly reproducible after the second imaging session.
Table 4.4: Reproducibility of TTH and RH calculated using the Maximum Method in 6 normal, 8 naïve hemophilia A, 8 hemophilia A with infused FVIII, and 4 naïve hemophilia A expressing cFVIIa. Normal dogs are expected to have TTH measurements of less than 30 minutes and RH of less than 1 mm2/min, which should be reproducible after the second imaging event.
Maximum Method
TTH < 30
minutes Reproducible
RH < 1
mm2/min Reproducible Normal
(n = 6) 6/6 3/6 5/6 5/5
Naïve Hemo A (n = 8)
0/8 8/8 7/8 7/7
Hemo A + FVIII (n = 8)
3/8 3/3 7/8 7/7
Hemo A exp. cFVIIa
(n = 4)
4/4 3/4 3/4 3/3
53
underwent gene therapy had TTH less than 30 minutes. Unfortunately, only two of these four were reproducible after the second imaging session. Rate of hemorrhage
measurements were highly reproducible in all hemostatic phenotypes included herein.
Table 4.5: Reproducibility of TTH and RH calculated using the Rate Method in 6 normal, 8 naïve hemophilia A, 8 hemophilia A with infused FVIII, and 4 naïve hemophilia A expressing cFVIIa. Normal dogs are expected to have TTH measurements of less than 30 minutes and RH of less than 1 mm2/min, which should be reproducible after the second imaging event.
Rate Method
TTH < 30
minutes Reproducible
RH < 1
mm2/min Reproducible Normal
(n = 6) 5/6 4/5 6/6 6/6
Naïve Hemo A (n = 8)
0/8 8/8 7/8 6/7
Hemo A + FVIII (n = 8)
6/8 6/6 8/8 8/8
Hemo A exp. cFVIIa
(n = 4)
4/4 2/4 1/4 1/1
54
4.3 Gene Therapy in Dogs
ARFI Monitored Hemostatic Challenge has demonstrated the efficacy of FVIII infusion in hemophilic dogs, as well as gene therapy for expression of cFVIIa in a small number of hemophilic dogs. Gene therapy is a promising therapeutic for clinical
applications in individuals with inherited bleeding disorders. Expression of canine FVIIa is shown to reduce a dog’s reliance on on-demand therapeutic agents after injury. Figure 4.6 illustrates the effects of gene therapy to express FVIIa on a single FVIII deficient dog. Infused FVIII was administered after 30 minutes to combat excessive bleeding prior to gene therapy, shown in the top row of Figure 4.3. Prior to gene therapy, this dog exhibits a typical hemophilic bleeding profile in which a true measurement of hemostasis is not achieved due to safety constraints. After injury the dog continues bleeding slowly without cessation until on-demand therapies are administered. The plot of RH vs. time indicates multiple small instances of transient hemostasis when the rate is equal to or less than 0 mm2/min.
55
the Rate Method, in which initial TTH is denoted as the first zero crossing of RH followed by 5 consecutive minutes of negative or zero RH values.
Prior to therapy for this individual dog, it does not appear that continued
hemostasis is achieved; there are many periods of transient hemostasis without extended cessation of bleeding. After gene therapy it appears that this particular dog had excessive bleeding between vessel injury and the beginning of ARFI acquisition, at which point the dog developed a long-lasting clot at the site of injury. However, immediate hemostasis after injury seems unlikely and more examples are needed to validate this result.
56
Figure 4.3: Area of hemorrhage and rate of hemorrhage vs. time plots for a single FVIII deficient dog before (top) and after (bottom) gene therapy to express canine FVIIa. The Rate Method was used for data analysis. 0 mm2/min is denoted on RH plots by a dashed black line. Prior to gene therapy this dog was given infused FVIII at 30 minutes to combat excessive bleeding.
57
Figure 4.4: Measured hemorrhagic area vs. time in a FVII deficient dog. The data was fit using the Rate Method. Raw data measurements are indicated by red circles.