warwick.ac.uk/lib-publications
A Thesis Submitted for the Degree of PhD at the University of Warwick
Permanent WRAP URL:
http://wrap.warwick.ac.uk/132215
Copyright and reuse:
This thesis is made available online and is protected by original copyright.
Please scroll down to view the document itself.
Please refer to the repository record for this item for information to help you to cite it.
Our policy information is available from the repository home page.
using Spatial-Temporal Data
Analytics
by
Sarunkorn Chotvijit
A thesis submitted to The University of Warwick
in partial fulfilment of the requirements
for admission to the degree of
Doctor of Philosophy
Department of Computer Science
The University of Warwick
There is significant national interest in tackling issues surrounding the needs of vulnerable children and adults. At the same time, UK local authorities face
severe financial challenges as a result of decreasing financial settlements and increasing demands from growing urban populations. With an ageing popu-lation, local authorities were reported to have spent £168 million more than
budgeted in 2015/16 and had struggled to maintain care quality and manage unprecedented demand. This research employs state-of-the-art data analytics
and visualisation techniques to analyse six years of local government social care data for the city of Birmingham, the UK’s second most populated city. We
analyse the management and delivery of social care services by Birmingham City Council, which itself is the largest local authority in Europe, to discover patterns and insights that may assist in the understanding of service demand,
support decision making process and the resource allocation management. In a data-led study, using data derived from personal social care records
and obtaining knowledge of what drives the demand for services, we strive to use data as the cornerstone to evidence-based planning delivery. This research intends to: (i) demonstrate how data analytic tools can be applied to the
admin-istrative data held by the local government to help identify service cost profiles, provisioning and its geographical dimensions; (ii) connect the data with business
plan budget documents to gain better impact over specific groups of vulnera-ble service users and consider how this analysis can support service planning
changes; and (iii) validate and highlight the decision-making processes, com-plexity, and continuity of data records within the system - from referral through the assessment process.
The use of data in this manner could also inform the approach a local au-thority has to its data, its capture and use, and the potential for supporting
data-led management, service improvements, and potential resource savings. This data analysis resulted from a two-year study commissioned by Birming-ham City Council as part of the ‘case for change’ following several poor Ofsted
reports. In response to recent fiscal challenges, the Council is expected to make savings of£815 million over the nine-year period 2011/12 to 2019/20.
Deliver-ing savDeliver-ings of this scale, whilst protectDeliver-ing and safeguardDeliver-ing the most vulnerable citizens within a growing urban population, is one of the biggest challenges
First of all, I would like to express my gratitude to my supervisor, Prof. Stephen
Jarvis, for his guidance, patience, motivation and support throughout my MSc
and PhD journeys. I am really grateful to Malkiat Thiarai for his great
friend-ship and expert advice to enhance the level of detail and understanding of the
analyses in every contribution.
Very special gratitude goes out to all down at UK Engineering and Physical
Sciences Research Council (EPSRC) for helping and providing the studentship
funding throughout my degree. This research also would have been
impossi-ble without the support of Birmingham City Council for providing data access
and giving me the opportunity to work in the public sector organisation and
experience life as intern data scientist.
To my family, particularly my parents - Veeravouth and Ruttima
Chotvi-jit. I am thankful for the financial support, belief in my skills and ability and
encouraging me to pursue this programme. All their continuing support at all
circumstance is the greatest present. Thank you to my siblings, Rawinpa and
Sinsupa Chotvijit, who always cheered me up in general and provided
alterna-tive answers to different problems whenever I encountered difficulties. With a
special mention to Nat Luengrattanakorn, my girlfriend. It was fantastic to have
the positive encouragement and useful feedback from another domain aspect.
I am also grateful to the following people: Dr. Songklod Rastapana, Dr.
Nuttapol Risangud, Chakrit Jongsuebchoke, Neha Gupta, Henry Crosby and
many more from Warwick Thai Society and Warwick Institute for the Science
of Cities for listening, sharing and supporting me with great friendship through
the study period. Special thanks also go to John Rahilly and Dr. Petch
This thesis is submitted to the University of Warwick in support of my
applica-tion and is presented in accordance with the regulaapplica-tions for the degree of Doctor
of Philosophy. It has been composed by myself and has not been submitted in
any previous application for any degree. The work in this thesis has been
under-taken by myself under the supervision of Prof. Stephen Jarvis. Some parts of
this thesis are written based on previously published papers (as corresponding
author). Detail of all publications are described below,
• Spatial-temporal analysis of six-years of social care data from Birmingham
City Council, presents in Chapter 3, is published in:
– Chotvijit, S., Thiarai, M. and Jarvis, S. 2018. “Maintaining social care provision in the context of financial austerity.” International
Journal of Population Data Science. https://doi.org/10.23889/
ijpds.v3i1.585
– Chotvijit, S., Thiarai, M. and Jarvis, S. 2018. “Big data analytics in social care provision: spatial and temporal evidence from
Birming-ham.” dg.o18 Proceedings of the 19th Annual International
Confer-ence on Digital Government Research: Governance in the Data Age.
https://doi.org/10.1145/3209281.3209300 (Winner of Best
Pa-per award)
• Additional data-led research in the context of budgetary saving proposals,
presents in Chapter 4, is documented in:
– Chotvijit, S., Thiarai, M. and Jarvis, S. 2018. “Assessing the vi-ability of budget saving proposals for social care delivery.” Digital
assessment process, presents in Chapter 5, is published in:
– Chotvijit, S., Thiarai, M. and Jarvis, S. 2018. “A Study of Data Continuity in Adult Social Care Services.” The British Journal of
Social Work. https://doi.org/10.1093/bjsw/bcy083
• During my PhD I have also contributed to the following academic papers:
– Tkachenko, N., Chotvijit, S., Gupta, N., Bradley, E., Gilks, C., Guo, W., Crosby, H., Shore, E., Thiarai, M., Procter, R. and Jarvis,
S. 2017. “Google trends can improve surveillance of type 2
dia-betes.” Scientific reports, 7(1), p.4993. https://doi.org/10.1038/
The research presented in this thesis was made possible by the support of the
following benefactors and sources:
• UK Engineering and Physical Sciences Research Council (EPSRC) for the
Centre for Doctoral Training in Urban Science and Progress under Grant
ACAP Adults and Communities Access Point
ADASS Association of Directors of Adult Social Services
AS Assessment
ASC-CAR Adult Social Care Combined Activity Return
BCC Birmingham City Council
BNG British National Grid
CA Contact Assessment
CL Closure
CR Community Referral
ENB Enablement
EPSG European Petroleum Survey Group
ESRI Environmental Systems Research Institute
FA Further Assessment
GIS Geographical Information Systems
HR Hospital Referral
ICT Information and Communications Technology
IA Initial Assessment
IT Information Technology
Ofsted Office for Standards in Education, Children’s Services and Skills
OS Open Services
QGIS Quantum GIS
RAP Assessments and Packages of Care Return
RE Reassessment
SQL Strutured Query Language
SP Support Plan
Abstract ii
Dedication iii
Acknowledgements iv
Declarations v
Sponsorship and Grants vii
Abbreviations viii
List of Figures xv
List of Tables xvii
1 Introduction 1
1.1 Thesis Contributions . . . 4
1.2 Thesis Outline . . . 6
2 Literature Review 8 2.1 Smart Cities . . . 8
2.2 Birmingham City Council . . . 10
2.3 Social Care Services . . . 11
2.4 Public Sector Interest . . . 13
2.5 Austerity . . . 15
2.6 Data Analytics and Spatial-Temporal Analysis . . . 17
2.7 Challenges of Analysing Social Care Data . . . 19
3.2.1 Identifying the Top Ten Service Elements over time . . . 28
3.2.2 Choosing the Case Studies . . . 30
3.2.3 Case Study 1 - The Impact of a New Contractual Framework 32 3.2.4 Case Study 2 - Residential Respite Care for Disabled Chil-dren . . . 35
3.2.5 Case Study 3 - Care Services for Older Adults . . . 36
3.3 Analysis derived from Spatial Analysis . . . 39
3.3.1 Identification of Three Regional Hot Spots . . . 39
3.3.2 Discussion . . . 45
4 Assessing the viability of budget saving proposals for social care delivery 49 4.1 Care Service Agreements . . . 49
4.2 The Choice of Case Studies . . . 50
4.3 Data Analysis Strategies . . . 50
4.4 Data Cleansing and Pre-Processing . . . 51
4.5 Key Findings . . . 52
4.5.1 Case Study 1 - MIA3: Promote Independent Travel and Reduce Reliance on Council Funded Transport . . . 52
4.5.2 Case Study 2 - MIA5: Internal Care Services - Younger Adults Day Care . . . 55
4.5.3 Case Study 3 - MIA17: Internal Care Review - Home Care Enablement . . . 59
4.6 Discussion . . . 62
5 Data Continuity and the Assessment Process 65 5.1 Performance of Social Care Assessments . . . 65
5.2 Assessment Process . . . 66
5.2.3 Agreements . . . 68
5.3 Adult Social Care Eligibility . . . 69
5.4 Care Service Assessments and Agreements . . . 69
5.4.1 Process completion . . . 71
5.4.2 Data cleansing and pre-processing . . . 71
5.5 Initial Findings . . . 72
5.6 Case Study 1: Qualitative Exploration of Dataflow in the Assess-ment Process . . . 73
5.7 Case Study 2: Identifying Anomalies in the Assessment Process . 75 5.8 Case Study 3: Characteristics of Completed Stages . . . 79
5.9 Discussion . . . 83
6 Applications and Impact of Research 86 6.1 Uniqueness of the Research . . . 86
6.2 Assessing Practice . . . 87
6.3 On-going Project . . . 87
6.3.1 The Children’s Trust . . . 87
6.3.2 Care Service Children Assessment Data . . . 88
6.3.3 Methodology . . . 89
6.4 Embedding the Research back to BCC . . . 89
6.5 Planning of Social Care Services . . . 91
6.6 Generalisability of the Research . . . 92
2.1 Birmingham and its 10 council constituencies and 40 electoral
wards. . . 10
3.1 Matrix frequency heat map of all service agreement records in all
postcode districts over the past 15 years . . . 25
3.2 Workflow employed in this research . . . 26
3.3 Top ten service elements in terms of cost, for all age categories
for the period 2010-2015 . . . 29
3.4 Top ten service elements in terms of commissioning frequency, for
all age categories for the period 2010-2015 . . . 30
3.5 Examples of anomalies that the exploration of data expose . . . 32
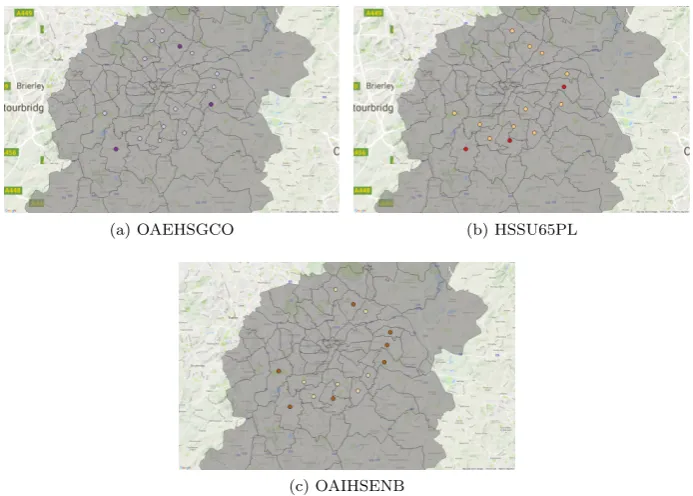
3.6 Geographical dispersal of the OAEHSGCO and HSSU65PL
ser-vice elements across Birmingham’s postcode regions . . . 33
3.7 Ethnicity profile of the recipients of OAEHSGCO and HSSU65PL 34
3.8 Unique registered users for CHIRDRT over the six-year study
period . . . 35
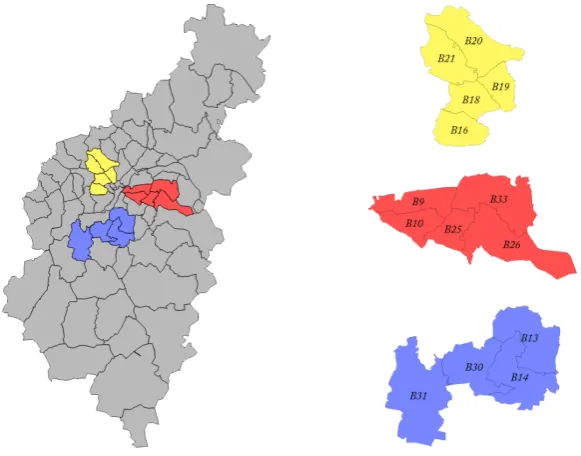
3.9 Postcode regions which saw the highest concentration of the three
service elements in question in 2010-2015 . . . 37
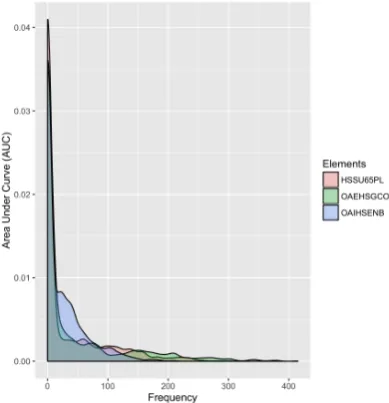
3.10 Density plots comparing the three service elements over the
pe-riod 2010 to 2015 . . . 38
3.11 The location of social care service provision across Birmingham,
ages 0-11 (1st column), 11-25 (2nd column), 25-65 (3rd column)
and 65-90 (4th column) from 2010-2012 (first two rows) and
2013-2015 (last two rows) both point and density heat maps . . . 40
3.12 Birmingham postcodes at a district level, with three areas of
3.14 Cost of top 20 elements for the eastern area . . . 43
3.15 Cost of top 20 elements for the southern area . . . 44
3.16 Three-dimension geographical dispersal of service agreements for
all age groups across three regions, 2010-2012 (left) and 2013-2015
(right) . . . 44
4.1 Number of cases, service users and total cost of transport services
over a six-year period. . . 53
4.2 Spatial-temporal heat map matrix of percentage of provision
be-tween internal and external services in district postcode. . . 56
4.3 Spatial-temporal heat map matrix of aggregated cost and number
of service users of internal care services among different service
types in district postcode. . . 57
4.4 Frequency graphs of the three enablement service elements about
number of the service users who receive less and more than six
weeks by month over six-year period. . . 60
4.5 Geographical mapping of normalised frequency of the enablement
service elements and users who receive more than six weeks of the
services per thousand population of district postcode. . . 61
5.1 High-level assessment process. . . 67
5.2 Number of frequency of assessment taken by individuals who only
appear in CA. . . 76
5.3 Frequency of length of provision of CA people who receive one
assessment and FA as outcome form. . . 77
5.4 Geographical dispersal of CA people who receive one assessment
across Birmingham’s ward region (per 1000 population). . . 78
5.5 Geographical dispersal ratio of CA people who receive one
as-sessment of FA but not CL across Birmingham’s ward region
5.7 Sample (top left) and key findings (the others) within the matrix. 81
2.1 Budget reduction plan for the top five councils in England in
2016/2017. . . 17
3.1 Records comprising a Closed Agreement and their description . . 23
3.2 Sample service elements and their descriptions. . . 23
3.3 Number of service agreement records in respect to the four age
bands. . . 26
3.4 The data attributes utilised in the subsequent case studies . . . . 28
3.5 Top ten service elements in terms of cost for the period 2010-2015 29
3.6 Top ten service elements in terms of frequency for the period
2010-2015 . . . 30
3.7 OAEHSGCO and HSSU65PL agreements for different postcodes
in Birmingham . . . 33
3.8 Comparison of records between Q1 2010 and Q1 2015 . . . 36
3.9 Postcodes within the three areas of interest and the estimated
population . . . 42
4.1 Net spending, proposed cost saving of MIA3, MIA5 and MIA17
(in£million) and its percentage cost saving. . . 50
4.2 Number of unique service users and aggregated cost between 2010
and 2015 of transport services. . . 54
4.3 Predicted number of service users and net spends according to
the cost saving plan. . . 54
4.4 Pattern and change of variation in internal care services
provi-sioning percentage. . . 57
in assessment process. . . 70
5.4 The category of form of outcome and corresponding team and
the samples. . . 71
5.5 Matrix of number of people that appear in a stage but not the
proceeding stage. . . 74
5.6 Number of people involve in other non-core stage within
assess-ment process. . . 74
5.7 Number of people who are filtered from HIR, ENB and excluded
list. . . 74
Introduction
The proportion of the population living in urban areas has been increasing
over the past decades. As a result, almost 70 percent of the world
popula-tion is expected to live in an urban environment by 2050 [116]. A city can be
diverse in regard to age, culture and ethnic background. As the world
con-tinues to urbanize, sustainable development will become more important and
steadily more dependent on the management and governance of central
admin-istrative authorities. Advances in technology have resulted in an increase in
rural to urban migration, arguably for reasons of gaining a better standard of
living and a better quality of life, as well benefitting from increased diversity
of populations [43]. However, living in an urban area can be difficult, as a
larger population can increase the level of competitiveness in society, resulting
on growing unemployment rates and increasing demand upon public services.
Therefore, the rise in urbanisation and rapid growth in technology clearly
influ-ences the way in which governments provide public services to its citizens - for
example, the shift from government-centred to citizen-centred services [106]. In
many developed countries, local authorities have become involved in improving
the dispersal and control in the quality of service provision to the most needed
people at the community level [122].
According to [7], technology is a medium that helps seekers to solve
prob-lems: New technology is normally built on-top of the existing technology and
innovation is often a result of integrating complementary technologies. The
def-inition of digitisation diffs from this with regard to the purpose or perspective of
how technology is developed and defined. For example, technology could be
or of data. At the city level, technologies can support the general efficiency and
productivity of public services, whilst improving city governance, planning and
policy-making process. As such, the establishment of e-government or digital
government [109] allows public organisations to make better use of Information
Technology (IT). The challenge is not about introducing technologies to public
administrations, but the transformative process to apply the applications into
tools of digital government [106]. Difficulties arise in the increase in the number
of poor quality online platforms [121], failure to deliver cost effective services
and the ability to maintain quality standards [54].
There is interest in integrating technology with government owned
infor-mation to improve public service delivery and to generate tangible benefits to
public sector decision-making in the United Kingdom (UK). Recent examples of
supporting city governance through the collection of large, heterogeneous data
sources (unstructured, semi-structured and structured datasets) and the
appli-cation of spatial-temporal data analytics include [74, 78]. As councils encounter
the challenges of declining budgets and rising demand [107], it is desirable to
combine data and technology to improve citizens outcomes, as well as
achiev-ing financial savachiev-ings [74]. Research by Symons [108] has shown that the pool
of sensitive and complex data held by local authorities ranges from social care
data to that concerning procurement and planning both of which could
signif-icantly benefit service provision, by targeting vulnerable groups of individuals
and allocating resources to areas in most need.
Social care is a primary and fundamental service provided by local
govern-ment to support citizens with illness, disability and vulnerability (including the
elderly) within their locality. The challenge of delivering social care to children
and adults is not new from a public sector perspective. Social care services in
many local authorities have been reported to be ineffectively allocated and have
failed in performance evaluations, resulting in injury or death of individuals a
result of abuse or neglect [20, 91] and inefficiency and poor allocation of
the UK central government to control the nature of service provisioning and its
sustainability has also been found to be inconsistent and difficult to manage [40].
This research has been undertaken in collaboration with Birmingham City
Council (BCC), the largest local authority in Western Europe. The
Coun-cil recognises, like all local authorities, that it collects and stores a considerable
amount of data about its citizens, their circumstances and the services for which
they register. For social care services, the Council was rated inadequate in
ser-vice provision of social care to its citizens by the UK Office for Standards in
Education, Children’s Services and Skills (Ofsted) [93]. The organisation was
cited nationwide for serious failures in protecting and safeguarding of
vulnera-ble people, as a number of high-profile child deaths in Birmingham have been
reported in the national press since 2003. Concurrently, in 2010, there was a
budgetary reduction scheme the central government required the local
author-ities to apply. This resulted in the council being unable to provide services to
people whose financial resources were less critical [62].
This research was prompted by preliminary work at BCC to apply data
ana-lytics and various spatial-temporal techniques to help understand the social care
provision. In developing this research, our intensions were to support decision
making with regard to resource management and addressing budget challenges
in different areas of the city, and to highlight value which could be obtained
from data held by the council. Consequently, the derived intelligence can be
used internally to reduce the requirements for costly outsourced business
ana-lytic consultancy services. This research was predicated on the basis that the
council was seeking to better understand the demand for its services and how
this demand could be met or managed during periods of austerity. In addition,
the research also analysed assessment data and the process by which it was
collected.
We note that this research does not seek to identify risk factors that affect
specific individuals. Rather it aims at supporting the organisation in
operations to support service and budgetary planning.
1.1
Thesis Contributions
In this thesis we identify and develop new approaches to data analytics and
visualisation for social care data. This includes new methods, management,
and qualitative and quantitative studies. Three case studies are developed and
explored in detail in each of the three contribution chapters. The main
contri-butions of this thesis are as follows:
1. The novel application of data analytic techniques that allow the past
pro-visioning of social care services provided by the city of Birmingham to be
better understood, including an investigation of the trends in the delivery
of services and future demand to be forecasted. New spatial-temporal data
analysis is presented and is evaluated through three case studies: An
eval-uation of the impact of a new contractual framework on older adults home
support; An investigation of residential respite care for disabled children;
and a study of care services for older adults. The research identifies and
underpins new ways of integrating data analysis and visualisation with
the monitoring and analysis of social care service closed agreements to
support the Birmingham City Council’s resource and service allocation.
2. New data-led research that connects the data and its analysis with the
on-going business planning and budget setting process at Birmingham City
Council. Three case studies are again used to illustrate this research and
its value, all three of which are taken from the Councils strategic planning
concerning Maximising the Independence of Adults (MIA): An evaluation
of proposals to promote independent travel and reduce reliance on
Council-funded transport; An investigation into internal care services, with
par-ticular reference to younger adult day care; and an inquiry into home
enablement services and proposals for cost savings. The analysis
evaluation of the data alongside historical records of service management
frameworks and key council priorities and objectives.
3. The employment of data analytic techniques to examine the flow of
in-formation from referral through the assessment process and the resulting
service provision. This contribution is again illustrated through
illustra-tive key findings: Qualitaillustra-tive exploration of data-flow in the assessment
process; Identifying anomalies in the assessment process; and identifying
the key characteristics of stages in the data life-cycle, in order to identify
opportunities for service improvement and, as a result, potential resource
savings.
This research approached the analysis from a bottom-up perspective
mean-ing that it analysed the social care data from service agreement, which was the
actual services receive by the recipients, up to referral, which was when the
users request for the service. In the first contribution, we sought to analyse
and comprehend the past service provision from the Council’s owned data. The
second contribution integrated the use of data analytic and visualisation tools
with the business and budget reports from the Council, to see how the analysis
can contribute more impact directly to the Council by supporting cost-saving
plans. The third contribution focused on the flow of users’ information from the
referral to agreement services - through the assessment process. The bottom-up
approach allowed us to better understand the fundamental of social care service
provisioning at a city-level to support city governance. This also helped enhance
data interpretation and the quality of the research.
To the best of our knowledge, these contributions are unique within this research
domain. All provide both in-depth quantitative and qualitative analyses of social
care services and have been developed in consultation with domain experts at
the council. The results can be used as a fundamental frame-work to support
1.2
Thesis Outline
Applying data analytic tools and techniques to social care service data helps
categorise this thesis into four parts: (i) A general analysis and longitudinal
exploration of social care provisioning in the city of Birmingham; (ii) The study
of service agreements in the city, leading to a fundamental understanding the
services provided and where people receive these local authority services; (iii)
A study of data-flow in the assessment process from initial assessment, through
referral, to the allocation of appropriate services; and (iv) An in-depth analysis
of service provision from existing data. The following chapters provide details
of these contributions:
Chapter 2 reviews previous literature that supports the use of data and
technology to improve city social care service provision and its challenges. This
includes challenges introduced by financial austerity, and the use of different
data analytic techniques, spatial and temporal analysis. Related work
concern-ing the assessment of social care services is also discussed.
Chapter 3 introduces a general analysis and longitudinal exploration of social
care provisioning in the city of Birmingham. The research is divided into the
analysis derived from temporal and spatial analysis. For the former, the study
includes discovering overall trends and patterns of all service users in social care,
including cost and frequency in different type of services and the characteristics
of the recipients. Furthermore, by applying spatial analysis techniques, the
research also provides geographical patterns where there is evidence of high
service demand from which more detailed analysis can be derived.
Chapter 4 presents additional analyses from the same service agreements
data. However, the research is developed further through three case studies
derived from the Council’s budget planning proposals. The analysis involves
spatial and temporal elements as well as predictive analysis for services relating
to transport, care services for younger adults and internal care for
Chapter 5 presents an analyses of personal data and its flow through the
social care assessment process. Moreover, it considers how data is stored and
manipulated at different stages in the process: From referral to when individuals
receive the actual service agreements from the local authority. In-depth
anal-ysis identifies the quality of the process and sub-processes and also identifies
anomalies and characterisitcs of the stages of the process.
Chapter 6 clarifies the novelty of this research and what makes the
contri-butions distinct from previous research within the same domain. The chapter
discusses the application and impact of this research, its contribution to an
on-going Children’s Trust project, how this research contributes to and is
em-bedded within the Council decision-making structures, and its impact on the
planning of social care services and the generalisability of the research to other
city councils.
Chapter 7 summarises the conclusion from the work presented in this thesis
Literature Review
This chapter presents the related literatures or articles that use data analytic
technologies to analyse the social care services to support decision-making
pro-cess and resources management of the local authority. The remaining parts of
this chapter follow as identifying the terminology of smart cities and
technolo-gies in general, information and facts of the local government, the social care
services, the public sector interest on applying technology to gain better insight
and understanding of the data, the problem of austerity and financial strain,
and the applications of data anlytics that have been used in similar or other
research domains.
2.1
Smart Cities
There has been an increasing number of interest about smart cities which also
in-fluent the future of urban development of many countries around the world [57].
The current scenario of a big city requires the local government to discover
solu-tions to tackle city’s problem from transportation to high-quality urban services
in the most efficient way in which many approaches related to the services involve
technologies or Information and Communications Technology (ICT). Despite a
skepticism and unclear on defining the terminology of ‘smart cities’ since it was
first being introduced in the 1990s [5], this term involves an integration of
multi-dimension components and systems; such as technologies, economy, people,
gov-ernance, networks and communication, in order to create smartness to the city
and elevate the quality of people and wellness of the communities [52, 23, 67].
In the UK, Southampton claims to be the first region that implement
cards for accessing different local government services which helped enganging
the citizen, local authority and the commercial organisations [30]. The benefit
of introducing technology to a city, resulting in a smarter place to live, can be
seen in city of Leeds that has transformed the city from manufacturing and
industrial-based to the a service-based urban form that eventually increases the
number of bar and nightlife places [58]. Whilst, in Birmingham, the city
en-counters several challenges of urbanisation from socio-economics to health and
environments [55]. The Council decides to implement Digital Birmingham, a
platform in Information, Technology and Digital Services (ITDS) to operate
technology, innovation and digitising services, over the past decade. The
plat-form is managed under four smart city principles - integration, digital, data and
citizen engagement. The scheme aims to improve the city’s economics and
liv-ing condition of the citizens, expand connection with external partners, create
digitally connected city, develop new framework from an intelligence of data to
create new urban applications and work across sectors to exploit opportunity
to emerging new technoloigies in different service departments [37].
Embedding technologies into applications and services of the city can lead to
a considerable amount of information being generated. The available technology
that can support services in the smart cities is (big) data analytic. There is a
potential use of the technology to better develop and understand insight to
address problem of the city from another perspective, while controlling cost of
the local government. One of many benefit components of smart cities support
the smart governance. This help improve opportunity of collaboration between
the government and multi-agencies, decision-making support, development of
policy making and focus on citizens’ services of health and social care, education,
2.2
Birmingham City Council
Birmingham City Council is the local government body responsible for the
gov-ernance of Birmingham, the UK’s largest and most populous city outside
Lon-don. It has a population of over 1.1 million people and the population is growing
faster than the UK average [95]. Birmingham is a young and diverse city; half
of the population are aged 30 or under, and the city benefits from many
dif-ferent nationalities, faiths, languages, ethnicities and cultures. The population
of adults and older adults are reported to have increased by more than 10 per
cent since 2013 [94] and now account for more than 75 per cent of the total
population in the city [94].
The City Council is the local government body responsible for the governance
of the city, which is managed through the division of the city into 10 council
constituencies and 40 electoral wards, see Figure 2.1. BCC is the largest local
authority in Europe. Income and expenditure in 2016/17 was£3.094 billion, of
which£782 million was spent on schools,£550 million spent on benefits, £805
million spent on services for people and £287 million spent on housing [17].
The Council is expected to make total savings of£815 million from 2011/12 to
2019/20 and, as a result of this, the authority is reducing staff from 20,000 in
[image:28.595.201.414.524.685.2]2010 to around 7,000 by the end of 2018 [18].
Birmingham faces many challenges. The Council is ranked the sixth most
deprived local authority in the UK; 40 per cent of the city was identified in the
most deprived 10 per cent of areas in England [96]. There are significant levels of
child poverty; 30 per cent of the citys children live in a deprived household [18].
Life expectancy, which varies significantly between the most and least deprived
areas, is 7.6 years lower for men and 6.2 years lower for women than the average
found across the remainder of England.
2.3
Social Care Services
Adult social care refers to ‘care and support services to help with personal care
and practical tasks to adults who need it due to physical disabilities, learning
disabilities, physical or mental ill-health, or old age’ [10]. Social care services,
provided by the local authority, covers a huge range of activities from child
protection to end-of-life care. The Care Act 2014 specifies that it is the
respon-sibility of the local government to ensure that high quality services are being
provided, as well as peoples’ desired services are facilitated to improve care and
support decision and ability to control the services themselves [24]. The
ser-vice helps increase independency with providing help, care and protection from
harm for people with physical disabilities, learning disabilities, or physical and
mental illnesses [6]. At its most basic, this can include help with washing,
dress-ing, getting out of bed in the morndress-ing, help taking medicine, and help with the
housework. Social care is becoming more and more important as the population
gets older, as the number of elderly aged over 65 in England has gone up by
over 11 per cent between 2011 and 2016 [97].
Local governments have the main responsibility when it comes to publicly
funded social care. The authorities provide information and advice, assess and
monitor the recipient’s needs and finances, provide short-term support called
reablement, safeguard vulnerable people from abuse and neglect, and buy and
older age, this means there will be more frail people and more people living
with long-term illnesses. In turn, this means that there will be more people
with needs for care and support. However, the number of people receiving
formal care from the public sector has actually reduced by 26 per cent over the
past six years, despite this increase in need and ageing population [62].
The social care assessment process captures an important interaction
be-tween local government and individuals. According to the Care Act [24], a local
authority must have regard to an individual’s assessment of their needs, an
in-dividual’s views and beliefs, their well-being and those of friends and relatives
who may be caring for them, and must be flexible in terms of individual rights
and the participation of recipients in the decision-making process [71]. Milner,
Myers and O’Byrne [82] note that the flexibility of assessment is impacted by
the fact that assessment is often a continuous process.
The proportion of service recipients who require assessment in the UK
re-mains high, particularly for older adults [86, 87, 88, 89]: 46 per cent of referrals
in 2014 received an assessment and in 2015 to 2016 approximately 0.9 million
people received state-funded social care services in England. Changes in
de-mographics adds to the complexity of the assessment process [65, 26]. At the
same time, changes to social care services, resulting from minor or major care
planning reviews, should be seamless from the point of view of the care
re-cipient [119]. This creates significant challenges for local government, because
needs and outcomes must be serviced equitably, regardless of the fact that the
mechanism for meeting needs will differ, depending on local circumstances and
individual preferences [1].
Adult social care in England has seen major restructuring over time and this
has led to the introduction of ‘personalisation’, where an individual is placed at
the heart of service provision to maximise accessibility and reinforce personal
solutions [72, 76]. Person-centred services assist individuals in retaining more
control over services they receive. There is some evidence that this has led to
However, other studies suggest more mixed evidence for personalised services
reducing local authority spend [103, 104, 125].
Good-quality assessments are required to support personalisation for the
in-dividual. However, it is possible that accessibility to services for people with
significant needs might still be limited; social care professionals are still
re-quired to make a judgement about eligibility before co-producing a response in
accordance with the client concerns and outcomes they are seeking. Data will
also be input in concurrent streams, and therefore the decision-making points
could also contribute to rate limiting in the process over time [27].
Histori-cally, there has been interest in using case review systems, monitoring tools
that support social work service provision to clients, while promoting the use
of new technology for digital-based record-keeping [50]. Using data from
exist-ing assessment documents provides the basis for identifyexist-ing requirements and
improving decision-making [46].
2.4
Public Sector Interest
There is an increasing body of work in the public sector related to data and, in
particular, how these paradigms could assist in transforming public services.
In recent years, there has been growing interest in using social care data to
highlight increased requirements, improve decision-making processes and
trans-forming public services [46]. It is argued that data is a powerful raw material
necessary for holding governments to account, driving decision-making and
im-proving the transparency of public services. The capture, curation, search,
anal-ysis, visualization and storage of large and complex datasets will generate value
across stakeholders in five key domains: healthcare, public sector
administra-tion, retail, global manufacturing and personal data [80]. This said, combining
data analytics with policymaking and the design of public service within the
public sector have been shown to improve service delivery [115]. The HM
data, citing more than 9,000 datasets that were already available through public
portals. However, a report by Yiu [123] argued that applying technologies alone
was insufficient for city transformation and that, as a minimum, data quality
and standards needed to be addressed. Yius report estimates that performance
improvements could result in public sector savings of between £16 billion and
£33 billion per annum.
Whilst the benefits of data are apparent, there is widespread recognition that
in exploiting data, organisations may leave themselves vulnerable to breaches in
privacy or data exploitation. The issue of realising the benefits of data, whilst
preventing privacy abuses, has been the subject of two reports published by the
White House and analysed by PwC [3]. In these reports it was suggested that
in order to manage expectations, changes were needed in legislation and a wider
recognition of issues was needed within organisations; thus, the use of data and
corresponding issues of privacy need to be integrated into the business strategy
of local governments to enable ownership, oversight and benefit, whilst ensuring
individuals retain protection to prevent abuse and discrimination.
Moreover, the use of personal information owned by the local government
could create several challenges around applying comparative methods or
analyt-ics. For example, the issue of data uncertainty was introduced in Child Service
Planning in Sheffield, as only half of the datasets supplied by partner
organi-sations met the granularity requirements needed for their analysis [32]. It has
also been identified that the difference in characteristics of children registered
for children’s social care across the UK could cause difficulties when analysing
and interpreting published statistics [84].
Matters of privacy and organisational responsibility also feature in work by
David Rhind [100], who cites five data protection categories in this context:
personal privacy - in which citizen’s information must be concealed; the
appro-priate role of the state - in disseminating findings approappro-priately and avoiding
misuse; the cause and effect of technology - including risk of data transfer and
misrepresentation of scientific findings.
The work by the pubic sector has been increasing not only the use of data,
but also in improving the actual social care services, for example how
strengths-based approaches can be applied before individuals start receiving service
agree-ments. Provision of high quality assessment and care management has been a
key concern for the Department of Health [35] and it is claimed that Councils
have encountered such challenges for at least the past seven years. Local
author-ities have had to consider cost reduction and process efficiency, whilst
conserv-ing the quality of services [8]; improvconserv-ing outcomes and supportconserv-ing independence
may also result in better value for money. Efficiency could be elevated by
re-viewing and improving assessment and care management processes, including
ensuring consistency of eligibility criteria and reducing assessments not leading
to services. However, the Department of Health [36] has argued that ‘living with
independence’ may relate to particular groups of users only and may be
over-stated for others. Furthermore, authorities under financial strain had greater
difficulty achieving budget saving plans using this approach. In 2012, evidence
was presented of increasing spending in assessments and reviews in 12 of the last
14 years [9]. This was largely caused by the cost and number of professionally
qualified employees carrying out assessments; it was stated that savings could
be made by altering the mix of employed staff grades and skills, and
redesign-ing the care pathway. To enhance the quality of life for people with care and
support needs, the Councils have proposed methods to embed new ‘customer
journeys’ into the care system [16].
2.5
Austerity
The demands on social care in the UK are increasing, while austerity policies
across the UK have seen a reduction in funding and services available to meet
the needs of the growing population. The financial cuts to social services
number of people receiving services [41], has resulted in difficulties in supply and
eligibility [48], a reduction in service quality [73] and an incremental increase
in the number of self-funded recipients [92]. The problem of identifying and
examining care quality [77] has been limited by the inaccessibility of good data
sources [114], insufficient high-quality care [118] and an increase in deprivation
rates [59, 22].
Budgetary challenges in England since 2010 have resulted in a 26 per cent
reduction in financial resources since 2014/15 [56], and it has been forecast
that this will significantly impact adult social care service provision [47, 61].
The Local Government Association (LGA) [75] estimated that taking account
of future funding and the range of pressures facing councils, local government
could face an overall funding gap of £5.8 billion by 2019/20. Expenditure on
social care assessment and commissioning service delivery, including long- and
short-term care plans, totalled£13.62 billion in 2016 across five different areas
of support; physical, sensory, memory and cognition, learning disability and
mental health [89]. Alongside the funding gap, councils with social care
re-sponsibilities spend roughly 30-35 per cent of their total budget on adult social
care [75]. The Association of Directors of Adult Social Services (ADASS) [2]
suggest that necessary savings to adult social care budgets by local authorities
-approximately£940 million - could not be reached without serious consequences
for front line services. However, a statistical analysis study from Iparraguirre
suggested that the fall in expenditure of adult social care leads to an increases
in proportion of elderly with unmet social care needs [64].
In order to illustrate the financial pressures on the Council, which
com-pound the operational issues described, Table 2.1 illustrates the plan for budget
reduction for Birmingham City Council compared to other local governments
City Council Name Budget Reduction Plan Birmingham City Council £88.2 million
Bristol City Council £52 million Sheffield City Council £51 million Newcastle City Council £32 million Liverpool City Council £28 million
Table 2.1: Budget reduction plan for the top five councils in England in 2016/2017.
BCC, like many other local authorities, has sought to make better use of the
data that it holds to enhance city governance and use it in different contexts,
such as in financial planning and street cleaning optimisation. It is also making
aspects of the data ‘open’ as part of its transparency agenda.
2.6
Data Analytics and Spatial-Temporal
Anal-ysis
In this digital age, when large volumes of data are produced and stored in local
authority systems daily, the advance of data analytics tools and techniques play
an important role in supporting the use of in-house, multi-dimensional data in
the most efficient way [42, 25]. Analysis is usually implemented using
program-ming languages such as R [63, 110] and Python [85, 99] and relational database
query languages including Strutured Query Language (SQL) to manipulate the
data and structures [34]. These analytic tools can also be used to visualise data
from various perspectives to gain added value and obtain new insights [68].
There is evidence of the use of personal data held by the government to
support service delivery and planning, particularly in relation to vulnerable
children [49, 105, 102]. Guralnick [51] stated that a well-organised system of
early intervention could prevent cognitive impairment in children up to the
age of five. The characteristics of children registered for social care across the
country showed variation in age, ethnicity and requirements, based on published
been carried out on the use of administrative data in identifying children at
risk, supporting predictive risk modelling as a means of tackling issues of child
protection and maltreatment [117]. This study highlighted that whilst modelling
could identify instances of abuse and neglect, the approach was not without
risk of stigmatising and discriminating against certain individuals and families.
Thomas and Percy-Smith [113] take a different approach, citing the effective
participation of children and social workers in service planning and provision.
They note that the voice of young people who were recipients of these services
can be very important and can help shape the overall strategy of services within
local areas.
Many studies have used spatial analysis, most notably Geographical
Infor-mation Systems (GIS), to analyse issues related to children in social and health
care. The research of Susan [33] shows biophysical and social vulnerabilities
of Georgetown County using methods to calculate an index score with several
indicators such as census, demographics and housing status, before applying
GIS mapping to create a better understanding of vulnerable areas. In research
by Ernst [39], the rates and distributions of three types of child maltreatment
(physical, sexual abuse and neglect) in areas as small as neighbourhoods are
identified to highlight at-risk communities. The approach adopts least squares
multiple regression analysis and GIS to gain a deeper detail understanding of the
child welfare system under investigation. Child service provision plans,
includ-ing for interventions and fundinclud-ing, has been analysed by Besag and Newell [12]
using a novel scoring and clustering technique. Their work supports the
de-tection of rare events, by computing the probability of the number of observed
cases given the population at risk. Dasymetric distribution techniques have
been used to spatially represent healthcare outcomes. This research highlights
significant differences between rural and urban areas [69]. While research from
Yu [124] highlights substantial respiratory health problems from child residents
near Asian dust storms. The risk is specified using structured additive
vulnerability of regions to increased infant mortality has previously been
iden-tified using Thiessen (Voronoi) polygons, the use of the Moran index and the
G-test [101].
The data analysis documented in this research is a result of a two-year study
commissioned by BCC, as part of an agreed ‘case for change’ following several
poor Ofsted reports. The commission is to understand what can be ascertained
from a data-led investigation, independent of the context of how the data was
collected and used. Process assessment proceeds in a similar manner to the
Assessments and Packages of Care Return (RAP) and the Adult Social Care
Combined Activity Return (ASC-CAR) in [87]. Related studies have explored
the relationship and proportion of service provision for children under the age of
five and their safeguarding systems [13]. Other studies have used data analytics
techniques on different applications in the social care domain: For example,
decision trees have been employed to improve the decision-making options of
social workers in order to improve service outcomes [98]; Correlational analysis
has been applied to explore the relationship of service demand, failure demand
and workforce stability [59].
2.7
Challenges of Analysing Social Care Data
There are numerous challenges with the analysis of social care data, which
presents significant difficulties when deriving reliable and and transferable
in-formation and methods from it. Most notably, in the UK social care is not
managed by central government, but by 152 local authorities and thousands
of domestic service providers [66]. As such, data is not uniform, is subject to
regional difference in practice and is stored in a variety of different supporting
IT systems. A compounding factor has been financial austerity, which has had
acute impact on front-line social care services. It is reported that this has led
to very few agencies holding adequate administrative data for all social care
some recipients receive services while others do not [11]. One might contrast
this with investment in National Health Service IT and data infrastructure,
in-cluding NHS Connecting for Health, established in 2005 at a cost of over£12
billion to provide a national IT infrastructure for 300,000 general practitioners
and 300 hospitals, and also NHS Digital providing digital services to the NHS
alongside large health informatic programmes.
There is a long tradition of data-led statistical studies in healthcare, from
randomized control trials to assess the effectiveness of new treatments or drugs,
to longitudinal studies of lifestyle and its impact on health. Such studies are not
common in the social care domain and it is argued that given the complex and
interacting needs of individuals, and the fact that service needs and recipients
change over time, such approaches are impossible to implement in a social care
domain [44, 45]. Whether one subscribes to this argument or not, this field
of research is clearly under-developed compared with other areas of healthcare
and this thesis goes some way to laying the foundation for further social care
Exploring the Variation in Social Care Agreement Services
The social care service is a complicated process which is difficult to manage
across the city. One way to understand service provision is to study and analyse
it from the available information collected from multiple sources, in
consulta-tion with experts. The study documented in this chapter employs spatial and
temporal analysis which, to the best of our knowledge, has not previously been
applied to social care data in the manner intended by this research. Although
some approaches had been applied by the local authority to analyse the local
government in-house information, these were reported to be less effective than
hoped and time consuming in nature. This chapter provides an understanding
of the principles of social care services and proposes alternative channels to
inte-grate the data retrieved from social care service users and technology in the form
of data analytics. To undertake the process of accessing the data, the researcher
was required to follow the Council’s internal governance processes to ensure full
compliance with relevant data protection and ethical obligations. The aim of
this research - conducted as part of BCC’s Future Council Programme - was to
investigate:
1. How data held in local authority systems can be analysed to provide
sig-nificant value and insight to the local government and community;
2. The extent to which data value is impacted when personally identifiable
attributes are retained at the most fine-grained level of analysis;
3. How the use of local authority data can inform future services planning
and delivery in Birmingham, as part of the authority’s business planning
3.1
Care Service Agreements
The data used in this study were provided in structured form. All data derived
as closed agreements (care services which have been agreed upon, commissioned
and delivered by BCC or a third party) were extracted from the BCC’s CareFirst
System, the primary information system for recording social care provision for
all vulnerable children and adults over the past 15 years. An agreement refers
to the commissioned delivery of a social service following an assessment of need.
The data were extracted using the data extraction technique from the
Coun-cil’s database that consist of more than 100 tables. An initial analysis of
Care-First showed that the total number of client records exceeded 560,000. The
data for this study was extracted from more than 100 tables; this comprised
of developing a series of queries to extract data directly from the CareFirst
database. The data generated was then joined to produce the final extract of
information. The information generated was validated throughout and checked
against the live application within the Council using Crystal Report and the
experts knowledge to ensure its integrity. In identifying the potential data held
by the local authority, it was necessary for the researchers to meet with council
staff who were cognisant of the technical capabilities of the system as well as
with the structure and format of the data that was held.
The results presented here include closed agreements for the period 2001 to
2015, inclusive, in which this research extracted and utilised only six years of
data from 2010 to 2015. This is because the research intended to understand
the variation of service provision during austerity that began after 2010 and led
to social care funding challenges. The extracted data comprised around 260,000
client records. The extracted dataset included 31,610 distinct people, registered
for a total of 119 unique council services and 360 unique elements (a service
is comprised of many different elements, which may or may not be enacted as
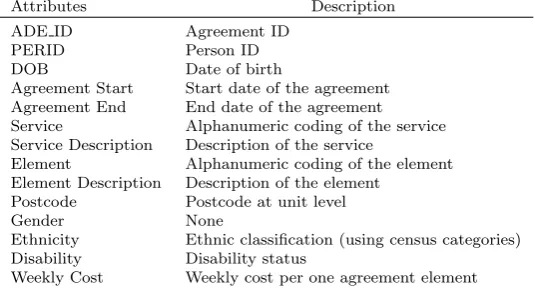
part of a delivered service agreement). Each closed agreement consisted of 18
study. The other 4 attributes such as religion, category descrition, category
sub-description and gender ID were not included in the research due to i) the
attribute is unnecessary to the analysis or redundant to the included variables
and ii) the attribute might prone to ethical issues.
Attributes Description
ADE ID Agreement ID
PERID Person ID
DOB Date of birth
Agreement Start Start date of the agreement Agreement End End date of the agreement Service Alphanumeric coding of the service Service Description Description of the service
Element Alphanumeric coding of the element Element Description Description of the element
Postcode Postcode at unit level
Gender None
Ethnicity Ethnic classification (using census categories) Disability Disability status
[image:41.595.162.430.211.358.2]Weekly Cost Weekly cost per one agreement element
Table 3.1: Records comprising a Closed Agreement and their description
ADE ID and PERID normally appear in integer form. A person ID can be
duplicated and can include one or more ADEID (agreement records in the
Care-First system) attach to the individual, but not vice versa. The Element name is
typically stored as a string comprising five or more characters characterizing a
short version of the full element description. Table 3.2 provides example service
elements and their description from Table 3.1.
Element Name Element Description
CHEFODIS Children, External, Fostering, Disabled DIRCWD Direct Payments, Children with Disabilites HSSU65PL Home Support, 65 Plus, External Community Based LDEHSQDS Learning Disability, External, Quick Discharge Service MHEBLACT Mental Health, External, Block Activity OAICINT Older Adults, Interim Care, Internal PDEHSUPP Physical Disabilities, External, Supported Living
Table 3.2: Sample service elements and their descriptions.
A simple coding strategy is employed: An element name that begins with CH
is related to children; DIR represents a direct payment; HSSU represents home
OA refers to a service element for an older adult; PD represents a service for
people with physical disabilities and, SM represents a service connected to
sub-stance misuse.
Postcode details are configured to allow the study to preserve the anonymity
of individuals but, at the same time, fine-grain enough to provide meaningful
spatial analysis. Each postcode can be divided into three levels: district, sector
and unit. An example of a relevant unit postcode is ‘B1 1AA’. The district
postcode accounts for those letters and numerals before the space, representing
part of the city, in this case ‘B1’. While the sector code includes one more
numeral after the space to display a deeper level sub-area of that district, in
this case ‘B1 1’.
The total value of the expenditure of service agreements extracted from the
3.1.1
Data Cleansing and Data-Processing
Figure 3.1: Matrix frequency heat map of all service agreement records in all postcode districts over the past 15 years
The matrix heat map highlighted data quality and allowed the research to
con-duct anomaly detection. The heat map in Figure 3.1 displays the frequency of
registered agreements for all registered recipients over 75 (of the 79) postcode
districts.
The data are further categorised into four age groups according to council
norms: Children aged 0 to 11; Young People and Adults aged 11 to 25; Adults
aged 25 to 65 and Older People aged 65 to 90. Records are retrieved for these
age ranges, see Table 3.3; note that there are some duplications of individuals,
Age Category Number of Records (approx.)
0-11 7,308
11-25 26,142
25-65 47,247
65-90 133,599
Table 3.3: Number of service agreement records in respect to the four age bands.
Figure 3.2: Workflow employed in this research
The data-processing workflow used in this research is shown in Figure 3.2.
Data ingestion, cleansing and anomaly detection are depicted in Stage 1.
Pre-processing scripts and the statistical tool R are used, removing math symbols,
conducting age range checks, misspell or typos and identifying missing values.
Of the 258,673 closed agreements study, 18,872 (7.3 per cent) are removed
be-cause of ‘bad data’; the majority of cases involve (i) missing values, (ii)
unread-able or invalid data records during data collection or extraction process, and/or
(iii) entries with value specified as unknown, invalid postcodes or out-of-range
age entries. The reason for bad data may happen during data collection and/or
data extraction processes. This stage is splitted into two paths: the analysis
derived from temporal analysis (cover Stage 2 to 5) and the analysis derived
from spatial pattern (cover Stage 6 to 8). The Stage 2 focuses analysis of all
119 services and 360 service elements to understand the dominant services in
accumu-lated cost and frequency per service element. Stage 3 employs the open-source
geographical information systems Quantum GIS (QGIS) to perform
spatial-temporal mapping using postcodes in the closed agreement services. As the
data contain postcodes, exploration is possible at the sector level analysis, at
which point the data are spatially joined with a geographic shapefile (in the
Environmental Systems Research Institute (ESRI) vector data storage format)
representing the location, shape and attributes of the corresponding geographic
unit. Coordinates are plotted using the Ordnance Survey National Grid
ref-erence system of British National Grid (BNG) with the European Petroleum
Survey Group (EPSG) Code EPSG:27700. The plugin for OpenStreetMap is
employed from the QGIS OpenLayers Plugin1. Stage 4 corresponds to the
sec-ond case study where the frequency of service elements is analysed and, with
population data, predictions are explored as to the likely increase in demand
(and cost). Postcode-level assessments are conducted to assist the Council in
business planning and budgetary objectives in relation to the policy of internal
care services presents in Stage 5. Stage 6 highlights where spatial analysis plays
an important part to help filtering data for the analysis. The study identifies
several hot spot regions in regards to the location and demand of the service
provisions. Involving input from the Council’s in-house team, those regions
proceed to Stage 8 for cost and service comparison over different age categories.
3.2
Analysis derived from Temporal Analysis
Temporal analysis of the data was performed: (i) as a single sample period
2010 to 2015 (six years in total); (ii) in two three-year sample blocks - 2010 to
2012 and 2013 to 2015; and (iii) quarterly, resulting in 24 consecutive time-series
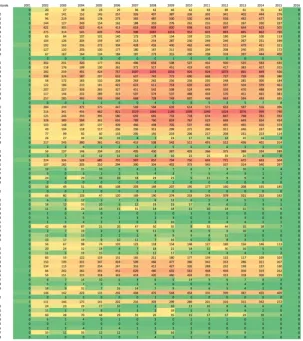
period. Analysis of services and service elements included seven of the CareFirst
data attributes. Whereas, the analysis of service users involves nine of the data
records, see Table 3.4. The analysis focused on the top ten service elements, the
top three, accounted for about 12 per cent of the total expenditure, of which
were explored further in the subsequent case studies.
Variable Name Variable Type
Postcode Spatial
Coordinates Spatial
Agreement Start Date Temporal Agreement End Date Temporal
Element Name Temporal
Element Description Temporal
Weekly Cost Temporal
Age Spatial and Temporal
[image:46.595.203.389.169.268.2]Ethnicity Spatial and Temporal
Table 3.4: The data attributes utilised in the subsequent case studies
3.2.1
Identifying the Top Ten Service Elements over time
The Council sought to identify the top ten service elements over a six-year
period, to identify the service elements with the greatest aggregated cost and
consistency of spending over the six-year period, and the service elements with
greatest aggregated frequency and impact of services with high provisioning.
Both would be fed into future analysis and modelling of social service care
provision.
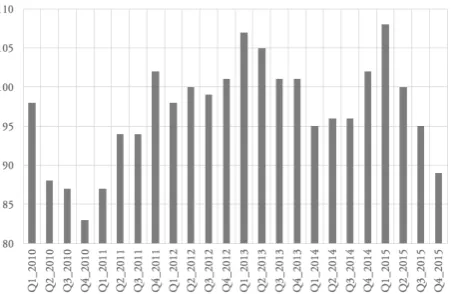
Figure 3.3 shows the top ten service elements in terms of quarterly
aggre-gated cost and the fluctuation in this cost over six years. The service
ele-ment CHIRDRT dominates and shows a steady increase in spending between
Q1 2010 and Q1 2015; Figure 3.3b reports that this service element accounts
for£54,964,000 over the six years period. Table 3.5 documents the cost of top
ten service elements for the period between 2010 and 2015; of these, more than
(a) Cost of service commission per quarter (b) Accumulative cost for each service element
Figure 3.3: Top ten service elements in terms of cost, for all age categories for the period 2010-2015
Service element Description Cost
CHIRDRT Children Internal Residential Disabled Respite £54,964,000 OAEHSGCO Older Adults External General Contracted £11,864,117 HSSU65PL Home Support 65 Plus External Community Based £9,206,837
CHEREST Children External Residential Home £8,823,100
LDESTRT Learning Disability External Short Term Residential £6,407,018 LDISTRT Learning Disability Internal Short Term Residential £6,172,000 LDISTRR Learning Disability Internal Short Term Residential £5,561,040 LDESTRR Learning Disability External Short Term Residential £4,453,364 OAELTNT Older Adults External Long Term Nursing £2,697,419 CHEFSTND Children External Fostering Standard Fee £2,609,469
Total £112,758,364
Table 3.5: Top ten service elements in terms of cost for the period 2010-2015
In addition to cost, BCC also interested in the commissioning frequency
of the service elements, as each commission required associated administrative
overhead. Figure 3.4a documents the top ten service elements in terms of
quar-terly frequency and the fluctuation in this commissioning volume over six years.
Table 3.6 reports that the amount of care services are provided to older adults