Abstract— This research work introduces a simple yet effective method for brain tumor detection using proposed dataset of 1500 images. There are different types of brain tumor; among the existing we have considered four different types i.e. CNS Lymphoma, Glioblastoma, Meningioma, and Metastases. The four major steps in the proposed method are pre-processing, segmentation, post-processing and image fusion. In the pre-processing, 2D-Adptive filter is applied to enhance the quality of the image. Otsu’s segmentation is used to extract tumor region from normal tissues. The segmented region contains skull boundaries in the form of noise; hence morphological operations i.e. erosion and dilation have been applied to remove the extra noise caused by segmentation. Overlay based image fusion is applied to get a clear visual of segmented tumor region. We achieved a detection rate of 93 percent with 7 percent error rate using this dataset. Furthermore, we classify the tumor into benign and malignant based on the size of tumor.
Index Terms— MRI imaging, image segmentation, 2D adaptive filter, image fusion.
I. INTRODUCTION
RAIN tumor is one of the life threatening diseases in both male and female. According to the National Brain Tumor Society (NBTS) USA [21], 12,000 people in US and tens of thousands or more around the world, including 35,000 people in China, will receive cure for Glioblastoma from their doctors. Glioblastoma is a highly aggressive brain tumor type and is found commonly in adults. People suffering from brain tumor and aging above 50 have a survival rate of a year or less. Similarly, less than 10 percent people can fight Glioblastoma for 5 or fewer years – sadly, with such rapid growth of technology we have not been able to improve survival rate against this deadly disease.
Tumor is an abnormal surge of tissues inside human body. Primary brain tumor grows within the brain and is further
Manuscript received January 13, 2016; revised Feb 04, 2016. Imran Ahmed, Assistant Professor, Center of Excellence in Information Technology, Institute of Management Sciences, Peshawar, KPK, Pakistan. (E-mail: [email protected]).
Qazi Nida-Ur-Rehman is corresponding author and working as a Research Associate in the same organization. (E-mail: [email protected]).
Ghulam Masood is corresponding author and working as a Research Associate in the same organization. (E-mail: [email protected]).
Muhammad Nawaz, Assistant Professor, Center of Excellence in Information Technology, Institute of Management Sciences, Peshawar, KPK, Pakistan. (Email: [email protected]).
divided into benign and malignant brain tumor. Benign is recoverable and this type of tumor normally does not spread to other brain cells. Mostly benign tumors are non- cancerous. Malignant tumor type, however, is more serious then benign, and may lead to cancer. It grows very quickly and may affect other tissues of the brain. If the tumor spreads from one organ to other, inside the body then it is known as secondary. One of the leading causes of death worldwide is due to this type of brain tumor. Root cause of brain tumor lies inside the brain (neurons, glial cells, ependymal cells) in skull, in cranial nerves or caused by cancer present in other parts of the body.
Different brain imaging technologies are used worldwide to diagnose brain tumor. These technologies provide useful information to doctors and researchers about the normal and abnormal tissues inside the brain. Magnetic Resonance Imaging (MRI) uses magnetic field to diagnose any change inside the brain and provide high quality results. Computed Tomography (CT) uses radiations to check for abnormalities inside the tissues. The advantage of MRI over CT scan is that it is not harmful to human health. We have used MRI images in our research to detect brain tumor. Medical image processing utilizes computer and MRI images to diagnose various types of tumors and other diseases. In this research work we have applied image fusion along with 2D adaptive filtering, image segmentation and morphological operations to detect brain tumor and to calculate the size/volume of the tumor.
II. LITERATURE REVIEW
The recent surveys and review work about brain tumor detection and segmentation can be found in [6] [7] [11] [20]. In early work Ahmed Kharrat et al [1] developed an algorithm for brain tumor detection using wavelet transform decomposition and k-mean clustering to classify tumor. Shaheen Ahmed et al [2] used feature extraction using Fractal dimension (FD) and Principal Component Analysis (PCA) to detect brain tumor. Shan Shen et al [3] used extended Fuzzy C-means (FCM) and artificial neural network (ANN) to detect brain tumor. Also they applied neighborhood attraction depending on features of neighboring pixels and location of these pixels have been used to detect brain tumor. J. Selvakumar et al [4] used k means and Fuzzy C-Mean (FCM) to detect brain tumor. Along with detection they computed the shape and size of tumor to make analysis easier for the physicians. El-Sayed et al [5] reveals computer aided design (CAD) based hybrid intelligent machine learning technique to detect brain tumor using MRI images. Ajaj Khan et al [8] used Grey Level
Co-Analysis of Brain MRI for Tumor Detection &
Segmentation
Imran Ahmed, Qazi Nida-Ur-Rehman, Ghulam Masood, Muhammad Nawaz
occurrence Matrix (GLCM) based geometrical features to segment brain tumor in MRI images and then performed classification using Support Vector Machine (SVM). Bjoern H. Menze at el [12] organized Brats challenge in 2012. The dataset of Brats challenge was made publically available by the organizers. In this challenge the contributors proposed different methods for segmentation of brain tumor. Zhan et al [10] used multispectral MRI images to segment brain tumor. They took intensity as a feature to detect normal and abnormal brain tissues and classified them using sparse representation and Markov Random field regularization. Artzi et al [9] proposed an automatic method in order to identify enhanced tumor areas in patients having Glioblastoma brain tumor, using dynamic contrast enhancement with dynamic susceptibility contrast. SVM was used to classify the results. Ghosh et al [13] used three features i.e. Intensity-based, symmetry-based and texture-based methods to segment tumor region from T1 and T2 MRI images using refractive index analysis and principle component analysis. Asra Aslam et al [14] present an edge based algorithm for brain tumor detection, they have used Sobel operator to detect brain tumor using the intensity information of the MRI image. Nabizadeh et al [15] used two feature based techniques i.e. Gabor wavelet features and statistical features. The method used to detect and segment brain tumor is based on histogram asymmetry between the two brain hemispheres. Mark Schmidt et al [16] explored and evaluated the performance of four existing alignment based features for tumor segmentation and used soft margin SVM for segmenting tumor and edema from brain MRI images. Dahab et al [17] used learning vector quantization to detect brain tumor and a probabilistic neural network is applied to classify the tumor. Ahmed et al [18] detected brain tumor using T1, T2 and PD weighted gray scale brain MRI images; they combined two models Perona and Malik Anisotropic with Kmeans clustering for segmentation of brain tumor. Salman et al [19] applied watershed segmentation with morphological operations to detect brain tumor. Image fusion is applied on MRI and CT images for improving the detection of brain tumor.
III. DATASET
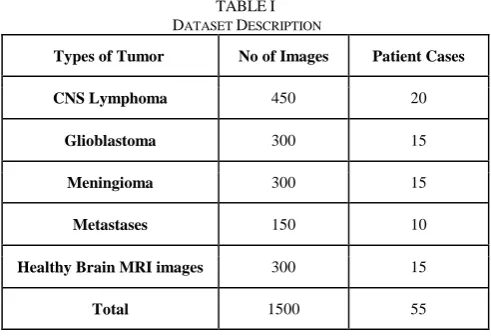
Our dataset as described in Table 1 consists of 1500 MRI images. Dataset contains 300 healthy brain MRI images collected from different online resources. Radiopaedia [22] contains real cases of patients, 1200 tumor images were obtained from Radiopaedia. As per our knowledge, till yet, these images have not been considered for brain tumor detection in image processing. As aforementioned our dataset contains four different types of tumor CNS Lymphoma, Glioblastoma, Meningioma, Metastases.
MRI images contain multiple modalities. MRI modalities that we have considered for our dataset include Sagittal, Axial, Flair, Transversal, T1, Coronal, and T2. All these variations can be seen in Fig 1.
Fig 1. Sample of MRI images from our dataset shows variations of different MRI modailities.
Since we are working on four types of brain tumor, for this purpose we have developed our own dataset which contains 1500 images of the aforementioned types. The ground truth information about tumor types and size etc. in these images were verified from an experienced neurosurgeon.
IV. METHODOLOGY
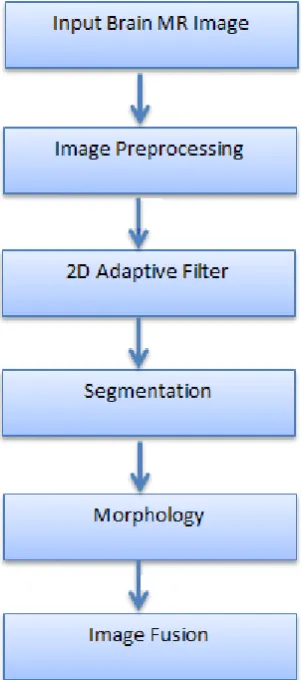
The proposed method consists of five major steps as described in Fig 2. Each input MR Image is resized and 2D adaptive filter is applied to remove noise and distortions. Otsu segmentation extracts tumor area and morphology is applied to remove boundaries and skull from the segmented image. Finally image fusion is applied to get better visual. The flowchart of our algorithm is given below.
TABLEI DATASET DESCRIPTION
Types of Tumor No of Images Patient Cases
CNS Lymphoma 450 20
Glioblastoma 300 15
Meningioma 300 15
Metastases 150 10
Healthy Brain MRI images 300 15
[image:2.595.305.551.317.485.2]Fig 2. Proposed Algorithm: Input brain MRI image after preprocessing is passed from 2D adaptive filter to remove noise. Otsu segmentation is applied to extract tumor region.Morphological operation is applied to remove boundaries from the tumor area caused by Segmentation. Image Fusion is applied to obtain better and detailed visual of the results.
A. Image Preprocessing
Image Resizing
Images produced by MRI machine have different sizes. In order to achieve better segmentation results we resize all the images to a fixed resolution of 630x630 pixels. For resizing the images we use bicubic interpolation, which uses 4x4 neighborhood pixel of known values.
The mathematical representation of bicubic interpolation is:
Where u is one-dimensional interpolation function. The points x, y show distances from the end points in each direction. Non boundary points can be computed by the following equation.
(2) 2D Adaptive Filter
We have used Wiener 2D adaptive filter to eliminate noise which has affected the image. The 2D adaptive filter reduces the mean square error as much as possible. The
calculation of mean and variance can be seen in, equation 3 and 4 respectively.
(3)
(4)
The result obtained after applying Wiener filter as showed in Fig 3, resized image containing smoother display can be viewed as result of resizing and Wiener filter operation.
(a) Input Brain MRI (b) Wiener Filter Fig 3. Preprocessing Step (a) Input image is displayed and (b) shows the result of 2D adaptive filter. It can be seen that the (b) is much smooth after processed with Wiener filter.
B. Otsu’s Segmentation
Otsu’s is a clustering based approach for image segmentation. The algorithm makes the assumption that image has two classes of pixels following bimodal histogram. The algorithm first separates the pixels into two clusters according to the threshold and then computes the mean for each cluster respectively. It squares the differences between the means and multiplies the total pixels in one cluster times over total pixels in other cluster.
The main steps of Otsu’s algorithm are described as follow:
In the first step of Otsu’s the pixels are divided into two clusters.
Compute mean value for every pixels cluster.
When mean value for every cluster is determined, find the square of difference for each cluster respectively.
Number of pixels in one cluster multiplied by number of pixels in other cluster.
The weighted class variance can be calculated using: (5) Where wiis the probability separated by h threshold, is
variance. Variance among the classes can be computed using the following equation:
(6) The class probability for w1 (h) at histogram h can be calculated using the preceding equation:
(7) While the class mean is derived from the following equation:
[image:3.595.93.244.61.402.2] [image:3.595.353.548.85.131.2] [image:3.595.320.531.185.256.2]After the tumor image is segmented using Otsu it gives us an image with noise i.e. skull boundaries as it can be seen in Fig 4.
(a) Wiener Filter (b) Otsu’s Segmentation Fig 4. (a) Shows the result of preprocessing (b) shows the result generated by Otsu’s segmentation. From image (b) we can see that Otsu’s threshold binaries the image.
C. Morphological Analysis
Morphological techniques inquest an image with a stencil called structuring element. Structuring elements also called kernel, is a pattern of numbers that are convolved on the image to apply some special effect to obtain the desired result. In our algorithm we have used morphology for removing the outer boundaries of the skull. The result of the morphology operation is shown in Fig 5, we can see that the boundaries are removed from the image hence leaving only the tumor area in the final image.
(a) Otsu’s Segmentation (b) Morphology Operation Fig 5. (a) shows the result obtained by Otsu’s segmentation (b) shows the result obtained after applying morphological operation. Boundary pixels and extra infromation from (a) were removed using morphological erosion and only tumor area in (b) can be seen.
D. Image Fusion
Combining multiple images to form single composite image containing better description of the object then the input image without distortion or loss of actual information.
In our algorithm we have used overlay base image fusion, in this fusion method a set of images of same modalities are considered and fused with the resultant image of morphological operation to obtain a better description, the aim of using overlay based image fusion in medical images is to detect the change of organs.
[image:4.595.53.285.99.164.2]In order to get accurate visualization of tumor area we fuse the gray scale image and the image obtained after post processing. Fused image with better visual can be seen in Fig 6.
(a) Grayscale (b) Post processed (c) Fused Image Fig 6. (a) shows the gray scale image (b) shows the resultant post processed image (c) shows fused image result. (a) is grayscale image with tumor image prominent and (b) is image obtained after morphology. Both of these images were fused to get better visualization (c).
V. RESULTS AND DISCUSSION
Input image after preprocessing is segmented using Otsu segmentation. The segmented image contains noise which is removed by using morphological operation. Finally overlay based image fusion is applied to enhance the visibility of the tumor region. After detecting the tumor, we classify the MRI images firstly as healthy or tumor images and then the tumor images are further classified into benign or malignant. To calculate the size of tumor we convert the final image to binary form. The white pixels show the tumor area and these white pixels also called as foreground pixels are used to calculate the size of tumor.
The number of foreground pixels can be described by,
P = Tumor Pixels (9)
Where,
1 pixel = 0.264 mm2 (10)
To compute the size of tumor we take the square root of number of pixels and multiply number of pixels with size. The detailed equation is given by,
mm2 (11) Based on size of tumor we have done two types of
classifications. First we classify the image into healthy or tumor image. Tumor images are further classified into benign or malignant to determine the level of tumor in the patient.
After calculating size of tumor basic threshold of 8mm2 is set to classify the image as tumor or healthy images. The values classified above 8mm2 are considered as tumor images and those below 8mm2 are classified as healthy images. Table II. Shows the classification result of images into healthy or tumor affected MRI images.
TABLE II
CLASSIFICATION RESULTS FOR WHOLE DATASET
Type of MRI Image
Number of Images
TC FC TC
% FC %
Healthy Brain 300 281 19 94 6
Tumor Affected
1200 1110 90 93 7
Total 1500 1391 119 93 7
From Table II we can see that the overall accuracy achieved by the proposed method is 93 percent. For Healthy MRI images the accuracy rate achieved is 94 percent as true classified (TF) and only 6 percent results were false classified (FC). Tumor affected MRI images resulted 93 percent values to be true classified (TF) and 7 percent values were false classified (FC).
[image:4.595.51.288.353.413.2] [image:4.595.46.291.658.731.2]classification result of images into benign and malignant tumor.
TABLE III
CLASSIFICATION RESULTS FOR TUMOR IMAGES
Images Types Number of Images
Benign Tumor 409
Malignant Tumor 703
True Classified Tumor 1110
Classification of tumor images into benign or malignant can be observed in Table 3. Out of 1110 tumor images, 409 were classified as benign tumor and 703 were classified into malignant tumor.
[image:5.595.57.281.316.475.2]Fig 7, shows classification results of healthy brain samples. Out of 300 healthy brain MRI images from the proposed dataset 281 were true classified and 19 images were false classified. From Fig 7, a baseline of 8mm2 can be observed, the values below the baseline are true classified and values above the baseline are false classified.
Fig 7. shows the result of healthy brain images. It can be seen that only few of the healthy brain samples were false classified.
[image:5.595.56.280.592.756.2]Fig 8, shows classification results of tumor images. Out of 1200 tumor images from the proposed dataset 1110 were true classified and 90 were false classified. From Fig 8, a baseline of 8mm2 can be observed, the values below the baseline are false classified and those above the baseline are true classified.
Fig 8. shows the result of brain images containing Tumor.Out of the 1200 samples only few images were false classified, images values below the line are false classified and values above the line are true classified.
VI. CONCLUSION
In this paper a dataset of 1500 brain MRI images is proposed. The dataset contains 1200 tumor affected and 300 healthy brain MRI images. Four types of brain tumor i.e. CNS Lymphoma, Glioblastoma, Meningioma, and Metastases can be successfully detected using the proposed method. Different modalities of MRI images are available in dataset for each of the tumor type. In the proposed method 2D adaptive filter along with Otsu segmentation is applied to segment the tumor region from normal tissues. Morphological operation and image fusion is applied to make the tumor area prominent for analysis. After the detection of tumor we compute the size of tumor which will make decisions easy for the physicians.
Overall in this study we have introduced a dataset for the most prominent types of brain tumor. We have also developed a method to detect and classify the tumor and achieved 93 percent accuracy. In future our dataset can be used to determine the grades of tumor in patients with the mentioned types of tumor.
ACKNOWLEDGMENT
Being non-medical students we are very thankful to Dr. Muhammad Usman Khan (FCPS Neurosurgeon) for his guidance in our research work. He helped us to gather the dataset for this research work and provided ground truth information about the tumor size and verified our results.
REFERENCES
[1] Kharrat Ahmed, Nacéra Benamrane, Mohamed Ben Messaoud, and Mohamed Abid.. "Detection of brain tumor in medical images." Signals, Circuits and Systems (SCS), 2009 3rd International Conference on. IEEE, 2009.
[2] Ahmed Shaheen, Khan M. Iftekharuddin, and Arastoo Vossough. "Efficacy of texture, shape, and intensity feature fusion for posterior-fossa tumor segmentation in MRI." Information Technology in Biomedicine, IEEE Transactions on 15.2 (2011): 206-213.
[3] Shen Shan, William Sandham, Malcolm Granat, and Annette Sterr. "MRI fuzzy segmentation of brain tissue using neighborhood attraction with neural-network optimization." Information Technology in Biomedicine, IEEE Transactions on 9.3 (2005): 459-467.
[4] Selvakumar J, A. Lakshmi, and T. Arivoli. "Brain tumor segmentation and its area calculation in brain MR images using K-mean clustering and Fuzzy C-K-mean algorithm." Advances in Engineering, Science and Management (ICAESM), 2012 International Conference on. IEEE, 2012.
[5] El-Dahshan El-Sayed A, Heba M. Mohsen, Kenneth Revett, and Abdel-Badeeh M. Salem. "Computer-aided diagnosis of human brain tumor through MRI: A survey and a new algorithm." Expert Systems with Applications 41.11 (2014): 5526-5545.
[6] Bauer Stefan, Roland Wiest, Lutz-P. Nolte, and Mauricio Reyes.. "A survey of MRI-based medical image analysis for brain tumor studies." Physics in medicine and biology 58.13 (2013): R97. [7] Gordillo Nelly, Eduard Montseny, and Pilar Sobrevilla. "State of the
art survey on MRI brain tumor segmentation." Magnetic Resonance Imaging 31.8 (2013): 1426-1438.
[8] Khan Ajaj, and Ms Nikhat Ali Syed. "Image Processing Techniques for Automatic Detection of Tumor in Human Brain Using SVM." Image Processing Techniques 4.4 (2015).
[9] Artzi Moran, Deborah T. Blumenthal, Felix Bokstein, Guy Nadav, Gilad Liberman, Orna Aizenstein, and Dafna Ben Bashat. "Classification of tumor area using combined DCE and DSC MRI in patients with glioblastoma." Journal of neuro-oncology 121.2 (2015): 349-357.
[11] James A.P., Alex Pappachen, and Belur V. Dasarathy. "Medical image fusion: a survey of the state of the art." Information Fusion 19 (2014): 4-19.
[12] Menze, Bjoern, Mauricio Reyes, and Koen Van Leemput. "The multimodal brain tumor image segmentation benchmark (BRATS)(2014)." URL http://hal. inria. fr/hal-00935640.
[13] Ghosh Sushmit, Soham Kundu, Sushovan Chowdhury, and Aurpan Majumder. "Optimal Statistical Structure Validation of Brain Tumors Using Refractive Index." Procedia Computer Science 57 (2015): 168-177.
[14] Aslam Asra, Ekram Khan, and MM Sufyan Beg. "Improved Edge Detection Algorithm for Brain Tumor Segmentation." Procedia Computer Science 58 (2015): 430-437.
[15] Nabizadeh Nooshin, and Miroslav Kubat. "Brain tumors detection and segmentation in MR images: Gabor wavelet vs. statistical features." Computers & Electrical Engineering (2015).
[16] Schmidt Mark, Ilya Levner, Russell Greiner. "Segmenting brain tumors using alignment-based features." Machine Learning and Applications, 2005. Proceedings. Fourth International Conference on. IEEE, 2005.
[17] Dahab Dina Aboul, Samy S.A. Ghoniemy, and Gamal M. Selim. "Automated Brain Tumor Detection and Identification Using Image Processing and Probabilistic Neural Network Techniques." International journal of image processing and visual communication 1.2 (2012): 1-8.
[18] Ahmed M. Masroor, and Dzulkifli Bin Mohamad. "Segmentation of brain MR images for tumor extraction by combining kmeans clustering and perona-malik anisotropic diffusion model." International Journal of Image Processing 2.1 (2008): 27-34. [19] Salman Saif D., and Ahmed A. Bahrani. "Segmentation of tumor
tissue in gray medical images using watershed transformation method." International Journal of Advancements in Computing Technology 2.4 (2010).
[20] Balafar M. A., Ramli A. R., Saripan, M. I., and Mashohor, S."Review of brain MRI image segmentation methods."Artificial Intelligence Review 33.3 (2010): 261-274.
[21] National Brain Tumor Socity,[online] 2008, http://braintumor.org/ (Accessed: 17 November 2015).