Construct-A-Vis:
Exploring the Free-Form Visualization Processes of Children
Fearn Bishop, Johannes Zagermann, Ulrike Pfeil, Gemma Sanderson, Harald Reiterer, Uta Hinrichs
Abstract—Building data analysis skills is part of modern elementary school curricula. Recent research has explored how to facilitate children’s understanding of visual data representations through completion exercises which highlight links between concrete and abstract mappings. This approach scaffolds visualization activities by presenting a target visualization to children. But how can we engage children in more free-form visual data mapping exercises that are driven by their own mapping ideas? How can we scaffold a creative exploration of visualization techniques and mapping possibilities? We present Construct-A-Vis, a tablet-based tool designed to explore the feasibility of free-form and constructive visualization activities with elementary school children. Construct-A-Vis provides adjustable levels of scaffolding visual mapping processes. It can be used by children individually or as part of collaborative activities. Findings from a study with elementary school children using Construct-A-Vis individually and in pairs highlight the potential of this free-form constructive approach, as visible in children’s diverse visualization outcomes and their critical engagement with the data and mapping processes. Based on our study findings we contribute insights into the design of free-form visualization tools for children, including the role of tool-based scaffolding mechanisms and shared interactions to guide visualization activities with children.
Index Terms—Visualization in Education; Visualization with Children, Qualitative Evaluation; Visualization System and Toolkit Design
1 INTRODUCTION
Visualization has become a ubiquitous tool to communicate data in our personal and work lives. Children are no exception to this, and curricula as early as elementary school emphasize the importance of data analysis skills [11]. The question of how to build visualization literacy skills from an early age, including the ability to both create and interpret visualizations [9], is therefore becoming increasingly important. While visual representations form a prominent part of paper-based elementary school teaching materials [1], research on how children engage in visualization processes, and how to design visualization tools that introduce them to visualization concepts is still in its infancy. Notable approaches guide visualization creation with templates (see, e.g., [1]) which encourages children’s understanding of links between different visual representations via completion exercises, but limits the extent to which they can incorporate their own ideas and creativity into their visualizations. Allowing children to explore their own ideas when visually representing a data set may lead to a more grounded understanding of how to represent and communicate data, and the use visualization to facilitate problem solving and decision making. However, visualization tools for children that allow the free-form visualization creation do not currently exist, and we lack studies that explore whether and how such an approach can be productive.
Our research starts to fill this gap by exploring how to design free-form visualization tools for children that allow the creative creation of visualizations without step-by-step guidance and templates. We focus in particular on elementary school children’s visualization processes using a free-form visualization tool. Are they able to create meaningful visualizations? Can a free-form tool promote a creative and critical engagement with different visual representations and, if so, how?
We have investigated these questions from a design and empirical perspective via Construct-A-Vis, a tablet-based constructive visualiza-tion tool for children which was designed to facilitate creative
explo-• Fearn Bishop and Uta Hinrichs are with the University of St Andrews, St Andrews, UK. E-mail:{fab3, uh3}@st-andrews.ac.uk.
• Johannes Zagermann, Ulrike Pfeil, and Harald Reiterer are with the University of Konstanz, Konstanz, Germany. E-mail:{johannes.zagermann, ulrike.pfeil, harald.reiterer}@uni-konstanz.de.
• Gemma Sanderson is with Fife Council, Glenrothes. UK. E-mail: [email protected].
[image:1.612.313.570.275.436.2]Manuscript accepted July 8, 2019 to be included in the VIS’19 proceedings. This is a pre-print to appear in IEEE Transactions on Visualization and Computer Graphics. Date of current version July 29, 2019.
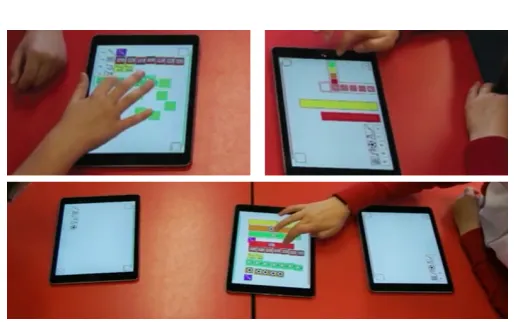
Fig. 1. Two children working with the Construct-A-Vis tool.
ration of different visual mappings. Construct-A-Vis is based on design principles we derived from literature in education and visualization including (1)‘a focus on free-form visualization creation, (2) mak-ing data-to-visual mappmak-ings explicit, (3) providmak-ing visual scaffoldmak-ing without prescribing a visual mapping process, (4) allowing for tool configurability by teachers to cater for different skills, and (5) support of shared activities as is common in elementary school classrooms. Studying children’s individual and shared visualization activities using Construct-A-Vis revealed a creative and critical engagement in the process, evident in a range of different visualizations and in the way in which children used their visualization to interrogate and communicate the data at hand. Our study shows the potential of digitally supported constructive visualization activities, and raises interesting questions on how to balance free-form visualization creation and scaffolding to support a meaningful engagement of children with data visualization. 2 BACKGROUND
We contribute to research on digital technologies and visual interfaces for children to be used in educational settings (e.g., [1, 17, 23, 36]) by investigating how to digitally support free-form visualization creation with elementary school children and the visualization processes this approach enables. Our research is informed by the fields of education (including educational technologies) and visualization.
2.1 Visual Representations in Education
which children are taught various forms of abstract representation can inform the design of tools to support their visualization activities.
Since the advent of Fr¨obel’s gifts, physical objects have been used to teach young children abstract concepts (e.g., numeracy skills) [5]. The use of physical materials has been shown to have two main educational benefits: (1) to help childrenoffload cognitionby providing physical traces of thought processes and (2) to provideconceptual metaphors to help them relate concepts to their real-world experiences [23]. The learning theory of Constructionism, as pioneered by Papert, suggests thatproblem-based learningin which children actively engage with ma-terials to solve problems can help build their understanding of abstract concepts [30]. These ideas have been applied in digital form, for ex-ample, through the ‘Scratch’ programming environment, which allows children to build and structure computer code in the form of blocks, using affordances similar to real-world materials [34]. Constructionism has also motivated the paradigm ofConstructive Visualizationthat pro-motes visualization processes usingsimple, expressive, and dynamic means [19]. Our work contributes an exploration of how this paradigm can be applied digitally to facilitate visualization with children.
2.2 Visualization with Novices
Visualization has become prevalent outside of work environments, and its audience has broadened beyond domain experts. As such, research on engaging novices (i.e., people who are not trained in creating or reading visualizations) has emerged as a topic in the field. This in-cludes the definition ofvisualization literacyto describe and measure a person’s ability to read and create visualizations [6]. The study of novice adults’ visualization literacy and their processes of creating vi-sualizations informs research on facilitating visualization with children who can be considered a special group of visualization novices.
Investigating visualization processes using Tableau, Grammel et al. found that translating questions into data attributes, designing visual mappings to answer specific questions, and interpreting information from the resultant visualization are all challenging processes for adults not trained in visualization [13]. To explore the paradigm of Construc-tive Visualization which promotes an alternaConstruc-tive, simple yet expressive, approach to the visualization process, Huron et al. observed adult novices constructing visualizations using simple physical tokens. They found that participants created visualizations with relative ease, follow-ing diverseconstruction, computation, and storytellingactivities [20].
The Constructive Visualization paradigm has also informed the de-sign of new digital visualization tools. iVoLVER supports one-to-one visual mappings of individual data points, rather than by-attribute [28]. Studies with adult novices showed that this approach, compared to using off-the-shelf tools such as Tableau, leads to more transparency of the mapping process, and also encourages a more thoughtful creation process driven by the user rather than the tool [26]. Notable trade-offs include efficiency. However, allowing transparency and the active con-struction of visual representations data point-by-data point also seems a sensible approach when teaching visualization processes to children.
2.3 Visualization Tools for Children
In 1996 Schneider reviewed existing visualization techniques for their suitability in usage scenarios for children [35]. However, this did not result in the emergence of visualization tools for children. Visualiza-tion research focusing on young audiences is still in an early stage. Consolidating previous research, we discuss the aspects that need to be considered when building visualization tools for children.
Visualization Activities. In their survey of the use of data-driven visualizations in elementary school teaching material Alper et al. iden-tify three different types of typical visualization activities: reading exercises, where children interpret a given visualization,completion exercises, where children fill-in or expand a given visualization tem-plate, andcreation exercises, where children create a visualization from scratch [1]. These activities in combination are important for building visualization literacy skills. InC’est la Vis, a tool which encourages children to engage with different visualization types, including a spec-trum of concrete and abstract mappings [1], visualization creation is
strongly guided by given templates. Preliminary research on token-based free-form visualization creation with children, which directly follows up on Huron et al.’s studies with adults [20], has shown that applying a constructive visualization approach using physical tokens with young audiences may have merit [2]. Our work investigates how to support free-form visualization creation in the digital realm.
Visual Mapping Paradigms. In their review of visualization tools, Grammel et al. identify two methods of how such tools allow users to specify visual mappings of data. Indata-driven visual mapping processes, data attributes are assigned to a visual element, while in visualization-driven mappinga visual element is created first and then assigned to data [12]. Most commercial tools (e.g., Excel or Tableau) enforce the mapping of data attributes to visuals; all values of an at-tribute are mapped in a single step. In contrast, tools such as iVoLVER support a constructive approach where the user has to attend each data point and corresponding values one-by-one [28]. We have already dis-cussed that the constructive visualization paradigm can be beneficial for promoting transparency and design intention as part of the visualization process. Furthermore, the mapping paradigm of a visualization tool greatly influences the visualization process in terms ofagency(i.e., whodrives the creation process—the user or the tool), andgranularity (i.e.,whatcan be manipulated—the data by-value or by-attribute) [27]. We investigate the potential of the constructive, visualization-driven mapping paradigm for visualization authoring tools for children.
Scaffolding & Guidance. Scaffolding, defined as“the process that enables a child or novice to solve a problem, carry out a task, or achieve a goal which would be beyond his unassisted efforts”[40], is used in education to help children acquire new knowledge and skills. Such support to promote learning can take different forms including learning resources, templates and engaging tasks. One form of support is guidance, which often involves giving feedback. Feedback can be provided occasionally (e.g., as a follow-up on an incorrect answer [3]), or continuously throughout the problem solving process [18]. The timing of feedback has shown to affect learners’ understanding and en-gagement, suggesting that immediate feedback supports rapid problem solving, while delayed feedback can result in better retention and trans-fer [39]. The design of educational applications can rely on feedback provided only by the application, or with external feedback in mind (e.g. by a teacher) to help children learn. We designed with a classroom setting in mind, where feedback given by the application is intended to be supplemented with feedback and guidance from a teacher.
Gradual Skill Development. It is important to develop children’s abilities and skills depending on their age and practice. Activities should also consider the zone of proximal development (ZPD); the sweet-spot where a task is neither too simple nor too difficult for a child to complete [38]. To address this in the context of building visualization literacy the concreteness fading approach [10] has been suggested [1], where children transition from concrete to abstract representations of data. Alper et al. illustrate one method to support this via visualization templates and completion activities [1]. In contrast, we consider how visual variables (e.g., colour, shape, or size) can be configured by the teacher to teach children different types of visual data mappings according to their skill levels as well as learning objectives, while still enabling free-form visualization creation.
Shared Interactions. Shared and collaborative interactions with peers are an important and beneficial element of elementary school classroom activities [22, 29, 36], and they often occur spontaneously [1, 9, 24]. In the context of visualization where multiple visual mappings of a single data set are possible, peer discussion and reflection can facilitate visualization literacy. However, while research has discussed supporting collaborative visualization processes for adult users [16, 21, 31], work on shared visualization tools for children does not exist. Our work explores how to design for shared visualization activities and their impact on children’s visualization processes and outcomes.
3 CONSTRUCT-A-VIS
research approach. We designed a technology probe [4, 37] following learning objectives and design principles grounded in previous work.
3.1 Learning Objectives & Design Principles
The learning objectives and corresponding design principles (P1–P5; in bold) below guided the design of our technology probeConstruct-A-Vis.
3.1.1 Creative Exploration of Different Visual Mappings
There are many ways of visually representing a single data set, and visualization literacy skills include the ability to distinguish good vi-sualizations (which“amplify cognition”[8]) from less effective ones. The learning objective of allowing children to explore different visual mappings is emphasized in elementary school curricula as a desired learning outcome:“I have explored a variety of ways in which data is presented and can ask and answer questions about the data it con-tains”[11]. Visualization templates can help to expose children to various visualization techniques but also enforce specific mapping approaches. Our objective is to allow children to follow their own ideas when creating visual data mappings, in order to promote a more grounded understanding of how different visual mappings can be used to present and communicate data and facilitate problem solving and de-cision making. Designing forFree-form Visualization Creation [P1] in which children can make their own visualization design decisions without explicit step-by-step guidance or templates was therefore an important principle of our design process.
3.1.2 Highlight Links Between Data and Representation
Core to visualization literacy is the ability to“interpret visual patterns in the visual domain as properties in the data domain”[6]. To actively develop this skill, children need to consider the relationship between the data values and their corresponding visual representation during the visualization process. The Constructive Visualization paradigm [19] specifically encourages such reflections, and has been shown to be beneficial when introducing novice adults to visualization [26]. We explore the potential of applying this paradigm to visualization tools for children byMaking Data to Visual Mappings Explicit [P2].
3.1.3 Encouraging Valid Visual Data Mappings
While free-form visualization creation leverages children’s creativity, it is also important to teach good visualization practices. The ability to recognize less desirable visual mappings is highlighted as a goal in school curricula:“Having discussed the variety of ways and range of media used to present data, I can interpret and draw conclusions from the information displayed, recognizing that the presentation may be misleading”[11]. Scaffolding via feedback can allow for free-form visualization creation while guiding children toward valid visual representations. We aimed toSupport Scaffolding [P3] via visual feedback, informing but not intervening with the visualization process.
3.1.4 Support Learning Transitions
Children, even within the same year of elementary school, differ in their development and skills. Hence, visualization tools for children should cater for different abilities. We aimed to design a tool that could be configured by a teacher depending on learning objectives and children’s skill levels (Configurability [P4]). For example, a teacher could con-strain the mapping choices in order to teach a certain type of mapping, or configure the tool to help children to transition from more intuitive, concrete to more abstract mappings (concreteness fading [10]).
3.1.5 Learning from Peers
[image:3.612.317.569.48.141.2]Shared interactions with visualization tools have shown potential to encourage children to critically engage with learning activities [1, 9], although formal studies have yet to be conducted. Collaboration and the critical discussion of concepts with others is also encouraged in school curricula concerned with visualization (e.g.,“[I] have worked with others to collate, organize and communicate results in an appropriate way”[11]). As such, we aimed to develop a visualization tool for children that would support both individual andShared Activities [P5].
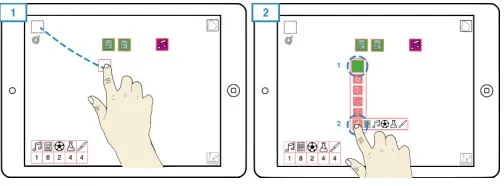
Fig. 2. Creating (1) and modifying (2) tokens in Construct-A-Vis.
3.2 Construct-A-Vis Design
Construct-A-Vis is a tablet-based visualization tool for children that we implemented following the above learning objectives and corresponding design principles. The tool was developed in an iterative design process, in close collaboration with an elementary school teacher to ensure that it would 1) support visualization activities typical in elementary school classrooms and 2) enable an active style of teaching [32]. Construct-A-Vis is a browser-based app implemented using the JavaScript libraries Fabric.js1for the visualization front-end, and Meteor2for the back-end.
We tested an early version with two elementary school teachers, four usability experts, two visualization researchers, and four adult visual-ization novices. Pilot participants’ experiences and feedback resulted in design refinements, mostly in terms of usability. Below we describe the design of Construct-A-Vis in relation to our design principles and how a child may use the tool to create their own visualizations.
3.2.1 The Visualization Process in Construct-A-Vis
Our key interest when designing Construct-A-Vis was to explore chil-dren’s visualization processes when given a free-form visualization tool [P1] that does not strictly guide activities and requires explicit visualization decisions at a granular level. In Construct-A-Vis, children create“tokens”and can alter their individual visual properties to en-code data.When the tool is started, children are presented with a blank canvas and a small set of data presented in tabular form (Fig. 2; bottom left3). The children can create, manipulate, and position tokens on this canvas to visually represent the given data set. To create a token a child places their finger on the“token pool”and drags out a new token, which begins its life as a colorless square (Fig. 2.1). A double-tap on the token brings up a menu of visual properties (color, shape, size, and adding icons) that can be manipulated to alter the token’s visual appear-ance. From here, the child can select from the options presented for the different visual properties (Fig. 2.2). Most properties are presented as a finite list of options. For example, a set of icons, colors or shapes is shown when opening the corresponding menu (Fig. 2.2). In contrast, token size is altered using a number dial invoked from the menu. We considered using a pinch gesture here but opted for a way that allows for more precise adjustments and that provides access to all visual properties from the same menu. Tokens can be freely arranged on the canvas using a dragging action, and multiple tokens can be grouped and moved together using a lasso tool activated by a button to the top right on the canvas (see a demo video of Construct-A-Vis on our website)4.
3.2.2 Scaffolding Data Mappings via Visual Feedback
To encourage reflection on visualization outcomes and good visualiza-tion practices as part of free-form visualizavisualiza-tion [P3], Construct-A-Vis provides unobtrusive visual feedback that is integrated into the data table (see Fig. 3). The feedback mechanism aims at addressing the learning goal of using visual variables consistently to represent certain attribute levels, and to construct valid mappings of quantitative data aspects. The table cells’ colors indicate how well children’s use of a specific visual property reflects on the provided data values, without enforcing particular visual mappings. Feedback can be provided for one visual property at a time (color, shape, size or icon), as configured
1http://fabricjs.com/
2https://meteor.com/
Fig. 3. Linking coloured tokens to data points for feedback.
by the teacher [P4]. An icon below the token pool shows which vi-sual property is currently used for feedback. In order to get feedback, children have to make their visual mappings explicit [P2], by linking tokens to the corresponding data points in the table. Links are created via a dragging gesture from the data point in the table to the token that represents the desired mapping. In Figure 3.1, for example, a child has created six tokens, and colored five of these in purple. The child makes a dragging gesture from the first data point in the table to one of these purple tokens. Since tool feedback is set to focus on color, the tool assumes a consistent use of color to represent the data point and compares the number of purple tokens with the corresponding data value “6” in the table—there is one purple token missing as indicated by an orange bar in the table cell. In Figure 3.2 the child has created an additional purple token, so the table feedback shows a full green bar for the corresponding data point. However, the child has also created three orange tokens linked to the next data point. Here, the table turns red, as the number of tokens does not match the corresponding data value (“2”). For visual mappings of categorical data (color, stamp, or shape), tool feedback considers the number of tokens with the visual property in focus. For visual mappings to quantitative data (size) the tool considers the area of an individual token. Links between tokens and data points can be made visible on demand (see Fig. 3.2.)
3.2.3 Collaborative Activities
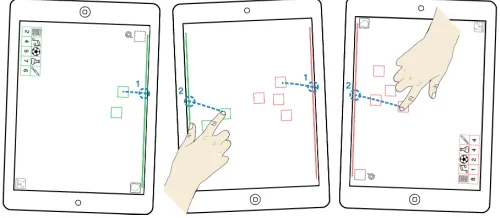
[image:4.612.45.295.511.620.2]Construct-A-Vis features a collaboration mode that supports the shared creation of visualizations between two children [P5]. Given the tablet size, this mode assumes onepersonaltablet per child and ashared tablet (Fig. 4). Children can individually create and alter tokens, and tokens can be transferred onto the shared tablet to create a shared visualization. The border of tokens is colour coded to indicate the tablet they were created on. To move tokens onto the shared tablet, children drag them toward the tablet’s border (red or green line; Fig. 4). The tokens will disappear from the child’s tablet and appear on the shared one. This technique is similar to Marquardt et al.’sPortals[25], but does not require additional hardware (e.g., [33]) to allow for easy setup.
Fig. 4. Tokens are shared by transferring across color-coded lines.
3.2.4 Configuration Options
While young children can be competent technology users [24], in-troducing specific visualization concepts incrementally can be impor-tant [1, 10]. Construct-A-Vis provides a configuration screen for teach-ers, separate from the main application, to configure the tool for all participants according to their learning objectives and children’s abili-ties [P4]. The idea is to support the concreteness fading approach by allowing the gradual introduction of more advanced visualization con-cepts over time [10]. By making selections in a simple user interface teachers can adjust the visual properties to be manipulated by children.
For example, younger children may only be allowed to place icons on a token to represent data, while older children can be provided an ex-panded set of properties (including size to represent quantitative data). Teachers can configure the visual feedback mechanism to focus on a particular visual property or disable it. They can also set up the appli-cation for individual or collaborative use. Following discussions with elementary school teachers we implemented the ability to ‘lock’ the vi-sualization canvas to prevent children from altering their vivi-sualizations; ensuring children are not distracted during in-class discussions.
4 STUDYINGCONSTRUCT-A-VIS WITHSCHOOLCHILDREN We conducted a qualitative study at a local elementary school to observe Construct-A-Vis in-use, focusing on three questions in particular:
Q1: Can children create meaningful visualizations with a free-form tool such as Construct-A-Vis without structured guidance or tem-plates, and can it help engage children with different types of visual representations?
Q2: What kind of processes do children follow when creating visual-izations individually and in groups?
Q3: Can a free-form visualization tool such as Construct-A-Vis pro-mote an active and critical engagement with data visualization among children and, if so, how?
4.1 Participants
Our study was conducted at a small local elementary school (35 children in total) that follows an active learning approach. We invited all children in the school (regardless of age or ability) to participate. 24 children (age 5–12) took part in the study with their guardian’s consent.
Prior to the study, children were asked to complete a visualization literacy test which explored their ability to read basic visualizations5. The test included two visualizations (a pictograph and a bar chart) with four questions each. Questions asked children to find extrema and compare values between attributes. Questions were extracted from standard elementary school teaching materials, and the test was vetted by a school teacher. Children completed the test on paper during regular class time. Each question was worth two points with a maximum score of 16. Partially-correct answers scored one point (e.g., providing a general trend—“more than”/“less than”—instead of exact values).
4.2 Study Setup & Tasks
The study took place at the children’s school, but separate from other school activities. One experimenter familiar to the children was present during all sessions. Children participated in pairs of similar age where possible (i.e., no more than one school year apart; two children partici-pated alone due to this constraint). Children were seated with a tablet (Apple iPad Air 2; 9.7 inch) opposite each other at a table (see Fig. 1). The study consisted of three tasks that consecutively increased in complexity. Each task started with a brief introduction to the task-relevant features of Construct-A-Vis, so that children were gradually introduced to the tool. Each task consisted of the same open-ended visualization exercise, that was based on fictional data on popularity votes on school subjects. The data consisted of five data points with two attributes: school subjects (maths, music, sports, science, arts, represented as icons) and their corresponding aggregated numbers of votes (see Fig. 2). Children were asked to visualize the data using Construct-A-Vis, in order to make suggestions on the two subjects that should be run as after-school clubs. While the task and data structure remained consistent, the data values varied between tasks and participants. We modeled this exercise in collaboration with a school teacher based on data-driven activities run in their school.
Task 1provided children with icons, colour, and shape for their rep-resentations. Upon linking tokens to a school subject the tool provided feedback based on the number of tokens with a corresponding icon. This task was to encourage concrete mappings between data points and tokens by offering icons which directly corresponded to school sub-jects. We hoped that even younger children would be able to engage in
these more concrete visual mappings. At the same time, more abstract mappings in form of colour and shape were still supported.
Task 2constrained children to use token area (width and/or height) and colour for their visual representations. The data showed the same subjects but different votes. The tool provided feedback based on a token’s area. The purpose of Task 2 was to guide children toward more abstract mappings using size to encode values. We considered this to be a more complex task that required numeracy skills not covered in the first year of elementary school. Therefore, only children in their second year or above (ages 7–12) participated in this task.
InTask 3children were given an additional shared tablet and asked to collaboratively create a single representation showing an overview of their combined two data sets (see Fig. 1). All visual mapping options were available: icons, colour, shape, width, and height. Tool feedback was disabled. The purpose of this task was to create a setting where children would have to communicate, interpret, and negotiate each others’ ideas for visually representing the data. Again, only children in their second year or above (ages 7–12) participated in this task.
After each task children described their visualizations and, based on this, their choice of the two subjects for the after school-club. We also asked them to reflect on their visual mapping choices and their experience using Construct-A-Vis. During the discussion phase parts of the data table were hidden so that children had to read their answers from their visualizations instead of the data table.
4.3 Data Collection & Analysis
Each study session was video recorded using three cameras that cap-tured children’s visualization processes and the discussion phases (29 hours of video material across all cameras). One camera mounted face-down over the table provided an overview of both children’s activ-ities. Two cameras captured activities of each child individually. We also took screen captures of children’s final visualizations for each task. Our results are based on a detailed thematic video analysis of the collected video and audio data [7, 14, 15]. We first transcribed all study videos, including children’s verbal and non-verbal interactions with Construct-A-Vis, with each other, and with the experimenter. Verbal interactions were transcribed word-by-word; video sequences were described in words. We also captured key instances of activities from the video data in form of still images, resulting in a compact overview of the most pertinent visualization activities6Each study session was initially coded by one of four researchers, focusing on instances that would shed light into children’s visualization processes (e.g., choice of visual variables, layout and grouping of tokens, and experimentation with visual mappings), as well as activities that indicated a critical engagement in interpreting, verifying or questioning a visual mapping, and any shared activities between children (mostly occurring in but not limited to Task 3). The emerging coding scheme was iteratively discussed among the four researchers, leading to a consolidated scheme which was then applied to all video transcripts by one of the researchers. Children’s visualizations created across the three tasks were catego-rized by two researchers independently according to task and visual mappings applied. This process was guided by the representation types common in elementary school teaching material [1]. The two re-searchers’ visualization categorization revealed no conflicts, indicating clearly defined commonalities and differences among the visualizations. Four out of 24 children who participated in the study were excluded from our analysis. Three 5-year-olds did not complete the literacy test. They still wanted to try Construct-A-Vis, but had visible difficulties understanding the visualization tasks. Due to their missing literacy tests we could not analyze their visualizations in context. One child with learning difficulties (literacy test score 4/16 points) struggled to engage with the visualization task but was able to engage with the token creation and modification, and, with additional help, could visualize the data. We excluded this child from our analysis as it was unclear what effects the additional help had on their processes.
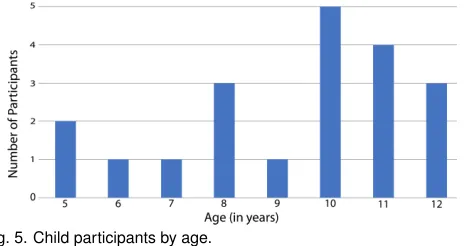
Our findings are therefore based on the analysis of 20 children’s visualization processes with Construct-A-Vis (see Fig. 5 for an age dis-tribution). 75% of the children achieved a score of at least 14/16 points
[image:5.612.325.557.49.172.2]6https://construct-a-vis.cs.st-andrews.ac.uk/process-overviews/
Fig. 5. Child participants by age.
(87.5%) in the visualization literacy test; all children scored above 50% (8/16 points). However, when extracting and comparing information from the graphs, some children (age 8 or younger) misinterpreted some questions and reported general trends rather than values.
All 20 children completed Task 1 which was designed to be an entry-level visualization task that we anticipated to be doable even by first years. Tasks 2 and 3 included more abstract data mappings and involved concepts that are not taught in the first year of elementary school. Therefore, only children in their second school year and higher (17 children in total) participated in these visualization tasks.
Our analysis resulted in rich insights into children’s engagement in visualization processes using Construct-A-Vis as a free-form, construc-tive visualization tool as described in the following sections.
5 CHILDREN’SVISUALIZATIONS& PROCESS
We first describe by-task the types of visualizations that children created using Construct-A-Vis (Q1) and their visualization processes (Q2).
5.1 Task 1: Icon, Colour, & Shape
In Task 1 children could only use icons, colour, and shape for their representations. Upon linking tokens to a data point the tool provided feedback based on the number of tokens with icons of the corresponding school subject. The purpose of this task was to encourage concrete map-pings between data points and tokens. All 20 children used Construct-A-Vis without significant problems and produced visualizations that were true to the data in that the visual representation matched the num-bers presented in the table. On average, children took 10 minutes to complete their visualizations (max: 15min., min: 5min., stdev: 216sec.). Figure 6 shows some of the visualizations created. 17/20 of resemble classical visualization types; free-form pictographs (4 instances, avg. age 10.75), structured pictographs (3 instances, avg. age 9), and pic-tographs that resemble discrete bar graphs (10 instances, avg. age 9.8) (Fig. 6.A–C). Three children’s visualizations (avg. age 6) fall outside the classical visualization spectrum. These resemble pictographs but tokens lacked a meaningful spatial grouping (Fig 6.D, top) or were stacked on top of each other, rather than aligned (Fig 6.D, bottom).
All children used icons to represent school subjects. 17/20 children used colour, typically (14/17) to distinguish between subjects. Colour choices were influenced by children’s personal preferences:“I used red for maths, because maths is hard.”[P3a]. One child reported using colours in the order of the rainbow to reflect the order of subjects in the table. Three used colour based on vote counts, for example, applying green and red for the subjects with the most and least votes. Another child used colour to highlight the most popular subjects (Fig. 6.C, top). 10/20 children used shape, either to distinguish between subjects (Fig. 6.A, bottom) or to highlight the most popular ones.
Fig. 6. An overview of visualization types created in Task 1.
colour in a rather random fashion. When asking one child about this choice, he exclaimed:“Oh, that makes no sense!”, and changed tokens to a more consistent by-subject colour mapping. The constructive visu-alization paradigm [P2] as implemented in Construct-A-Vis facilitates this type of experimentation as visual mappings can be easily modified.
5.2 Task 2: Size & Colour
Task 2 constraint children to use size and colour for their representations (same school subjects but new data values). The tool provided feedback based on a token’s area. 17 children (age 7–12; all in their second year or above) participated in this more abstract mapping task.
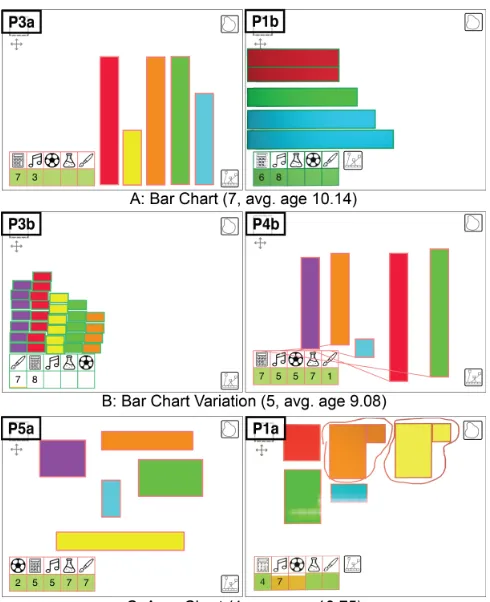
[image:6.612.310.555.425.726.2]All children created visualizations that adequately represented the data set (see Fig. 7 for a sample). Vertical or horizontal bar charts were the most common (7 instances, avg. age 10.14; Fig 7.A), with some variations where the bars were not aligned (2 instances, avg. age 8.5; Fig. 7.B, right), and some with bars ordered by height (3 instances, avg. age 9.7; Fig. 7.A, right). One child created a discrete bar chart, compressing token sizes only to better fit them onto the canvas (Fig. 7.B, left). 4/17 children (avg. age 10.75) created variations of area charts by adjusting both width and height of tokens (see Fig. 7.C). Here, children dealt with the representation of uneven values in different ways. Three children only adjusted the token width (Fig. 7.C, left), while one split the targeted value into two numbers, representing the resulting larger even number by adjusting the width and height of a token and the odd “+1” by creating a single additional token with the matching colour (Fig. 7.C, right). She also used grouping to highlight the subjects with the most popular votes. All but one child used colour to distinguish between subjects; this child instead used colour to encode categories of voting numbers (green/blue representing subjects with the most and red/orange for the least number of votes (Fig. 7.A, right).
Children completed Task 2 in 8 minutes on average (max: 11min., min: 4min., stdev: 125sec.). Our observations and comments from children indicate that they found this task harder than Task 1. This was partly due to a usability issue, as manipulating token sizes via the slider menu proved finicky. However, some children also had difficulty understanding how to map the token area to represent a quantitative value; especially those that manipulated both token width and height which requires splitting the value into two factors. To facilitate their visualization process, 11 children linked their tokens with the table for continuous feedback while adjusting the token’s size. All but one child figured out the area mapping over the course of the task. One child avoided manipulating token size but produced a bar graph where token counts reflected corresponding values (Fig. 7.B, left).
While engaging in the task most children recognized the difficulty of remembering which bar represented which data point and came up with strategies to deal with this. For example, they arranged tokens according to the order of data points in the table (Fig. 7.A, left). Four children
arranged their tokens directly above the corresponding table columns, appropriating these as labels (Fig. 7.B, left). Others made links between tokens and data points visible via the linking button (Fig. 7.B, right). During the discussion phase, when the values in the table were partially hidden, the lack of axes (e.g., for bar charts) or number labels (e.g., for area charts) made it“a bit difficult”[P3a] for children to estimate the exact values represented in their visualization because there are “no counting lines”[P3a]. Children worked around this problem by using a token of known size as a measure, or by opening the token menu to read from the size selector. P3b suggested another alternative: “If they had a little pencil that you could draw them [number labels] on, I’d find it easier to remember them”. These statements show that children understood and could critically discuss the readibility of their visualization. Providing ways to add labels and axes to visualizations should be addressed in future iterations on Construct-A-Vis.
5.3 Task 3: Collaborative Free-form Mapping
In Task 3 each child’s personal tablets displayed, again, updated data about school subject preferences. In addition, each pair received a shared tablet (see Fig. 1, bottom). Children were asked to collabora-tively create a single representation of their combined data sets. All visual mapping options were available: icons, colour, shape, width, and height. However, no feedback was provided by the tool.
The same 17 children who completed Task 2 participated in Task 3. We were unable to pair two children with a peer and so they worked with the experimenter. The work of these children and that of one pair where one child was unable to actively participate in the task (the same child excluded from analysis of Tasks 1 and 2) were excluded from our analysis. The remaining 14 children completed the task in 9 minutes on average (max: 12 min., min: 6 min., stdev: 124 sec.). All seemed to enjoy its collaborative aspect. One child stated:“It’s fun to work with someone else, to talk, and decide what to do.”[P6b].
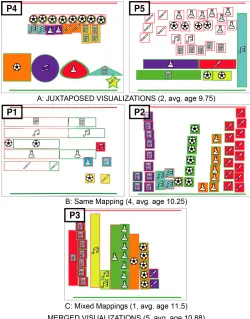
We observed a variety of visualization outcomes (see Fig. 8) and shared processes—not surprisingly, as children were less constraint in their mapping choices, and Construct-A-Vis does not prescribe a partic-ular collaborative style. All children used icons to represent school sub-jects. Also, as in Tasks 1 and 2, colour was used to distinguish between subjects. One pair used colour to highlight their final choices of subjects to pick (Fig. 8.B, left). Only one child made use of shapes to distin-guish between subjects (Fig. 8.A, P4 left). 5/7 pairs changed the size of tokens to encode the number of votes (see Fig. 8; P1, P3, P5). Visual-ization types included free-form and structured pictographs (Fig. 8.A & B, right), bar charts (Fig. 8.B.left), and representations of mixed types (Fig. 8.A & C). The character of joined visualization was influenced by children’s collaborative strategies. In general, children who collabo-rated closely created fairly coherent joined visualizations (Fig. 8.B & C, 5 groups, avg. age 10.88). Independent work resulted in visualizations that consisted of two juxtaposed representations (Fig. 8.A; 2 groups, avg. age 9.75). We describe details on shared strategies below.
[image:7.612.53.303.410.729.2]In-parallel creation, followed by collaboration. 3/7 pairs started visualizing their individual data sets in parallel, without discussing
Fig. 8. Joined visualizations created by pairs in Task 3.
a general approach to mapping strategies. Once finished with their individual visualizations, children transferred their tokens to the shared tablet. This typically initiated a collaborative phase where comparisons of the visualizations took place, which sometimes resulted in adjust-ments of representations to make them more compatible. In Pair 1, for example, one child (P1a) created a horizontal bar chart on her tablet. After transferring her tokens onto the shared display, she noticed that her partner (P1b) was in the process of creating a vertical bar chart. She verbally intervened:“I think this is going to have to change, because I have done mine along this way [pointing to her chart on the shared display], and you have done yours up and down.”[P1a]. After a brief discussion, P1b agreed to change his tokens into horizontal bars and transferred these onto the shared tablet. The children then collabora-tively arranged tokens into a joined horizontal bar graph (Fig. 8.B, left). Similarly, Pair 3 first visualized their data in parallel, and arranged the two resulting visualizations (a pictograph and a vertical bar chart) side-by-side on the shared tablet. They realized that, although their choices of colours were consistent by accident, this arrangement would not help them analyze the joined data. P3a:“Since I did not do mine that way... We have to compare them! So let’s put them side-by-side.”The subsequent collaborative re-arrangement of all tokens (Fig. 1, bottom) resulted in a side-by-side bar chart (Fig. 8.C). In contrast to Pairs 1 and 3, children of Pair 6 briefly discussed their mapping approach and confirmed colour and icon choices while visualizing their individual data in parallel. They collaboratively transferred and arranged tokens on the shared tablet, resulting in a structured pictograph.
Close Collaboration. Pair 2 was the only group to work closely together throughout the visualization process, leading to a joined visu-alization that evolved on the shared display (see Fig 8.B, right). The pair would first create the required number of tokens for a subject (based on the number of votes) on each their personal displays, apply colour and icon (taking turns deciding), and transfer the prepared to-kens onto the shared display. Here they took turns arranging the toto-kens into a structured pictograph, depending on who had finished creating and preparing tokens on their personal display first. Throughout this process, both made sure via frequent counting of tokens that the visu-alization evolving on the shared display was true to their joined data. These children stated that they particularly enjoyed working together on the visualization because“Working together is faster and easier.”[P2a].
Independent Work. 2/7 pairs worked in parallel on visualizing their data, and then juxtaposed their representations on the shared display without attempting to merge them (Fig. 8.A). Children of these pairs were unable to answer questions about votes across both data sets. These findings show that, overall, children were able to create ad-equate visualizations using Construct-A-Vis and to critically discuss these during and/or after the activity (Q1). This is remarkable consid-ering the large range of ages (5–12). From the age of seven, children were able to engage in more advanced visualization activities, making use of abstract mappings and collaboratively analyzing data through joined visual representations. Constraining children’s choices of vi-sual properties guided the creation of different types of vivi-sualizations (concrete and abstract). We also saw that the constructive paradigm implemented in Construct-A-Vis facilitates direct and simple one-to-one mappings between data values and visuals [P2], allowing children to experiment with their mappings. Maybe more importantly, it made children’s visualization processes visible, including struggles as well as critical thinking (Q2). Children’s visualization literacy scores were quite high to begin with, and we found no notable correlation to their visualization process or their final visualizations. However, young children (ages 5–6) may require additional scaffolding, even with more concrete mappings as in Task 1, as suggested by our observations of our youngest participants who did not prepare visualization that would particularly facilitate data analysis (see Fig. 6.D).
6 IMPACT ONPROCESS& ENGAGEMENT
Benefits of Free-Form Vis Creation. The key goal of Construct-A-Vis is to support free-form visualization activities among children (P1). We have shown that this approach led to a wide range of creative, yet valid visualizations. We also found evidence that allowing for open-ended visualization processes enabled a critical engagement with visualization and how it can be used to communicate information. Nine children, for example, not only provided a visual overview of the data, but, in addition, encoded their analysis outcomes into the visualization (e.g., by highlighting the most popular subjects in yellow (Fig 6.C, top)). Children also used colour to indicate the popularity rankings (Fig. 7.A, right), or ordered tokens by size like Pair 4: “The one from the left is the biggest and then the one on the right is the smallest [number of votes]”. Pair 1 even integrated an additional mini-visualization to highlight the ranking of subjects according to their joined data sets (Fig. 8.B, left). Such customized designs are not supported in template-based applications, and, yet, they indicate children’s engagement with the data as part of the visualization process, and an understanding of how visualization can be used as a communication medium.
However, we also found downsides of this free-form visualization process that allows children to manipulate their visualizations beyond what is shown in the data. For example, the visualization of one boy showed a tie between popularity votes in four subjects. When asked which two subjects to pick, he followed his personal preference. Being aware that the visualization did not support his choice, he removed tokens from the subjects he did not pick. While problematic, this behaviour shows that he understood the power of visualization as a communication medium. Allowing children to venture away from the data like this, on the one hand, can undermine learning objectives and even send the wrong message. On the other hand, in a supervised environment where the teacher or peers can point out the problem, these types of situations allow children to learn from their own mistakes.
Our findings suggest that tools such as Construct-A-Vis can con-tribute to children’s understanding of visualization as an active process to critically explore and communicate data.
Scaffolding via Visual Feedback. Construct-A-Vis’ feedback mechanism specifically addresses the learning goal of making use of visual variables in a consistent way to represent certain attribute lev-els, and to construct valid mappings of quantitative data aspects [P3]. Unprompted by us, children made use of this feedback to help them create accurate visual data representations. For example, in Task 2, children would link a token to a data point and watch the table feedback while adjusting the token’s height/width. The feedback mechanism was also used forretrospective verificationafter the visualization had been created, and some children altered their visualizations as a result, indicating that the feedback was formative. However, our findings also show that the feedback feature did not enforce particular mappings [P1], as children also ignored the feedback on purpose to follow their own ideas, resulting in unique and valid visualizations (Fig. 7.C, right). In other cases, the results were less desirable: P3b ignored the opportunity to map the data to token length as intended by the feedback configu-ration of Task 2 (Fig 7.B, left). This type of behaviour made visible by children’s individual visualization processes, can point the teacher to individual learning issues that might require additional guidance. Construct-A-Vis’ feedback mechanism seems to benefit learning in that some children who used the feedback as part of their creation process have achieved visualizations outcomes that they may have struggled to produce otherwise, allowing them to successfully engage in visualiza-tion tasks above their comfort zone. At the same time, the feedback mechanism did not interfere with those wanting to try their own ideas. However, based on this first study, we cannot say how much children internalized visualization concepts promoted by the visual feedback. Further research into the design and study of feedback mechanisms to scaffold visualization concepts without dictating processes is necessary.
Scaffolding via Configuration. The configuration feature of Construct-A-Vis can be used to gradually introduce children to dif-ferent ways of representing data [P4] (e.g., using the concreteness fading approach [10]) and to allow a wider range of children to interact with the application by situating activities based on their current skill
level. Our observations reveal that this approach has merit. Between Task 1 and 2, some children showed a better understanding of the visual mapping process, visible in more sophisticated visualizations. For example, four children created free-form pictographs in Task 1 and aligned bar charts in Task 2. However, other children struggled visibly with Task 2, indicating that they may benefit from additional activities using more concrete mappings; as these children successfully completed the first task, the application still appears suitable. Our find-ings suggest that the ability to adjust visual variables as constraints can helpful to allow children build visualization skills, exploring a wider range of visualization designs over time using a single tool.
Learning from Shared Experiences. Our findings reveal a range of productive interactions between children, not only in the collabora-tive Task 3. For example, in Task 2, one child struggled to create an accurate mapping of subject votes to tokens’ width and height. When he saw his partner’s mapping (a bar chart), he recognized the complexity of his own approach: “You did it smartly! [Adjusting size] only on one side!” [P5a]. This illustrates that free-form visualization activities in a shared environment can expose children to a variety of visual mappings introduced by their peers and in this way encourage critical reflection on their own processes. In the collaborative Task 3, this engagement was even more pronounced. 5/7 pairs actively discussed their represen-tations and negotiated ways to merge them. Pair 6 decided“keeping the colour [of school subjects] the same helps to read it [the visual-ization] better”[P6a] as it eased the comparison of their individual representations. We also observed instances where children verified the validity of each others’ visualizations. For example, P1a questioned the accuracy of the token bars created by her partner, leading the pair to verify the tokens by arranging them alongside bars of verified length. This illustrates again the merit of free-form visualization tools in a shared context: while inaccurate or less efficient mappings may be produced, a collaborative or even just shared setting can bring these to the fore, not only promoting hands-on peer learning but also a critical and inquisitive perspective to visualization.
7 DISCUSSION
The goal of this research was to explore the feasibility of digitally supporting free-form visualization activities for elementary school children. With Construct-A-Vis we have made a first step in this direction, both in terms of exploring design options and investigating the impact of this approach on children’s visualization processes and outcomes. Studying Construct-A-Vis in-use revealed that children are able to create meaningful visualizations even without step-by-step guidance or templates, and that they engage in creative and critical visualization processes. Below we reflect on the ways in which free-form visualization activities with children can be productive and on the open questions our research highlights.
7.1 The Potential of Free-form Vis Tools for Children
Enjoyment. Children enjoyed experimenting with different map-ping choices to explore different visual representation techniques in a hands-on way, following their own ideas. One child summarized:“I thought it [Construct-A-Vis] was really nice, because you could use your own imagination. You could just make it [the visualization] how-ever you like”[P4a]. Children explored different visual variables and layout choices to present an overview of the data and/or specific data aspects (e.g., highlighting the most popular subjects to pick). Although creating a visualization from scratch is a challenging task, we found that children even in their first year of elementary school, were able to create visualizations which faithfully represented the data using Construct-A-Vis without much additional guidance.
discuss their own visualizations and those of their peers [P5]. While Construct-A-Vis provides basic features for collaborative visualization creation and sharing, there is a lot of room for future work, for example, supporting collaboration in larger groups and for larger data sets or different types of data. Also the integration of such group activities in classroom scenarios has to be studied in detail.
Active Engagement with Mapping Choices. The constructive visualization paradigm and explicit mapping between data points and visual elements [P2] seem particularly useful for children’s visualiza-tion creavisualiza-tion, verificavisualiza-tion, and modificavisualiza-tion as mapping choices become easily applicable, visible and adjustable via direct manipulation. Fur-thermore, manual (rather than automatized) visualization construction forces children to directly consider every mapping choice. As our study shows, a tool such as Construct-A-Vis where visualization processes are visible and transparent enables the observation of these processes and outcomes, which can help teachers notice when to introduce more chal-lenging mapping options, or if the current activity should be adjusted or repeated to help solidify children’s understanding. Configurability [P4] allows the teacher to adjust activities according to children’s current skill level. A downside of the one-to-one mapping approach is that it can be tedious:“It’s time-consuming because you have to put the sticker on and choose the color”[P5a]. Children even suggested design solutions to this problem that are comparable to discussions around comparable tools for adults [26, 27]:“Duplicating might be easier than dragging all of them”[P8a]. Future work should explore how to make constructive vis approaches for children scale to larger data sets.
Guidance through Scaffolding. Our findings indicate that free-form visualization tools, as suspected, should still include some free-form of guidance and scaffolding to promote effective and ethical uses of visu-alization. Even with the availability of visual feedback to scaffold chil-dren’s visualization process [P3] some children created visualizations that were not as effective or even misleading. While our observations suggest learning from such “mistakes” can be productive if balanced by peer or teacher feedback, future research has to further explore options for in-tool scaffolding mechanisms that can guide children’s visualization process as part of creative free-form vis activities.
Visualization Tool Paradigms. Our research has focused on the digital support of free-form visualization creation with children. Com-pared to analogue tools (e.g., physical tokens as previously explored in [2, 20]) a digital approach such as Construct-A-Vis has benefits in that it allows flexibility in terms of visual mapping options (e.g., easily adjusting token size or color) and scaffolding (e.g., providing automatic feedback on visual mappings or constraining mappings to certain vi-sual variables). However, physical media (as often used in elementary school classrooms) may promote visualization activities and literacy skills in different ways. Furthermore, Construct-A-Vis only represents one design approach to implementing a free-form visualization tool for children, and is not without limitations. It is designed to work with small data sets that consist of one categorical and one quantitative attribute. Also while successfully avoiding the use of step-by-step guidance and templates, visual encodings are somewhat restricted. Fu-ture work needs to further explore the design and use of analogue and digital visualization tools for children. This should include compara-tive studies that investigate the pros and cons of different visualization paradigms (e.g., free-form vs. template-based activities).
7.2 Limitations
As a first exploration of free-form visualization activities to engage children in visualization processes, our work is not without limitations which open up additional questions for future work.
How Free is Free-Form? We consider Construct-A-Vis as a free-form visualization tool in that it does not provide step-by-step guidance or templates to visual mappings. However, like every tool, Construct-A-Vis constraints the visualization process in terms of visual variables provided and visualization types supported. For example, standard visualization types such as line graphs or network visualizations (to name a few) cannot be explored. Future work on visualization tools for children should expand the range of visualization options under
the free-form paradigm, alongside the support of different data types. This should include further design explorations of providing formative feedback while allowing flexibility in the visualization process.
Impact of Visualization Literacy. Our study did not reveal a re-lationship between children’s visualization literacy scores and their visualization creations which might be an artifact of our small par-ticipant sample which is biased in that all child parpar-ticipants scored relatively high in the pre-study visualization literacy test, with 75% achieving 14/16 points. Future studies should investigate free-form visualization activities with children with a broader range of visual-ization abilities in order to gather more nuanced information on how the free-form visualization approach can support the gradual building of skills related to visualization literacy. There is also the question of how to design visualization literacy tests for children which cover the broad range of skills required for visualization [9]. More granular tests applied as part of long-term studies may reveal more insights into the effect of engaging with particular types of visualization tools.
Impact of Age. Our study was conducted across a wide range of ages (5-12) with a small number of children in each age group. We therefore cannot provide in-depth insights on how children’s age im-pacted their visualization process. We did notice that younger children (ages 5 and 6) generally appeared to have more difficulties creating coherent visualizations. Configuration features seem like a promising approach to help children build on existing skills. However, future studies are needed to explore how this approach applies across different ages and visualization literacy levels, or whether dedicated tools for different age groups are more beneficial.
In-Classroom Use. We designed our study with real-world class-room activities in mind, guided by elementary school curricula [11]. However, although our study took place at an elementary school, chil-dren’s activities were observed in a controlled setting. Investigating how tools such as Construct-A-Vis integrate into classroom activities is therefore important. Of particular interest would be long-term studies investigating the impact of such tools on children’s development of visualization literacy skills over the course of their education.
Overall, our findings suggest that tools such as Construct-A-Vis can contribute to children’s understanding of visualization as an active process to critically explore and communicate data. However, more studies are required to explore the merit of this free-form visualization approach, in particular, regarding its effectiveness to support learning.
8 CONCLUSION
We have explored children’s visualization processes when engaging with free-form visualization activities. We developed Construct-A-Vis as a technology probe to enable this exploration. Construct-A-Vis is a tablet-based tool designed to (1) support free-form visualization creation, (2) make data-to-visual mappings explicit, (3) provide scaf-folding via visual feedback, (4) cater for different skill levels through configuration, and (5) support shared activities. Our in-depth study of Construct-A-Vis with elementary school children showed that children at a young age are capable of creating meaningful visualizations during free-form visualization activities. We found that children critically engaged in the visualization process and that shared visualization pro-cesses further prompted productive discussions and behaviours. Our findings also highlight the merit of scaffolding the visualization creation process (through feedback, configurability and shared interactions) to support children’s activities. We hope our work inspires future research to further investigate children’s visualization literacy in a broader con-text, supporting a variety of processes.
ACKNOWLEDGMENTS
REFERENCES
[1] B. Alper, N. H. Riche, F. Chevalier, J. Boy, and M. Sezgin. Visualization Literacy at Elementary School. InProc. of the Conference on Human Factors in Computing Systems, CHI ’17, pp. 5485–5497. ACM, 2017. doi: 10.1145/3025453.3025877
[2] F. Bishop and U. Hinrichs. Challenges of Running Constructive Visu-alization Studies with Children. InDIS’17 workshop on Pedagogy & Physicalization: Designing Learning Activities around Physical Data Representations, 2017.
[3] K. P. Blair. Learning in Critter Corral: Evaluating Three Kinds of Feedback in a Preschool Math App. InProc. of the Conference on Interaction Design and Children, IDC ’13, pp. 372–375. ACM, 2013. doi: 10.1145/2485760. 2485814
[4] K. Boehner, J. Vertesi, P. Sengers, and P. Dourish. How HCI Interprets the Probes. InProc. of the Conference on Human Factors in Computing Systems, CHI ’07, pp. 1077–1086. ACM, 2007. doi: 10.1145/1240624. 1240789
[5] M. Boggan, S. Harper, and A. Whitmire. Using Manipulatives to Teach Elementary Mathematics.Journal of Instructional Pedagogies, 3, 2010. [6] J. Boy, R. A. Rensink, E. Bertini, and J.-D. Fekete. A Principled Way of
Assessing Visualization Literacy.IEEE Transactions on Visualization and Computer Graphics, 20(12):1963–1972, 2014. doi: 10.1109/TVCG.2014. 234698
[7] R. Boyatzis. Transforming Qualitative Information: Thematic Analysis and Code Development. Sage Publications, 1998.
[8] S. K. Card, J. D. Mackinlay, and B. Shneiderman, eds.Readings in Infor-mation Visualization: Using Vision to Think, chap. 1. Morgan Kaufmann Publishers Inc., San Francisco, CA, 1999.
[9] F. Chevalier, N. H. Riche, B. Alper, C. Pleasant, J. Boy, and N. Elmquist. Observations and Reflections on Visualization Literacy in Elementary School.IEEE Computer Graphics and Applications, 38(3):21–29, 2018. doi: 10.1109/MCG.2018.032421650
[10] E. R. Fyfe, N. M. McNeil, J. Y. Son, and R. L. Goldstone. Concreteness Fading in Mathematics and Science Instruction: a Systematic Review. Educational Psychology Review, 26(1):9–25, 2014.
[11] S. Government. Scottish Curriculum for Excellence: Numeracy and Mathematics, 2011.
[12] L. Grammel, C. Bennett, M. Tory, and M.-A. Storey. A Survey of Visual-ization Construction User Interfaces. In M. Hlawitschka and T. Weinkauf, eds.,EuroVis - Short Papers. The Eurographics Association, 2013. doi: 10 .2312/PE.EuroVisShort.EuroVisShort2013.019-023
[13] L. Grammel, M. Tory, and M.-A. Storey. How Information Visualization Novices Construct Visualizations. IEEE Transactions on Visualization and Computer Graphics, 16(6):943–952, 2010. doi: 10.1109/TVCG.2010. 164
[14] G. Guest, K. M. MacQueen, and E. E. Namey.Introduction to Applied Thematic Analysis. SAGE Publications, Inc, 2012.
[15] C. Heath, J. Hindmarsh, and P. Luff. Video in Qualitative Research. Introducing Qualitative Methods series. SAGE Publications, 2010. [16] J. Heer, F. Vi´egas, and M. Wattenberg. Voyagers and Voyeurs: Supporting
Asynchronous Collaborative Information Visualization. InProc. of the Conference on Human Factors in Computing Systems, CHI’07, pp. 1029– 1038. ACM, 2007. doi: 10.1145/1240624.1240781
[17] M. Horn, Z. Atrash Leong, F. Block, J. Diamond, E. M. Evans, B. Phillips, and C. Shen. Of BATs and APEs: An Interactive Tabletop Game for Natural History Museums. InProc. of the Conference on Human Factors in Computing Systems, CHI’12, pp. 2059–2068. ACM, 2012. doi: 10. 1145/2207676.2208355
[18] M. Howison, D. Trninic, D. Reinholz, and D. Abrahamson. The Math-ematical Imagery Trainer : From Embodied Interaction to Conceptual Learning. InProc. of the Conference on Human Factors in Computing Systems, CHI’11, pp. 1989–1998. ACM, 2011. doi: 10.1145/1978942. 1979230
[19] S. Huron, S. Carpendale, A. Thudt, A. Tang, and M. Mauerer. Constructive Visualization. InProc. of the Conference on Designing Interactive Systems, DIS’14, pp. 433–442. ACM, 2014. doi: 10.1145/2598510.2598566 [20] S. Huron, Y. Jansen, and S. Carpendale. Constructing Visual
Representa-tions: Investigating the Use of Tangible Tokens.IEEE Transactions on Visualization and Computer Graphics, 20(12):2102–2111, 2014. doi: 10. 1109/TVCG.2014.2346292
[21] P. Isenberg, D. Fisher, S. A. Paul, M. R. Morris, K. Inkpen, and M. Cz-erwinski. Co-Located Collaborative Visual Analytics around a Tabletop
Display. IEEE Transactions on Visualization and Computer Graphics, 18(5):689–702, 2012. doi: 10.1109/TVCG.2011.287
[22] M. Laal and S. M. Ghodsi. Benefits of Collaborative Learning.Procedia— Social and Behavioral Sciences, 31:486–490, 2012. doi: 10.1016/j.sbspro. 2011.12.091
[23] A. Manches, C. O’Malley, and S. Benford. The Role of Physical Repre-sentations in Solving Number Problems: A Comparison of Young Chil-dren’s Use of Physical and Virtual Materials.Computers and Education, 54(3):622–640, 2010. doi: 10.1016/j.compedu.2009.09.023
[24] A.-M. Mann, U. Hinrichs, J. C. Read, and A. Quigley. Facilitator, Func-tionary, Friend or Foe?: Studying the Role of iPads Within Learning Activities Across a School Year. InProc. of the Conference on Human Factors in Computing Systems, CHI’16, pp. 1833–1845. ACM, 2016. doi: 10.1145/2858036.2858251
[25] N. Marquardt, K. Hinckley, and S. Greenberg. Cross-device Interaction via Micro-mobility and F-formations. InProc. of the Symposium on User Interface Software and Technology, UIST’12, pp. 13–22. ACM, 2012. doi: 10.1145/2380116.2380121
[26] G. G. M´endez, U. Hinrichs, and M. A. Nacenta. Bottom-up vs. Top-down: Trade-offs in Efficiency, Understanding, Freedom and Creativity with InfoVis Tools. InProc. of the Conference on Human Factors in Computing Systems, CHI ’17, pp. 841–852. ACM, 2017. doi: 10.1145/ 3025453.3025942
[27] G. G. M´endez, M. A. Nacenta, and U. Hinrichs. Considering agency and data granularity in the design of visualization tools. InProc. of the Conference on Human Factors in Computing Systems, CHI ’18, pp. 638:1–638:14. ACM, 2018. doi: 10.1145/3173574.3174212
[28] G. G. M´endez, M. A. Nacenta, and S. Vandenheste. iVoLVER: Interactive Visual Language for Visualization Extraction and Reconstruction. InProc. of the Conference on Human Factors in Computing Systems, CHI ’16, pp. 4073–4085. ACM, 2016. doi: 10.1145/2858036.2858435
[29] J. K. Olsen, V. Aleven, and N. Rummel. Toward Combining Individual and Collaborative Learning Within an Intelligent Tutoring System. In C. Conati, N. Heffernan, A. Mitrovic, and M. F. Verdejo, eds.,Artificial Intelligence in Education, pp. 848–851. Springer, 2015.
[30] S. Papert.Mindstorms: Children, Computers, and Powerful Ideas. Basic Books, 1980.
[31] T. Plank, H.-C. Jetter, R. R¨adle, C. N. Klokmose, T. Luger, and H. Reiterer. Is Two Enough?! Studying Benefits, Barriers, and Biases of Multi-Tablet Use for Collaborative Visualization. InProc. of the Conference on Human Factors in Computing Systems, CHI’17, pp. 4548–4560. ACM, 2017. doi: 10.1145/3025453.3025537
[32] M. Prince. Does Active Learning Work? A Review of the Research. Journal of Engineering Education, 93(3):223–231, 2004. doi: 10.1002/j. 2168-9830.2004.tb00809.x
[33] R. R¨adle, H.-C. Jetter, N. Marquardt, H. Reiterer, and Y. Rogers. Huddle-Lamp: Spatially-Aware Mobile Displays for Ad-hoc Around-the-Table Collaboration. InProc. of the Conference on Interactive Tabletops and Surfaces, ITS’14, pp. 45–54. ACM, 2014. doi: 10.1145/2669485.2669500 [34] Resnick, Mitchel and Maloney, John and Monroy-Hern´andez, Andr´es and Rusk, Natalie and Eastmond, Evelyn and Brennan, Karen and Millner, Amon and Rosenbaum, Eric and Silver, Jay and Silverman, Brian and Kafai, Yasmin. Scratch: Programming for all. Communications of the ACM, 52(11):60–67, Nov. 2009. doi: 10.1145/1592761.1592779 [35] K. G. Schneider. Children and Information Visualization Technologies.
ACM Interactions, 3(5):68–73, Sept. 1996. doi: 10.1145/234757.234765 [36] K. Sobel, G. Kovacs, G. McQuillen, A. Cross, N. Chandrasekaran, N. Henry Riche, E. Cutrell, and M. R. Morris. EduFeed: A Social Feed to Engage Preliterate Children in Educational Activities. InProc. of the Con-ference on Computer Supported Collaborative Work, CSCW’07. ACM, 2017. doi: 10.1145/2998181.2998231
[37] A. Thudt, D. Baur, S. Huron, and S. Carpendale. Visual Mementos: Re-flecting Memories with Personal Data.IEEE Transactions on Visualization and Computer Graphics, 22(1):369–378, 2016. doi: 10.1109/TVCG.2015. 2467831
[38] L. S. Vygotsky and E. Souberman.Mind in Society: The Development of Higher Psychological Processes. Harvard University Press, 1978. [39] A. Wise and K. O’Neill. Beyond More Versus Less: A Reframing of the
Debate on Instructional Guidance. InConstructivist Instruction: Success or Failure, pp. 82–105. Routledge/Taylor & Francis Group, 2009. [40] D. Wood, J. S. Bruner, and G. Ross. The Role of Tutoring in Problem