CoderChrome:
Augmenting source code with software metrics
Matthew Harward
Supervisor: Dr. Warwick Irwin Department of Computer Science and Software Engineering University of Canterbury, Christchurch, New Zealand
Contents
Contents ii
List of Figures iv
1 Introduction 3
1.1 Overview . . . 3
1.2 Project Goals . . . 4
1.3 Roadmap . . . 4
2 Background 5 2.1 Integrated Development Environments . . . 5
2.2 Visualising Software Metrics . . . 6
2.3 Augmenting Source Code . . . 6
2.4 Previous Publication . . . 7
3 In Situ Visualisation 8 3.1 Visualisation Overview . . . 8
3.2 What Can We Measure? . . . 8
3.3 What Can We Visualise? . . . 11
3.4 Mapping & Interpolating Results . . . 15
4 CoderChrome Design 17 4.1 Tool Overview . . . 17
4.2 Eclipse . . . 18
4.3 Architecture . . . 19
4.4 Additional Functionality . . . 24
4.5 Extensibility . . . 27
5 Results & Evaluation 29 5.1 Results and Evaluation Discussion . . . 29
5.2 Results . . . 29
5.3 Informal Evaluation . . . 30
6 Discussion 32 6.1 The Roles of Developers and Managers . . . 32
6.2 A Day In The Life . . . 33
7 Future Directions 34 7.1 Future Tool Development . . . 34
8 Conclusion 36
Bibliography 37
Appendices 41
A View Control Panel 42
B Preference Pages 43
B.1 General Preferences . . . 43
B.2 Metrics Preferences . . . 44
B.3 Augmentation Preferences . . . 45
B.4 Mapping Preferences . . . 46
C Developer Activities 47
List of Figures
2.1 The Eclipse IDE . . . 5
2.2 A screen shot of the SeeSoft tool . . . 7
3.1 Two source code editors . . . 11
3.2 An example of poor contrast using background colouring . . . 14
3.3 Linear interpolation . . . 15
3.4 Examples of possible augmentations within the source code editor . . . 16
4.1 CoderChrome in use in Eclipse’s Java editor . . . 17
4.2 The view provided to control the current mappings . . . 18
4.3 A component level architecture of CoderChrome . . . 19
4.4 The system model . . . 21
4.5 The metric components of the model . . . 22
4.6 The range components of the model . . . 23
4.7 The augmentation components of the model . . . 25
5.1 Screen shots of CoderChrome augmenting in the Java editor . . . 31
B.1 The general preference page . . . 43
B.2 An instance of a metrics preference page . . . 44
B.3 An instance of a augmentation preference page . . . 45
Abstract
Software is typically big and complex. Software metrics provide measurements of software products and development processes, in order to help software developers understand and improve their products. Metrics, however, can add to developers’ information overload problems, so visualisation techniques are needed to allow large volumes of measurement data to be efficiently communicated to an observer.
Software measurement data is normally presented in reports, tables, or graphical visualisations that are distinct from the primary way developers view their products: in a source code editor. This separation makes it hard for developers to relate measurement data to the features being measured. Additionally, the intrusive task of having to run measurement tools and accommodate different views provides a disincentive for measuring at all. We present a new visualisation technique that directly applies a visualisation overlay to source code. We have developed a tool, CoderChrome, providing this functionality for the Eclipse Java editor.
Acknowledgments
1. Introduction
1.1
Overview
Software engineering is a time consuming and expensive undertaking. While this discipline has advanced dramatically since its inception over four decades ago, many challenges still remain for the software development industry. These challenges consist of issues with the process of development and the product that is being created. From a process perspective, these issues can include those related to the economic realities of software development [10] and the requirements of clients to produce multiple versions [38] of high-quality software to a deadline. It can also include issues relating to the dynamics of large development teams that are often globally distributed [23].
The underlying cause of these process issues, in fact the very reason why software development is a challenge, is the size and complexity of the systems being created. These issues lead to the majority of large software projects being compromised and a significant percentage failing completely [12, 32, 42].
One of the earliest texts that recognise these issues is Brook’s “The Mythical Man-Month” [12]. Since this development, a gradual improvement has been provided to software engineering through the development of agile methods [11,24], the shift toward OO languages, the introduction of design patterns [19], and the push towards Test Driven Development (TDD) [6, 9]. While it is clear that the success rates for software development are increasing, more progress is needed [42].
Software engineering draws on conventions established by tradition physical engineering dis-ciplines. One of the key characteristics of these disciplines is the use of quantative approaches to managing both products and development processes [48]. The field of software metrics is now supported by a large body of literature [16, 17, 21, 29, 30]. The most well used metric is Lines Of Code (LOC); however, a huge body of these metrics exist, one well known example is Chidamber and Kemerer’s suite of OO software metrics [13].
However, software metrics alone are not an adequate solution. One of the most fundamental problems faced by software developers is information overload, a problem that originates from the size and complexity of software; metrics data can easily compound the information overload problem. Furthermore, this problem is compounded as this metrics information is not presented in the source code view that developers commonly use. In this case, developers are forced to mentally translate tables of measurements into a form that is useful. One possible solution is to use a form of visualisation to display this data.
The majority of a developers time is spent in a source code editor, such as those found in modern IDEs. One major limitation of existing software visualisation techniques is the need for a separate representation outside of this source code editor. This research is an exploration of the idea of in situ visualisation, that is augmenting the traditional source code view with metrics information.
developers to easily detect which methods need refactoring. We could use the tool to identify bro-ken heuristics [40] or code smells so that the developer can receive sufficient information to critique their own design. This technique has the potential to be highly beneficial to the productivity and satisfaction of developers. In the next section, our exploration and solution to this problem will be discussed.
1.2
Project Goals
In this project, our main goals are:
• To identify a set of visualisation techniques that can be used to provide metrics information to developers in a source code editor without the need to change a developers focus.
• To produce and document an extensible tool that supports multiple methods of visualisation and a wide range of metrics.
• To ensure that the tool is sufficiently flexible and robust that it may be used in a large commercial software development environment, because the problems addressed by this report are most prevalent in industrial scale software.
• To demonstrate the viability of in situ visualisation and clarify the issues surrounding its applicability.
This project is part of a larger research program that aims to improve the usage of metrics in software engineering. The tool produced by this project will provide a valuable platform for the continued evaluation of software metrics.
1.3
Roadmap
2. Background
In this section, we will firstly explore the concept of an Integrated Development Environment (IDE) which is a central consideration of this project. We will then look into the background behind the visualisation of software metrics. Finally, we will then look at existing research and tools that provide information on the augmentation of source code.
2.1
Integrated Development Environments
The majority of source code editors reside inside a IDE. As the in situ visualisation we intend to produce augments a source code editor, background information on IDEs is important.
In general, an IDE provides a suite of tools in a single location that help in the development of software. A wide variety of these environments exist. Some of the most commonly used are Microsoft’s Visual Studio, Eclipse and CodeGear’s JBuilder. Often these tools provide support for only one programming language; however, some IDEs such as Visual Studio and Eclipse provide support for developing in multiple languages.
Most IDEs provide a common set of features. At the highest level, this most commonly includes a source code editor, an inbuilt compiler, inbuilt build tools, and a debugger. Usually these systems also provide a navigator for maintaining the files within a project, inbuilt tools for unit testing and refactoring, and integration with version control systems.
In figure 2.1 we present a screen shot of the default GUI provided by the Eclipse IDE. This figure shows a standard Java development environment. To the left of this image we can see a directory explorer (1) where source code files within the current projects may be accessed. The Java editor (2) is present in the center of the UI. We can also see a toolbar (3) that provides the ability to run code and access features such as debugging and refactoring. An overview (4) that provides fine grained detail of components of the current file can be seen to the right of the UI. At the bottom of the UI, a set of views (5) are provided. These views provide additional functionality such as a pane to view console input and output.
2.2
Visualising Software Metrics
Visualisation and software metrics are each large areas of research. In this report, we are concerned with the intersection of these elements: visualisations where the datasets are provided by software metrics. Various different types of these visualisations have been created by researchers. They include tree maps [34], city scapes [51], and force directed layouts [26]. Visualisations such a CodeCity rely on very simple metrics such as Lines Of Code (LOC) and Number Of Methods (NOM) [51]. However, attempts have been made to visualise more complicated and configurable product metrics [27].
In addition to these visualisations, there are a large number of modern tools that have the ability to calculate software metrics but do not have any method for visualising these methods, except for reports and potentially charts representing the collected data [3, 16, 26, 50]. This is important as it means that there are a range of tools that can provide the metrics data that we seek to visualise.
2.3
Augmenting Source Code
There is a variety of previous work that looks at the augmentation of source code. Some of this work isin situ, which implies that it must support the live editing of code as it resides in an editor. Other techniques, while they overlay data on source code, provide a read only display and cannot be consideredin situ.
Of the integrated techniques that support in situ visualisation, the most commonly seen is syntax highlighting. This technique involves the alteration of the foreground text colour to indicate a property of the coloured syntax - it might be a variable name or a reserved language-specific keyword [46]. There has been very little academic work in this area and there do not appear to be any studies that provide evidence that this technique is beneficial. The earliest known usage of syntax highlighting is in the Live Parsing Editor (LEXX), a tool developed in 1985 which provided augmentations to a display of the Oxford English Dictionary [15].
One technique that has been suggested by Hendrix, Cross and Maghsoodloo is to overlay control structure diagrams directly over source code [22]. This research found that the there was a strong correlation with the existence of the overlay and improved productivity. Additional techniques, such as changes to background colour, icons in the margins and the underlining of source code can be found in some editors [46], but there does not appear to have been any attempt to provide a general purpose metrics visualisation framework. In addition, we have been unable to locate any academic work addressing their efficacy.
This tool coloured individual lines of code in a read only display. The colouring represents process metrics that apply to the regions of the code displayed. SeeSoft is frequently cited in visualisation literature and has spurred a number of spin off visualisations. One example, the Visual Code Navigator, advances the metaphor by providing background colouring around nested code blocks and supports the abstraction of the source code level representation to a high level tree map for visualising large systems [34].
Within our research group, there has also been work in this field. In 2005 a tool named SeeSoftLike was developed. This tool is designed to provide an alternative to SeeSoft for modern OO languages. Additionally, it also supports the visualisation of product metrics [14].
Figure 2.2: A screen shot of the SeeSoft tool We have been able to identify a number
tools, like the tool we propose, that display soft-ware metrics information in situ. All of these tools have been implemented as Eclipse plug-ins. The EclipseMetrics plugin provides a ta-ble based report of the metrics it is ata-ble to calculate. It is also capable of providing sim-ple margin icons to areas specifically referenced by the generated product metrics. In order for these margin icons to be generated, a static and user directed metrics generation process must occur [50].
In the third year software engineering project at our university, the University of Can-terbury, some groups have used code colouring
to represent specific process metrics in the Java editor. There are also a proprietary tool, Clover, that provides a code coverage metric. This tool can exist as a plugin for Eclipse and provides basic augmentations in the form of background colouring within the Java editor [2].
These plugins provide very limited functionality and the provided functionality is in a contingent role. There appears to have been multiple independent occasions where the visualisation we seek to provide could have been beneficial and there does not appear to be any case where such a visualisation has been created as more than an inferior component.
2.4
Previous Publication
3.
In Situ
Visualisation
In this section of the report, we examine the potential components of a visualisation that overlays software metrics data in the source code editor. Firstly, we outline the visualisation, then we attempt to provide a classification of the potential metrics that it might be desirable to represent. We then also classify the possible techniques for augmenting a source code editor, finally we look at the potential mapping and interpolation challenges between metrics and augmentations.
3.1
Visualisation Overview
This visualisation involves the placement of additional graphical elements into an existing source code editor, we term this variety of visualisation “in situ”. These augmentations can consist of a variety of different additions, from code colouring to underlining sections of code. Each appearance of an additional element in the editor results from metrics data which has been mapped to that location. The development of this broad visualisation technique is our own work.
3.2
What Can We Measure?
In order to provide this visualisation, an overview of the different types of data we can measure is important. We can use this classification to inform the acceptable types of augmentation we can use and also to give an understanding of potential use case scenarios.
Essentially we can measure anything to which a quantitative value can assigned. In this research, we are primarily concerned with software metrics and heuristics. There are two main classifications of metrics; these are process metrics and product metrics. Process metrics are concerned with the development process behind the software engineering, whereas product metrics are an analysis of the actual code itself.
Process Metrics
Process metrics cover a wide range of types and have to potential to describe very useful facets of the program’s development. These metrics tend to be related to the management and development practices used in software development. Traditionally, the gathering of these metrics has been automated [17, 26] into data retrieval from source code repositories or directly recording from a developer’s actions in an Integrated Development Environment (IDE).
Source code repositories, and more specifically revision control systems, like Subversion (SVN) and Concurrent Versions System (CVS), allow certain types of process information to be gathered [17]. These systems keep track of the numerous and complex changes in software by recording the changes made in the system. This is usually achieved using a process of commits to a database.
• Code Age - The relative date position of the last modification of a specific section of code. Other metrics allow the age of a specific file or the number of modifications to a line of code to be measured [17].
• Code Author - The last developer to work on a section of code. This may be extended, as with code age, to look at all of the different developers working on a section of code [17].
• Development Time - The amount of time spent writing and editing a section of code.
• Bug Tracking - The location and existence of system errors is also often incorporated into revision control systems.
It should be observed that due to the commit system used by repositories, users of these metrics need to be aware that the data obtained from these systems may not be fully up-to-date with modifications to an existing system. Care also needs to be taken to make sure that the difference between the number of commits and the date of the commits is considered.
In addition to using revision control systems, the monitoring of a developer directly through an IDE has to potential to allow further metrics to be collected. These have the potential to provide addition process data, that when combined with the metrics from a version control system, can give a more complete picture of the development process. Potentially, these systems allow fine grained knowledge of the workspace of each developer on the project. This allows the use of techniques like pair programming or refactoring to be monitored. It also allows a more complete understanding as to problem areas in the code by evaluating how a developer spends their time.
Product Metrics
Process metrics only provide half of the picture; a substantial range of metrics can be gathered by directly evaluating the created software product. This has two major components: source and runtime product metrics.
Source product metrics are those that are generated directly from source code. This generation is usually achieved using some form of parsing. In an optimal case, a parse tree that represents a model of the entire system is generated. From this tree, metrics data can be extracted. Some of the most well used metrics of this type are:
• Lines of Code (LOC) - The number of lines of code in a file or other section of code. This could include classes, methods and code blocks.
• Number of Methods (NOM) - The number of methods within a class.
• Cyclomatic Complexity - A measure of the number of independent paths with a system.
• CodeRank - An importance rating for a block of code. This system is based on Google’s PageRank classification [37].
• Lack of Cohesion Of Methods (LCOM) - A group of metrics to measure the cohesion of methods.
In addition to the source types, runtime metrics are generated during the normal operation of the program. These can include such metrics as execution time, instruction path length and a variety of other metrics. These metrics are particularly useful during operations such as debugging.
Heuristics
A heuristic is measurable principal of some aspect of a software program. In the field of OO develop-ment, Riel presents a extensive list of heuristics designed to advise developers of best practices [40]. One example of these heuristics is to hide data within its class (Riel 2.1).
When a heuristic has be broken by a section of source code, a measurement can be generated. With regards to the example above, if a field in a class was made public, this would break the heuristic. In this visualisation we regards these heuristics as metrics in their own right as they provide measurable data.
Metrics Standardisation
One of the challenges that faces measurement, particularly in the case of software metrics, is that the measurements are not standardised. This creates problems as separate implementations of the same metric can produce radically different values [27, 33]. One common metric that has this problem is Cyclomatic Complexity.
In the case of our visualisation, this has the potential to be problematic as two reportedly identical metrics could produce different data and visualisation effects. This issue can be minimised by making sure that the type of algorithm used to calculate the metric is clearly specified and different measurements of the same metric are clearly labeled as such.
Metrics Data and Ranges
In order to provide anin situvisualisation, we need to provide a generalised form that can represent all of the metric types above. This can be defined by discovering what they all have in common and any specific features that need to be accounted for. Generalising metrics to a common model is important as it provides us with the ability to interpolate between metrics and corresponding augmentations; this is discussed in section 3.4.
We make a distinction between two concepts: a measurement and the metric it belongs to. A metric describes a particular type of measured value. In order to describe this, we define a metric in terms of three parts: a semantic understanding of what the metric means, a definition of the types of values that are acceptable, and a set of measurements that relate to that metric in the current context. For example, the Lines Of Code (LOC) metric can be semantically defined as the length of a document. The acceptable values for this metric are integer numbers between zero and positive infinity.
A measurement represents a particular instance of a piece of measured data. We model this by composing a measurement of two pieces of information: a value that is acceptable within the metric and the location of this measurement. A value could be a numeric value such as the number of LOC in a particular method or the name of developer who wrote that method. The location is a reference to that method.
also be able to allow text as a form of acceptable value. For example, the name of a developer, “John Smith”, would be an acceptable value within a certain range.
3.3
What Can We Visualise?
Display Regions
A source code editor is comprised of a number of elements; at the most basic level, this consists of a representation of a document that contains lines of text. Each line is displayed in sequence in the editor and in most cases, the concept of a wrapped line does not exist, the text continues for the entire length of the line. In order to navigate these documents, the most traditional method is a vertical scroll bar. In cases where the text is also too wide for the screen, a horizontal scroll bar may also be provided. The area of the document that a user can see is known as the view window. In addition to these features, source code editors may also provide internal and external margins on each side of the editor. An internal margin acts as padding from the outside border, whereas external margins provide additional panes around the editor. Both of these types of margin can be used to provide additional display information, for example they may note syntax errors in a document or the location of breakpoints [39]. Margins may also provide additional information such as a breadcrumb trail to help document navigation [46].
(a) An example of the Eclipse java source code editor
(b) An example of the Visual Studio C# editor
Figure 3.1: Two source code editors
Within these constraints, many source code editors provide additional functionality. This can include syntax highlighting, mouse over hovers to present additional information, and inline code completion techniques [46]. Context menus are also often used to provide features such as refactor-ing support and key combinations can allow document formattrefactor-ing options. Two examples of source code editors can be seen in figure 3.1.
Potential Techniques
and the techniques that can be used. A basic example of the editor can be seen in figure 3.4(a).
Background Techniques
A background technique is any technique occurs behind the main visible content of the source code editor. This means that it occurs behind the written code. These techniques have the potential to be useful as they can provide information without excessively distracting or overloading the user with additional information. Possible techniques include:
• Colouring the background of a line or block of lines a colour. This colour represents an underlying metric quantity. See figure 3.4(b).
• Colouring a section of text, this may occur on a single line or continue over several lines. While this technique is similar to colouring an entire line, it only covers sections of a line where code is present. See figure 3.4(f).
• Vertical and horizontal colour gradients can be used to represent changes across a line, set of lines, or section of code. In these cases, fine grained metrics data is required to produce such gradients. See figures 3.4(c)(d)(e).
Foreground Techniques
A foreground technique is one that occurs above or at the same level as the main visible content. This area has been widely used to provide additional information to developers and so may have a more limited usage. Some examples of this additional usage are syntax colouring, underlining and boxing text, and also hover augmentations which provide additional information in the foreground. These techniques have been widely used; this indicates that they will provide useful additions to this visualisation. As developers are familiar with this type of augmentation, care needs to be taken to avoid confusion with their use. This could be ensured by making sure that the colour schemes used by this visualisation do not overlap with existing techniques. Below are techniques that may be beneficial to the visualisation:
• Syntax colouring has the potential to be useful, however, due to its prevalence it is probably not wise to use this technique except in exceptional circumstances to avoid confusing the developer. See figure 3.4(g).
• Code styling has been used, however further potential exists. This includes changing the size, font and font styles (i.e. bold and italic) of a section of text [31]. In order to allow source code to be easier to understand, a non-proportional serif font type is nearly always used. The font size is also nearly always constant throughout the document.
In order to keep the document clean and easy to understand, changing the font and font size within a document should be avoided as this leads to a common document presentation problem known as “ransom note typography”. However, changes between documents may provide useful information to a developer [25].
• Hovers also have the potential to provide useful information on top of elements when the user selects or holds the mouse over a particular location. This information could be as simple as textual information or more diverse information such as tables or other visualisations. See figure 3.4(j).
• Transparent overlays are an additional possibility, in this technique a screen showing an abstract representation is presented as a transparent layer over the source code. While this has the potential to be effective, it is liable to cause high levels of confusion and not be suitable for this kind of visualisation. See figure 3.4(i).
Peripheral Techniques
Peripheral techniques are here distinguished from foreground techniques as they occur in the mar-gins of the editor. There are a number of possible techniques that are applicable:
• Icons and colour chips in either the internal or external margins are potential techniques for providing additional information. The colours and shape of the chosen glyphs can provide details to the user. The also provide a useful location for providing hover data. In terms of placement, the logical locations are the left and right margins and multiple chips could be stacked on each side of the editor. See figures 3.4(k)(l).
• Colour bars, like colour chips, can provide addition information. The main difference is that rather than corresponding to a single line, colour bars can provide an indicator over a multi-line section of code. See figure 3.4(l).
Ambient Techniques
In addition to the three types of techniques listed above, ambient techniques can also be used. These techniques are often not immediately apparent to the user and would serve subtly indicate features of the source code. In this project it is not our intention to develop these further, however, their existence should be considered as they are applicable without the user changing their focus. Here are a list of some that may be useful to developers:
• Auditory techniques, such as using sound to provide feedback and information content may be useful [7]. This technique would allow the developer to judge a piece of code by its relation to an audio signal with characteristic qualities.
• Olfactory techniques may also be useful to the developer. A characteristic smell could define a positive or negative quality in a code. This could take the form of a literal code smell [53].
• Outside the immediate area of focus, visual techniques could provide indicators to the user. These could either be in the surrounding area of the screen or external to the main display. They could consists of changes in colour and light intensity. Providing definitive glyphs is unlikely to be productive as they would distract the user from their current focus.
HCI Concerns
While all of the types of augmentation listed above have the potential to be displayed in or around a source code editor, there are reasons why certain versions of these augmentations may not be desired or why combinations of these augmentations may create undesirable effects. These HCI issues are discussed below.
Information Overload
In a case where a developer is presented with to much information to concentrate on they will find in hard to be productive. This will also be annoying to a developer and they will stop using the visualisation. This should be avoided by providing the developer with tools to customise the augmentations that are visible.
Figure 3.2: An example of poor contrast using background colouring
Contrast Issues
The choice of the shape and colour of elements to display is important. These features should be intentionally designed so they are easy to distinguish from existing elements in the source code editor and other visualisations. A particular concern is that the choice of colours to present an augmentation may provide an unpleasant combination with other augmentations or may be similar to the syntax colouring in the document. This would make distinguishing text from an augmentation difficult, especially if the augmentation was layered directly above or below text, this can be seen in figure 3.2. Contrast is an important issue and one that users need to be informed about.1
Creating Inferences
When multiple augmentations are displayed within the source code editor at any time, the user has the ability to use the combined pieces of information to form inferences about the underlying data set. Making these inferences is a huge benefit to this type of visualisation and should be encouraged. This means that different types of augmentations need to work along side each other and that the same metric needs to have the potential to be shown by multiple augmentations.
Attention Seeking
A range of possible augmentations exist. The developer should be aware of their existence and be able to refer to them with ease. However, except in very specific circumstances, they should avoid
1It is worthwhile noting that a significant proportion of software developers are colour blind, therefore visualisation
trying to seek the developers attention. This means that motion or quickly changing scenes within the user’s area of focus should be avoided.
3.4
Mapping & Interpolating Results
We have identified two elements: a software metric with a range and an augmentation with ad-justable properties. In order to make use of them, we need to define a way of mapping between the two elements to ensure that the information within the data is preserved. In order for this operation to be completed, we propose three stages:
Figure 3.3: Linear interpolation
1. Each instance of metrics data is checked against the range of that metric to make sure that the data point provided is valid.
2. A range is used for the desired augmentation. This range consists of a set of possible values that can be displayed. These values may correspond to different colours, shapes or images.
3. After both of these initial conditions have been established, a mapping between the two data sets can take place. In this mapping, an interpolation takes place between the range of possible values established for the augmentation and the those established for the metric. A simple interpolation is shown in figure 3.3
(a) The editor without any augmentations (b) Background code colouring
(c) Background code colouring with a horizontal gradient
(d) Background code colouring with a vertical gradient
(e) Background code colouring with a line size step vertical gradient
(f) Background code colouring of a fine grained set of characters
(g) Additional syntax colouring on the method name “main”
(h) Two different types of underlines, a single straight line and a swiggle
(i) Other software visualisations can be used to directly provide overlaid content
(j) A text hover can provide extra information if a location is moused over or selected
(k) Colour chips in the left and right margins, note that different shapes and colours can be used to provide information
(l) Colour bars and icons can be used to provide peripheral information
4. CoderChrome Design
In this chapter we will detail and discuss the tool we have produced. In addition to providing an overview, we will also detail its integration into an IDE, its architecture, further features it provides, and the limitations of the system. At the end of this section we also discuss the extensibility of the tool.
4.1
Tool Overview
We have created a tool, CoderChrome, that realises the visualisation technique described in chapter 3.1,2 This tool is implemented as an extensible Eclipse plugin which integrates with the Java editor this IDE provides.
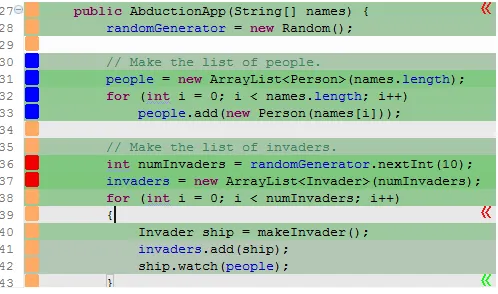
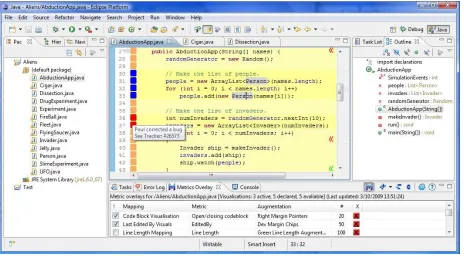
Figure 4.1 shows a screen shot of CoderChrome in action. This tool allows multiple augmenta-tions, that are mapped from existing or generated metrics, to be displayed in Eclipse’s Java source code editor. These augmentations allow metrics information to be presented in a variety of ways.
Figure 4.1: CoderChrome in use in Eclipse’s Java editor, a combination of augmentations is shown
In order to provide discrete user control over the tool, two additional components are also
1Thank you to Neville Churcher for the suggestion of this name. 2
provided. The first of these is a view, this allows users to select a set of mappings to investigate and control which of them are active. This view is described in greater detail in appendix A. In addition to providing user control, this panel also facilitates access to help and preference controls. A screen shot of this view, populated with five mappings, is shown in figure 4.2.
Figure 4.2: The view provided to control the current mappings
The preference pages allows the user very extensive and modular control over the mappings, metrics and augmentations in use by the system. This preference system is facilitated by the very flexible model which is described in section 4.3. Each of the preference pages are shown in appendix B. The amount of control that these two components provide is a significant benefit of the system.
4.2
Eclipse
In this section we discuss our decision to use implement our solution in the Eclipse IDE and provide information about the specific components of Eclipse that we have made use of. Figure 2.1 shows screen shot of the default Eclipse configuration. Eclipse is an industrial strength IDE that allows the implementation of functionality using a plugin architecture, as such, it is designed from the ground up to be extensible.
Some of the benefits that Eclipse provides are:
• Usage - Eclipse has the second highest IDE market share after Visual Studio. It also has a 70% usage among the Java development community [4,36]. This makes developing for Eclipse attractive as there is an increased potential of reaching a wide audience.
• Development Community - Eclipse has a strong and active development community, meaning the existing problems can be quickly solved [5].
• Free - Eclipse is free to its users. This means that deploying applications for this IDE is cost effective [1].
• Open Source - Eclipse is a completely open source platform. This means that creating new components for Eclipse is made easier as developers have access to underlying source code of the objects they are extending or using [1].
The Eclipse IDE provides developers with integrated support for developing large software applications. This support includes integrated debugging, synchronisation with source code reposi-tories, a project explorer, and of course, a source code editor. The provided GUI is highly modular, providing support for developers to dramatically change the layout of their workspace as desired.
Some of the central components of the Eclipse infrastructure that are important to this tool are:
• Java Development Tools (JDT) - This set of modules provides Java related functionality into Eclipse. This includes:
– The ability to directly run Java applications with console input and output.
– Java specific navigation to explore source code directories and open source code files.
– An editor to allow code to be written and modified. This editor features a variety of use-ful functionality including tabbed documents, breadcrumb trails, break point handling, syntax highlighting, and code completion.
– Further functionality, such as debugging support and integrated unit testing.
• Simple Widget Toolkit (SWT) - This is a Eclipse specific graphics library for creating User Interfaces (UI) and underlies the UI that provides the graphical content for Eclipse.
• Rich Client Platform (RCP) - This is a set of modules that are designed to facilitate the building and deployment of components within the Eclipse platform.
4.3
Architecture
The system is comprised of three components that can be seen in figure 4.3. TheEditorListener component aggregates changes to the existing Java editor into a usable format, theMetricsDataProviders use this data to add metrics information, and the MetricsOverlay component keeps track of the current model and user preferences. It is also responsible for supplying information to the editor. These components are examined in greater detail in the following sections.
While designing this architecture, a key design consideration was the use of the “Tell, Don’t Ask” maxim [45]. None of the components request information from those earlier in the chain, they wait until the information is provided. For example, the MetricsOverlay component keeps its current set of metrics data until a new set is provided. This decision is important as it produces a design that is architecturally clean (due to low coupling) and easy to maintain.
A central concept in use in this component model is the Observer design pattern. [19] This pattern allows us to abstract the coupling between the components we use. It also allows us to provide a broadcast communication model and the ability to provide updates at any time.3
Listening to the Editor
The EditorListener component mentioned earlier provides the ability to monitor changes made to the current editor the user is working on. A wide range of changes can be made by the user and these changes are represented using a complex set of event generators. The EditorListener component has the following behaviour:
1. Various listener objects are created to make sure all valid events are caught for the desired document types.
2. Events are captured as they occur.
3. Captured events are checked for validity.
4. Addition details on the registered events are sought to ensure that a consistent set of data is available for all events.
5. The captured event is translated into a simplified form that generalises the changes to make later computation more straightforward. The potential generalisations include: newly opened documents, modified documents, and changes in focus between two already open documents.
6. Using the Observer design pattern, an observable interface then provides the data about the updated editor to any listening MetricsDataProviders.
This component is designed to be extensible, so that different file types within different Eclipse editors can be monitored as desired.
Metrics Data Providers
In the most basic case, a MetricsDataProvider provides the MetricsOverlay component with metrics data. The default behaviour of such a component is to observe (using the Observer design pattern) theEditorListenerand on an update, generate a new set of metrics data as an instance of the system model (see section 4.3), and provide it to theMetricsOverlay through an Observer based API. However,MetricsDataProviders can provide more complex behaviour to suit a variety of purposes; these features are detailed below.
• Multiple providers can be created and used concurrently. Each provider can contain one or more types of metric. The MetricsOverlay component handles the data sets provided by multiple sources transparently.
3
• Not only can metrics data be provided, but these providers can also provide default or rec-ommended sets of mappings and augmentations to view them with (discussed in section 4.3).
• While the EditorListener component provides an easy source of updates for the system, developers can choose to implement their own set of listeners and update the model as they see fit. TheMetricsOverlaycomponent attempts to manage all provided datasets and maintain their validity as far as possible. This is valuable as existing metrics generation tools can provide metrics data without having to interface with theEditorListener component.
• This flexible architecture style provides the ability to deal with both static and dynamically generated metrics. In this research we focus on dynamic metrics as they more clearly fit with the usage of a source code editor, and by implication fit the in situ paradigm more closely. • WhileMetricsDataProviders can provide data through an API, an XML representation can
also be provided to theMetricsOverlay. This approach provides flexibility when integrating existing XML based tool sets and reduces the difficulty of providing valid data. In this case, an XSLT transform is all that is needed to transform data into an appropriate form. Within our research group, the use of XML for this purpose is common and will allow us to integrate our existing tools [26].
System Model
The system model provides a straightforward and extensible model of the visualisation. It consists of the main concepts and relationships within the visualisation. A simplified UML class diagram can be seen in figure 4.4. In this model, we can see the concept of a Mapping. A Mapping holds a Metricand an Augmentation, it is responsible for interpolating between them. This is achieved using theInterpolationStrategy, which is an implementation of a Strategy design pattern [19]. AMetricholds aRangethat describes theMetric, and a set of MetricSectionsthat represent the calculated measurements for a particular Metric. An Augmentation of a specific type represents an overlay in the editor. TheAugmentationStrategy is in charge of implementing this overlay.
In order to allow us to translate from a measured value of aMetricto a displayableAugmentation value, we use anInterpolationStrategy. The subclasses of InterpolationStrategyimplement various types of interpolation. They require a minimum and maximum for theMetric’s range and for the Augmentation’s range. When a measurement is provided for a specific Metric, an inter-polated value is calculated. A variety of different types of InterpolationStrategy are provided, including logarithmic and exponential based interpolations. The equation of a linear interpolation is shown in equation 4.1; ‘A’ refers to theAugmentation values and ‘M’ to theMetricvalues.
δ = Amax−Amin
Mmax−Mmin
φ=Amax−δ·Mmax Aval =δ+φ·Mval (4.1)
An important characteristic of the system model is that is allows interchangeable components. Metrics andAugmentations are interchangeable and can be reused across multiple Mappings. In addition, the classes within the system have been designed to be self describing in terms the user can understand. Interfaces ensure that this functionality is consistent across the model.
Metric
In the previous figure (4.4) a simplified diagram of the system model was presented. In figure 4.5, a fuller representation of the Metrichierarchy is provided. A Metric represents a definition of a particular type of measurement of software. A Range defines the possible values that of a measurement. Ranges are described in the subsequent section. A MetricSection represents a specific measurement; essentially this consists of a value and a location in the current document. A location is a region in a Java file.
Figure 4.5: The metric components of the model
Range
A range determines the minimum and maximum allowable values of a set of data. Data values that fall outside of this predefined range are discarded. In addition, we can refine a range as ordinal, nominal, interval or ratio scale. Ordinal numbers represent a ranking; first, second, third etc. Nominal assigns a specific name to a value, one example in software metrics is the name of the last developer of a section of code. An interval seeks to define a set of acceptable values on the real number line and ratio describes a measurement as value and a scalar modifier.
Additionally, a range can consist of one or more sub-intervals. For example, when investigating Lines Of Code (LOC) we may only be interested in method bodies of 1-3 lines and greater than 15 lines in length. These two sub intervals need to be described in a model of a range. A final issue is that of using a sub interval to describe a discrete point on a data set. With our LOC example, we may wish to classify long and short method types separately.
Figure 4.6: The range components of the model
of the range and also to provide normalised data for the program’s internal operation.
While this model provides sufficient descriptive power to provide a range for a majority of cases, there exist some cases that this model cannot describe. These cases are those where a differentiation is needed between sub intervals, specifically whether they represent discrete or ranged values.
Augmentation
An augmentation is any element that can be displayed within the source code editor. These augmentations directly relate to those described in section 3.3. In our implementation, we pro-vide anAugmentation hierarchy that represents the types of augmentation that can be displayed by the editor. Augmentation objects know the type of element they are; however, they do not have the ability to update themselves. This functionality is provided by a parallel hierarchy of AugmentationStrategyand its subclasses. A much simplified diagram of this relationship can be seen in figure 4.7.
The decision to separate these two elements breaks Riel’s heuristic (2.9) to keep related data and behaviour together [40]; however, in return it offers a more flexible implementation that allows the implementation of an AugmentationStrategy to change with the addition of a new type of editor in the system without having to add a new Augmentation. It also simplifies the design by abstracting apart these complex implementations.
We have implemented a variety of types of augmentation described in section 3.3. These augmentations include underlines, background colouring and margin chips and are detailed more throughly in our results section (5.2).
Within the types we have implemented, we have complete control of the colour schemes. These colour schemes are controlled by a set of colour interpolators, the models of which are discussed in section 4.4.
It should be noted that the developers of the JDT and the Java editor hid some of the func-tionality required to make direct changes to certain elements of the displayed editor. In order to provide this functionality, we make use of Java’s reflection library to provide access to these com-ponents. We believe that the reason this component was hidden is that modifying this component often has unexpected consequences, such as causing the entire editor to freeze or incorrectly display information. As such, when adding a new augmentation, a significant amount of testing must take place to check that these conditions are avoided.
4.4
Additional Functionality
Plugin Infrastructure
Figure 4.7: The augmentation components of the model
In order to provide interaction between these plugins and the rest of Eclipse’s infrastructure, Eclipse implements a concept of extension points. Plugins can use provided extension points to add additional functionality to underlying components. Conversely, plugins can also provide their own extension points that can be implemented by other plugins. Implementing and using extension points is achieved with a complex set of XML control documents that govern the behaviour of each extension point. Once these extension points have been declared, the functionality they provide can be used by programmatically instantiating or extending classes in the Eclipse API.
CoderChrome extends a number of existing extension points. These extension points allow CoderChrome to provide functionality such as integrated help, preference pages, a ‘view’ and changes to the editor. These extension points also provide lower level controls such as the icon buttons in theMetricsOverlay view.
Data Persistence
When MetricsOverlaycomponent receives an update from aMetricDataProvider, some actions have to be taken to integrate this data with the current model. This integration is important as it provides a persistent interface and set of functionality for the user. In order for this to occur, the following steps take place:
1. A new model is received from a MetricDataProvider. If the received content is in XML, a new system model has to be created based on its content.
2. The supplied model is merged with the global system model. In order to do this, the names of elements within the model, user preferences and user created content need to be validated. Depending on the type of element (Metric,MappingorAugmentation), if there is a conflict, the system decides to either discard a copy or merge two elements.
3. The updated global model is stored.
4. The source code editor is updated to display any changed content.
Colour Models
One of the main elements we seek to interpolate across is colour. In order to do this a variety of techniques may be used, each of these techniques relate to a different colour model. By choosing different colour models we gain an interpolation that has certain features. Within the current development, we have concentrated on the providing the commonly used RGB and HSV colour spaces. We discuss a broader range of models below with reference to their qualities for interpolation and computational complexity.
• RGB (Red Green Blue) - This is the standard additive colour model that is employed to dis-play colour on a screen. In the case of LCD screens, this is made possible by the combination of light from three sub-pixels - one red, one green and one blue. It is important to recog-nise that this colour model is device dependent. In our implementation, we use a standard linear interpolation between the two points represented as 24bit colour values. While this model is useful and computationally cheap, the interpolation it provides does not appear nat-ural, as interpolated colours tend to have a tendency to distort ranges that include grayscale values [44].
• HSV/HSL (Hue Saturation Value and Hue Saturation Lightness) - Rather than providing an additive or subtractive colour space where the elements represent a specific colour which are effectively blended to produce a final result, these colour spaces abstract out the concepts of hue and saturation from this model, making them more controllable. This results in a cleaner and easier to comprehend linear interpolation. It has the disadvantage that in order to convert from the default RGB values, a transformation is needed, this transformation is potentially computationally expensive for documents utilising many colour transformations [28, 35].
required are more complex and more computationally expensive, making this model less attractive. Additionally, the colour spaces these components describe are unintuitive [18].
• sRGB (Standard RGB) - This RGB colour space is derived from a subsection of the CIE XYZ colour space. It is designed to provide a device independent colour space, however it does not provide a significant advantage of an RGB colour space for the purposes of interpolation [47].
• CMYK (Cyan Magenta Yellow blacK) - This subtractive colour space is primarily designed for printed documents. While its direct use in this application is limited, it has the potential to be useful in cases where printed views of a document provide additional benefits. This could possibly include code reviews of printed source code [18].
4.5
Extensibility
One of the primary goals of the system was to create an extensible model that can be used for a variety of purposes. Below, we describe the different purposes that we anticipate our design being applicable to.
Within Eclipse
The system is designed to be easily extensible to different editors and perspectives within the Eclipse framework. This can be achieved by extendingAugmentationStrategy, within the system model, to implement the augmentations for the new editor and specifying a different type of file to listen to in EditorListener component. This allows the visualisation to be portable to different languages and specially language implementations in Eclipse. For example, this would allow a C++ editor or a PHP editor to display these visualisations.
Using this extensibility, new language implementations can use this model to provide syntax colouring implementations, in other words, this in situ visualisation tool could supersede existing syntax highlighting systems by providing the ability to swap between different types of augmenta-tion.
Across IDEs
While the EditorListener component and the provided Augmentations are specifically designed for Eclipse, the architectural structure and the design of the system model are potentially applicable to deploying this visualisation technique across other IDEs. This is a realistic goal as many other IDEs have similar plugin architectures to Eclipse.
Across Visualisations
Another example would be to use the developed framework to provide augmentations to a UML diagramming tool, preferably one that provided round-trip diagram and code generation. This would also allow developers to see metrics applied to more abstract representations and allow users to drill down and explore an existing system more throughly. This might allow developers to be informed of design patterns in use within the system or if a developer has broken one of Riel’s heuristics regarding inheritance [40].
5. Results & Evaluation
In this chapter, we show our results and report on our progress in evaluating the effectiveness of our tool, CoderChrome. Meaningful evaluation of a tool such as this is a challenging task. Ideally it would involve a long term study in a real world setting. This section of the report includes a discussion of our plans in this area.
5.1
Results and Evaluation Discussion
This project is part of a larger software engineering research programme that aims to improve software metrics and visualisations, particularly as they are applied in industrial development environments. Evaluation of the effectiveness of metrics and visualisations is an important part of this larger programme [8, 52], but one that becomes possible only once industrial strength metrics and visualisation tools have been deployed.
CoderChrome has been constructed to be robust and extensible in order to support future research, particularly in commercial environments. However, in order to answer questions about the value of metrics and visualisations to software engineers, robust tools to acquire metrics data in an Eclipse environment must first be developed. Once this has been done and the metrics supplied to CoderChrome, it will be possible to test the effectiveness of in situ visualisation for software engineering purposes.
In this context, the primary goal of this project is to enable future research by providing a tool that supports experimentation. The principle question we need to answer comes from a software engineering standpoint: is it possible to extend a widely used IDE to supportin situvisualisation? The answer is yes, but it is not easy. We report on more specific results in section 5.2.
Although it premature to attempt full scale evaluation of the usefulness ofin situ visualisation, we conducted an informal evaluation to identify the most significant issues with using CoderChrome. This evaluation is described in section 5.3.
5.2
Results
We have achieved our goal of providingin situ visualisation within an industrial strength IDE. We have succeeded in realising the visualisation techniques that we proposed in section 3.
One of the required features of our tool was that the augmentations it provides can be turned off so that Eclipse development environment appears in its normal form (an example was shown in figure 2.1). This requirement has been met; when all augmentation is turned off, the editor displays its default behaviour, including features such as syntax highlighting.
The requirement that the tool work in an industrial software development setting gives rise to several more specific requirements:
• Part of making the tool acceptable in real world software development environments is the requirement that it be highly configurable. Figure 4.2 provided a screen shot of the configu-ration panel, which allows the current visualisation to be customised. Appendix A provides further details of the capabilities of the panel.
• Interoperability with other Eclipse plugins is an important concern. We have tested Coder-Chrome in a realistic Eclipse configuration containing a variety of common plugins in order to demonstrate that it coexists without problems.
• CoderChrome does not introduce significant performance overhead to developers when using Eclipse. We have tested CoderChrome on a number of realistic systems and have been unable to detect any noticeable impact on performance.
• Full user documentation is provided.
CoderChrome successfully implements the family of visualisations proposed in section 3, includ-ing peripheral augmentations, foreground augmentations and background augmentations. Fore-ground augmentations can be seen figure 5.1(b), backFore-ground augmentations can be seen in figures 5.1(a)(d), and peripheral augmentations can be seen in figures 5.1(b)(c)(d). The proposed ambient visualisations were not attempted as they are more experimental and require specialist hardware.
There have been a few limitations with the types of augmentation we are able to portray. We have not provided vertical margin bars, gradient background colouring or provide complex types of hover. Additional development and refinement of CoderChrome will look into providing these types of augmentation.
5.3
Informal Evaluation
In this informal evaluation, two groups of five developers each were asked to install CoderChrome and use it on a substantial team development project. The developers were third year undergraduate computer science students who were familiar with Eclipse and the plugin development platform (RCP). We did not place restrictions on our users as we did not want to constrain the feedback we received.
The feedback we received about CoderChrome was revealing. There was a general agreement that developers “liked the visualization options provided”. With regards to using the plugin to implement their own metrics, they commented on the appropriateness of the system design and the ease with which the system can be extended. The ability to programmatically set the system’s behaviour was received favourably.
Other positive feedback we received was that:
• The system is unobtrusive to the user, one comment was that it “fits neatly into the Eclipse environment”.
• It has the ability to set preferences to appreciated.
• The help provided to the user was sufficient.
• The system is easy to install.
(a) Background colouring of a line length metric (b) Underlined primitives and colour chips representing code blocks are subtle augmentations
(c) Colour chips indicating the author and code blocks
(d) Multiple augmentations in use
6. Discussion
In this section we explore several topics related to the visualisation design and implementation we have produced. We discuss the different requirements of developers and managers and the implications this has for our tool. We then look in more detail at the consequences of usingin situ
visualisation for development.
6.1
The Roles of Developers and Managers
Traditionally, software visualisations have been directed towards managers and researchers [43, 49], rather than developers. This appears not to be an intentional direction and merely a by-product of the nature of metrics, which provide high level aggregate information, rather than fine detail, and so fall more into the domain of managers rather than developers. In situ visualisation is a reversal of this trend. In tools such as CoderChrome we specifically direct metrics data towards developers, although managers and researchers may also gain benefits. This because CoderChrome ties metrics data directly to source code. This provides a dramatic broadening in scope of the applicability of software metrics. Some of the specific consequences of this change are itemized below.
• Established product metrics approaches are largely based on static snapshots of source code. This makes them suitable for analysis at various points of development, such as when it is released. In situ visualisation, however, is innately dynamic; it updates as source code is edited. This has the potential to transform the way metrics are used, making them a routine consideration for developers as they write code.
• Developers do not have the time or inclination required to use existing visualisation tools [49]. The need to calculate and view metrics outside the normal IDE interface compounds the complexity of the development process. CoderChrome places the visualisation directly within the source code editor, makes metric calculation a continuous process, and provides easy control over the visualisations.
• Existing visualisations provide data that is potentially more useful to those with birds-eye-view of a project. Some examples of this include the CodeCity and tree map based metaphors [34,51]. CoderChrome can provide visualisations of data that are more relevant to a developer.
6.2
A Day In The Life
Developers spend their time in a wide variety of tasks (see appendix C), many of which focus on the use of a source code editor. Such tasks include writing new features, debugging, refactoring and bug finding. In this section we provide a series of scenarios in which CoderChrome would be beneficial to a developer.
• A bug report is received detailing a bug in the latest update of the GUI. As a developer on the GUI, you know that feature was working in the previous release. Using CoderChrome, you turn on a Code Age metric showing you which lines of code we edited most recently. This allows to to scan through the code and easily identify the offending changes.
• As a developer, you have found a large and complex method that needs refactoring. In order to assist you, you turn on an Edit-Thrash metric to determine the number of times each line of code in the method has been edited. Any expression or code block that has had many edits, and is therefore been a problem in the past, should warrant more caution when deciding how to refactor.
• As a developer you are adding a new section of functionality. A Code Coverage metric you are running shows that you have no tests that run a particular line of code. You rethink your strategy and develop a test before continuing to add new code.
• As a project manager, interested in the benefits of pair programming and software quality, you turn on augmentations of two metrics - one to show which sections of code were pair programmed and the other to show the number of bugs found in any given section of code. This allows you to easily evaluate which direction is most appropriate for your development team.
7. Future Directions
An important characteristic of this work is that it provide a basis for continued development, this section describes our plans for future work.
7.1
Future Tool Development
In section 4, we discuss the development of our tool, CoderChrome. CoderChrome has already reached a state of development where it is able to be deployed in industrial settings, however, before this can happen metrics calculation tools must be developed. These tools should be developed so they are consistent with the framework established by CoderChrome and in particular provide the ability to update metrics dynamically. This means that they should use the Observer pattern to make them responsive to changes in the editor and update metrics accordingly; CoderChrome in turn will use the Observer pattern to detect the changes and update the display.
There are a range of improvements that could add functionality to the tool. We have already discussed the potential extensibility of the tool in section 4.5. In that section we discussed how the tool could be extended to provide support for additional editor types, IDEs and diagramming types. These extensions have the potential to be very useful and are a major focus of future work. We believe that the two most valuable additions from this extensibility would be the support of Microsoft’s Visual Studio IDE, particularly with regards to the C++ and C# languages and an extension to provide overlay support for a round trip UML diagramming tool in Eclipse.
However, there are many other improvements we would like to make to the system. The most basic of these would be the addition of further augmentations to the tool. This would grant the user additional flexibility in making choices about to how to represent metrics data. This would be useful as certain metrics can be more clearly portrayed when using certain types of augmentation. These additions could include further abilities to provide typographical changes (see figure 3.4(g)), better hover techniques (see figure 3.4(j)) and vertical bars (see figure 3.4(l)).
Parallel projects are underway to support metrics in Eclipse, for example the EclipseMetrics plugin [50]. We would like to be able to integrate other metrics sources with our CoderChrome tool, however, this would require changing these projects from static snapshot metrics calculation approach to a dynamic approach.
Our preliminary evaluation revealed the need for improved documentation. While existing documentation is extensive for users of the system, it is fairly limited for those seeking to extend the plugin, especially for those intending to provide new metric sources.
7.2
Future Evaluation
looks at the important questions that we seek to answer and the types of evaluation that would be suitable to provide valid answers.
• We anticipate CoderChrome undergoing a series of iterations, these should be mirrored by a series of evaluations to track changes in usability. In addition to ensuring that the tool is robust and performs well, such evaluations would allow us to provide direction for further developments.
• Another concern is the HCI issues involved with this visualisation. These include determining which types of augmentations can be shown together effectively and which may interfere with each other. In addition, we are interested in the number of augmentations we can display simultaneously without impeding the developer, and which types of augmentations work best for this. Finally, we are interested in the correspondences between metrics and augmentations; which augmentations provide the most effective method of displaying a particular metric. To provide answers to these questions, formal quantative evaluations are the most suitable.
• An important evaluation the needs to be completed is to compare the usefulness of in situ
visualisation, in a tool such as CoderChrome, with other visualisation techniques. This would allow us to determine which types of tasks benefit from in situ visualisation. As these tech-niques are designed to be used in an industrial setting, it makes sense that this evaluation would take that into account. In this case, the most appropriate type of evaluation would be a extended case study involving a number of experienced developers.
8. Conclusion
This project has investigated a new visualisation technique in which software metrics are displayed to users in situ; that is to say directly inside a source code editor. With this technique and the tool we have developed, we can display a wide variety of metrics information with a variety of augmentations.
In this project, we have made the following contributions:
• The identification and formalising of a new method of visualising data for software developers.
– The classification of the types of data, particularly metrics and heuristics that this visualisation could provide.
– The classification of the types of augmentation that can be used to visualise provided data sets.
• A tool, CoderChrome, that implements this visualisation in a frequently used IDE.
– The development and implementation of an extensible OO model that describes the relationship between a metric and an augmentation.
– The identification of the different methodologies for evaluating the visualisation.
– The development of a system designed for large scale products in real world software engineering environments.
• An initial informal evaluation of the tool.
• The discussion that highlights the enormous benefits that this tool can provide software developers.
• A platform and future directions for continuing research in this area.

![Fig. 2.Code colouring in SeeSoftLike [34]](https://thumb-us.123doks.com/thumbv2/123dok_us/9990375.499291/57.612.81.269.262.559/fig-code-colouring-in-seesoftlike.webp)