http://go.warwick.ac.uk/lib-publications
Original citation:
Lai, Stanley C. S., Patel, Anisha N., McKelvey, Kim and Unwin, Patrick R.. (2012)
Definitive evidence for fast electron transfer at pristine basal plane graphite from
high-resolution electrochemical imaging. Angewandte Chemie International Edition, Volume
51 (Number 22). pp. 5405-5408. ISSN 1433-7851
Permanent WRAP url:
http://wrap.warwick.ac.uk/53076
Copyright and reuse:
The Warwick Research Archive Portal (WRAP) makes the work of researchers of the
University of Warwick available open access under the following conditions. Copyright ©
and all moral rights to the version of the paper presented here belong to the individual
author(s) and/or other copyright owners. To the extent reasonable and practicable the
material made available in WRAP has been checked for eligibility before being made
available.
Copies of full items can be used for personal research or study, educational, or
not-for-profit purposes without prior permission or charge. Provided that the authors, title and
full bibliographic details are credited, a hyperlink and/or URL is given for the original
metadata page and the content is not changed in any way.
Publisher’s statement
This is the pre-peer reviewed version of the following article: Lai, Stanley C. S., Patel,
Anisha N., McKelvey, Kim and Unwin, Patrick R.. (2012) Definitive evidence for fast
electron transfer at pristine basal plane graphite from high-resolution electrochemical
imaging. Angewandte Chemie International Edition, Volume 51 (Number 22). pp. 5405-
5408. ISSN 1433-7851, which has been published in final form at
http://dx.doi.org/10.1002/anie.201200564
A note on versions:
The version presented here is a working paper or pre-print that may be later published
elsewhere. If a published version is known of, the above WRAP url will contain details
on finding it.
Nanoscale
electrochemical imaging
DOI: 10.1002/anie.200((will be filled in by the editorial staff))
Definitive Evidence for Fast Electron Transfer at Basal Plane Graphite
from High Resolution Electrochemical Imaging**
Stanley C.S. Lai
†, Anisha N. Patel
†, Kim McKelvey and Patrick R. Unwin*
There is presently intense activity in electrochemical applications of novel sp2 carbon materials, such as carbon nanotubes[1] and graphene,[2] which has led to a resurgence of interest in the intrinsic electrochemical properties of highly oriented pyrolytic graphite (HOPG), to which these materials are often compared.[1] The traditional consensus, deduced mostly from macroscopic cyclic voltammetry measurements (typically on areas > 0.1 cm2)is that the electron transfer (ET) activity of HOPG is dominated by the step edges,[1,2g,3] with the basal plane showing very low[4] to no[5] electroactivity. However, the scale of these measurement necessarily means that HOPG basal planes and step edges are probed simultaneously,[3a,4 6] making it difficult to separate their individual reactivities. Furthermore, there are significant variations in reported HOPG electroactivity,[1c,3a-c,4-7] which has been attributed to each HOPG cleaved surface showing different quality (primarily step edge density). Consequently, various methods have been proposed to determine the step or defect density of cleaved HOPG. [1c,3a-c,4-7] However, the methods used hitherto are either microscopic and can only access a tiny fraction of the surface that is probed by macroscopic electrochemistry,[7c,7d,8] or are indirect measurements of surface quality,[4,6b,6c,7d] making it difficult to correlate HOPG surface structure and ET activity.
[image:2.595.316.543.150.318.2]In this Communication, we report significant advances in the newly developed scanning electrochemical cell microscopy (SECCM) technique,[9] which allows spatially resolved electrochemical imaging on a scale where the HOPG basal plane can be studied directly in isolation from step edges, and where the response also informs on the location of the measurement (basal surface vs. step edge). By further correlating high-resolution electrochemical measurements with atomic force microscope (AFM) images over the same area, we show unambiguously that the HOPG basal plane supports fast ET activity and conclude that the present (textbook)[10] model for the electroactivity of carbon-based materials requires radical revision.
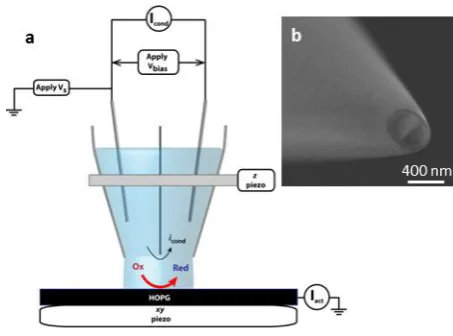
Figure 1Principles of scanning electrochemical cell microscopy (SECCM). (a) Schematic of the SECCM set-up. (b) SEM image of the end of a pipet.
The SECCM system is shown schematically in Figure 1a and is discussed in detail elsewhere.[9] In brief, a dual-channel glass capillary was pulled to a sharp point (300 - 400 nm; Figure 1b). Each channel was filled with an aqueous electrolyte solution and an Ag/AgCl quasi-reference counter electrode (QRCE). The liquid meniscus at the end of the pipet was brought into gentle contact with the HOPG sample, forming a positionable and moveable nanoelectrochemical cell with the contacted area of the HOPG as the working electrode. The pipet itself never touches the sample. A potential bias (0.5 V) was applied between the two QRCEs and a small oscillation (20 nm peak amplitude, 233.6 Hz herein) was imposed on the z-position of the tip, giving rise to a conductance current across the meniscus with an alternating current (AC) component due to periodic changes in the meniscus height. Using the AC as a set-point, the tip was scanned over the surface with a constant tip-to-substrate separation. By recording the currents between the QRCEs and at the substrate, and the positions of the piezoelectric positioners, simultaneous maps of local substrate electroactivity and topography are obtained. In this study, all SECCM maps cover 10 x 10 µm areas of HOPG (31 lines of 10 µm, scan rate 0.3 µm s-1). A data point (an average of 512 measurements) was recorded every 30.1 ms, resulting in ca. 1100 points per line and over 30,000 individual current measurements in an image. The contact diameter of the meniscus and the substrate was determined to be 220-320 nm (see SI), indicative of a SECCM spatial resolution an order of magnitude smaller than the typical µm-range step spacing on ZYA grade HOPG[11] (used throughout this study, see SI). This allowed the basal plane to be probed in isolation, without influence of step edges.
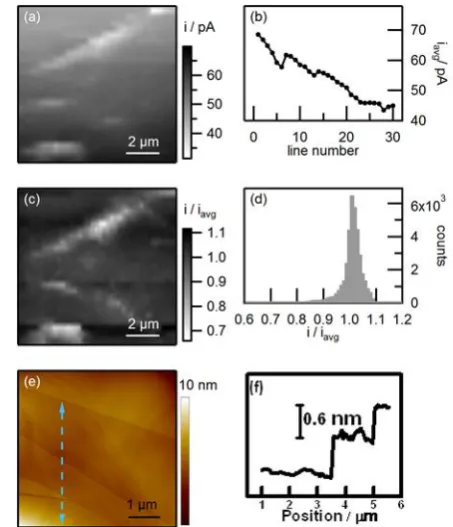
SECCM maps obtained for the one-electron reduction of Ru(NH3)63+ (0.1 M KCl) on HOPG are shown in Figure 2. The topographical map of the surface (Figure 2a) clearly shows parallel steps (also evident from AFM, Figure 2e) across the surface, highlighting the outstanding ability of the technique to accurately track the surface and resolve nanoscale topographical features, despite a slight tilt (~1.5º) on the sample. The steps are especially pronounced in Figure 2b, which shows the AC component of the conductance current (used as the feedback parameter). The sharp
† These authors contributed equally.
[] Dr. S.C.S. Lai, A.N. Patel, K. McKelvey, Prof. Dr. P.R. Unwin
Department of Chemistry University of Warwick
Coventry CV4 7AL, United Kingdom E-mail: [email protected]
K. McKelvey
MOAC doctoral training centre University of Warwick Coventry CV4 7AL
2 attribute to different wetting properties of the basal plane and the
step edge (vide infra).
A simultaneously recorded map of the surface redox activity at the reversible half-wave (formal) potential (-0.25 V vs
[image:3.595.64.344.196.466.2]Ag/AgCl/0.1M KCl), as determined by SECCM voltammetry (SI Figure S3a), shows the currents over the entire surface to be essentially constant at 30.9 ± 1.1 pA (1 σ) (Figure 2c). The step sites show slightly higher currents (2-3%), but this is not necessarily an indicator of higher intrinsic activity, i.e. current density (vide infra). Most importantly, in the regions between the steps (where the electrolyte solution is only in contact with the basal surface), the current is at a constant (high) value.
Figure 2 Reduction of 2 mM Ru(NH3)63+ at HOPG. SECCM maps of (a) topography (z-piezo response), (b) the AC component of the conductance current, (c) surface redox activity recorded at -0.25 V. (d) Normalized activity histogram (see text). (e) AFM image of the area of interest. (f) Line scan along the arrow of the AFM image.
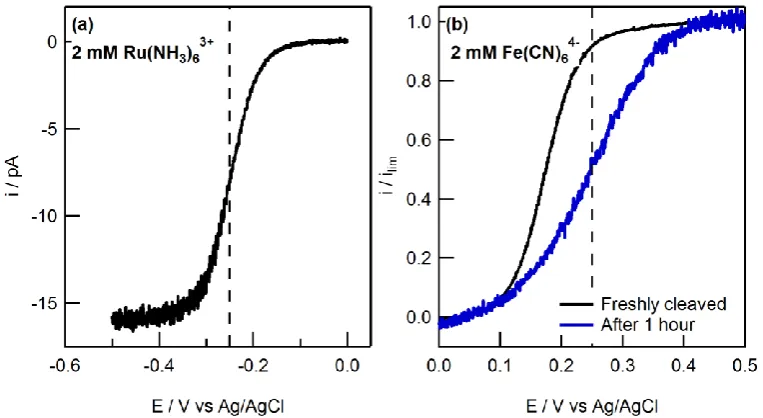
Based on the observed current, an estimate of the standard ET rate constant can be made. The reversible voltammogram for Ru(NH3)6
3+
reduction shows a diffusion limited current of 16 pA (SI Figure S3a) By applying a potential bias of 0.5 V between the two QRCEs the limiting current increased by a factor of 4-5 due to migration. This corresponds to a high mass transport coefficient of ~ 0.5 cm s-1, based on a 300 nm contact diameter. As the currents measured in the SECCM maps at the formal potential are ca. 50% of the transport-limited values, it is evident that the surface redox process measured during imaging is fast, and close to reversible, and we can put a conservative lower estimate on the standard ET rate constant of > 0.5 cms-1 for Ru(NH3)63+ oxidation on basal plane HOPG. That is to say, the process at HOPG would be entirely reversible to essentially all macroscopic electrochemical techniques, including past CV measurements, purely based on the activity of the basal surface, without needing to consider any activity of the step edges. This is in sharp contrast with the previously reported ‘negligible’ activity of the basal surface.[1c,5]
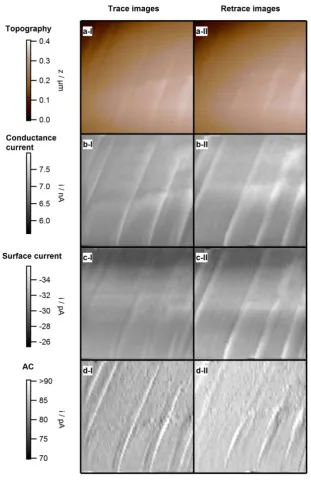
These findings are further validated by the other maps obtained simultaneously during imaging, most notably the consistency between all recorded trace and retrace images (SI section S2.b). The spread in redox activity over the image can be evaluated
[image:3.595.297.524.199.463.2]quantitatively (normalized for each line to minimize time effects), as shown by the histogram in Figure 2d. It can clearly be seen that the total spread in surface currents (ca. 30,000 data points), is less than 5%, indicating a very homogeneously active surface. After performing SECCM measurements, the imaged area was characterized by AFM (Figure 2e) showing a step spacing ranging between 500 nm to 3 µm (Figure 2f), with mainly monolayer steps present. As the lateral contact of SECCM is an order of magnitude smaller than the (average) step spacing, it is without doubt that during the electrochemical mapping the surface in contact with the electrolyte solution would mostly consist of only the HOPG basal plane. Thus, our data provide unambiguous evidence for the very high ET activity of the basal surface.
Figure 3 Oxidation of 2 mM Fe(CN)6 4-
atHOPG. (a) SECCM surface redox activity map recorded at 0.25 V. (b) Average current of each line scan. (c) Normalized SECCM surface redox activity map (see text). (d) Normalized activity histogram (see text). (e) AFM image of the area of interest. (f) Line scan along the arrow of the AFM image.
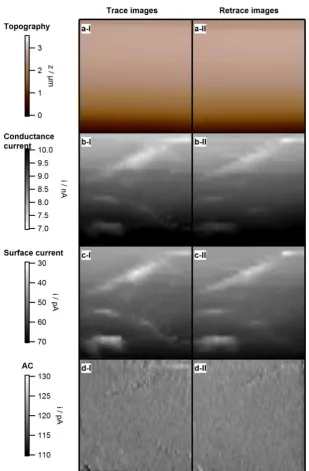
S2b) indicate a stable meniscus contact, and that the meniscus is moved during the scan to areas which have not been exposed to the electrolyte solution. This deterioration has been observed in extensive related experiments in our lab and is due a combination of issues which we will expand on in a later paper. For this study, to probe the relative reactivity of basal and step sites in isolation of time effects, a current distribution was obtained by normalizing each line with the average current of that line (Figure 3c and d). Most of the sites display similar activity (within 10%), although a slight tailing towards lower activity can be seen. Looking at the normalized current SECCM map, the regions of below average current are assigned to the step sites. Furthermore, the difference between the step site and basal plane reactivity appears to increase with time, giving rise to the broad distribution of activity in Figure 3d between 0.7 and 1. This increasing difference could be indicative of a preferential deactivation of step sites over basal plane sites with time, similar to metal electrodes.[12] Based on these data, we can only conclude that the HOPG basal plane is highly active for the Fe(CN)64-/3- benchmark system, being close to reversible initially, albeit with some complications. This contrasts markedly with previous reports, and it should be noted that previously reported ET standard rate constants (10-5 – 10-9 cm s-1, averaged for the surface[3a,6b,6c] or 10-9 cm s-1, extrapolated for the basal surface[1c,3c]) would have yielded negligible (close to zero) currents at the potential of our high mass transport rate studies. Furthermore, it should be noted that the ET rate constants reported here are consistent with predictions from Marcus theory ( > 1 cm s-1).[1b]
Although SECCM clearly illustrates the HOPG basal plane to be highly active, the different currents obtained when imaging directly over step sites is interesting and merits some discussion. We believe this effect is due to the heterogeneous properties of the basal surface versus step edges, resulting in different (nanoscale) wetting and adsorption processes: the excess negative charge on the HOPG step edges[13] could draw in the positively charged Ru(NH3)63+ through electrostatic interaction, causing a slight spreading of the meniscus, thereby increasing the contact area. This finding is supported by an increase in conductance current (SI Figure S2.1), which is a good indicator for variances in meniscus size, and the transient surges in the AC (Figure 2b). Due to the increased contact area, the surface current increases, even if the intrinsic activity remains unchanged going over a step edge. In contrast, for the negatively charged Fe(CN)64- species, we see the conductance current decrease, suggesting that the meniscus slightly contracts when going over a step site (SI Figure S2.2). These data highlight the high information content of SECCM for structure-function imaging of surfaces and interfaces.
In summary, SECCM has allowed us to study ET at basal plane HOPG under conditions of very high mass transport and high spatial resolution, and where the liquid probe makes a series of fresh measurements across the surface. We have been able to isolate the response of the basal plane, and show unambiguously that ET is fast (close to reversible) for the 2 most studied redox couples. This new view – which overturns more than 2 decades of past research[1,3-8] - not only impacts our understanding of the electroactivity of HOPG, but potentially the properties of related sp2 materials, such as carbon nanotubes and graphene, illustrating the importance of our findings. Our studies also demonstrate the significant potential of SECCM as a new nanoscale probe of electrochemical and interfacial processes.
Experimental Section
Experimental details are given in the Supporting Information.
Received: ((will be filled in by the editorial staff))
Published online on ((will be filled in by the editorial staff))
Keywords: Electrochemistry, Graphite, Scanning Electrochemical Cell Microscopy (SECCM), Scanning Probe Microscopy, Surface Analysis.
[1] a) I. Dumitrescu, P. R. Unwin, J. V. Macpherson, Chem. Commun.
2009, 6886-6901; b) R. L. McCreery, Chem. Rev. 2008, 108, 2646-2687; c) C. E. Banks, T. J. Davies, G. G. Wildgoose, R. G. Compton, Chem. Commun. 2005, 829-841; d) M. Pumera, Chem. Soc. Rev. 2010, 39, 4146-4157.
[2] a) M. Zhou, Y. M. Zhai, S. J. Dong, Anal. Chem. 2009, 81, 5603-5613; b) Y. Wang, Z. Q. Shi, Y. Huang, Y. F. Ma, C. Y. Wang, M. M. Chen, Y. S. Chen, J. Phys. Chem. C 2009, 113, 13103-13107; c) L. H. Tang, Y. Wang, Y. M. Li, H. B. Feng, J. Lu, J. H. Li, Adv. Funct. Mater. 2009, 19, 2782-2789; d) C. S. Shan, H. F. Yang, J. F. Song, D. X. Han, A. Ivaska, L. Niu, Anal. Chem. 2009, 81, 2378-2382; e) F. Chen, Q. Qing, J. L. Xia, J. H. Li, N. J. Tao, J. Am. Chem. Soc. 2009, 131, 9908-9909; f) S. Alwarappan, A. Erdem, C. Liu, C. Z. Li, J. Phys. Chem. C 2009, 113, 8853-8857; g) W. Li, C. Tan, M. A. Lowe, H. D. Abruna, D. C. Ralph, ACS Nano 2011, 5, 2264-2270; h) A. T. Valota, I. A. Kinloch, K. S. Novoselov, C. Casiraghi, A. Eckmann, E. W. Hill, R. A. W. Dryfe, ACS Nano 2011, 5, 8809-8815.
[3] a) R. J. Bowling, R. T. Packard, R. L. McCreery, J. Am. Chem. Soc. 1989, 111, 1217-1223; b) X. B. Ji, C. E. Banks, A. Crossley, R. G. Compton, ChemPhysChem 2006, 7, 1337-1344; c) T. J. Davies, R. R. Moore, C. E. Banks, R. G. Compton, J. Electroanal. Chem. 2004, 574, 123-152; d) C. Y. Lee, A. M. Bond, Anal. Chem. 2009, 81, 584-594.
[4] K. R. Kneten, R. L. McCreery, Anal. Chem. 1992, 64, 2518-2524. [5] a) C. E. Banks, R. R. Moore, T. J. Davies, R. G. Compton, Chem.
Commun. 2004, 1804-1805; b) T. J. Davies, M. E. Hyde, R. G. Compton, Angew. Chem.-Int. Edit. 2005, 44, 5121-5126. [6] a) K. K. Cline, M. T. McDermott, R. L. McCreery, J. Phys. Chem.
1994, 98, 5314-5319; b) R. J. Rice, R. L. McCreery, Anal. Chem.
1989, 61, 1637-1641; c) M. T. McDermott, K. Kneten, R. L. McCreery, J. Phys. Chem. 1992, 96, 3124-3130.
[7] a) R. J. Bowling, R. L. McCreery, C. M. Pharr, R. C. Engstrom, Anal. Chem. 1989, 61, 2763-2766; b) P. H. Chen, M. A. Fryling, R. L. McCreery, Anal. Chem. 1995, 67, 3115-3122; c) M. T. McDermott, R. L. McCreery, Langmuir 1994, 10, 4307-4314; d) R. S. Robinson, K. Sternitzke, M. T. McDermott, R. L. McCreery, J. Electrochem. Soc. 1991, 138, 2412-2418; e) R. R. Moore, C. E. Banks, R. G. Compton, Anal. Chem. 2004, 76, 2677-2682; f) C.-Y. Lee, S.-X. Guo, A. M. Bond, K. B. Oldham, J. Electroanal. Chem. 2008, 615, 1-11; g) J. K. Kariuki, M. T. McDermott, Langmuir 1999, 15, 6534-6540.
[8] a) K. Ray, R. L. McCreery, Anal. Chem. 1997, 69, 4680-4687; b) H. Chang, A. J. Bard, Langmuir 1991, 7, 1143-1153.
[9] a) S. C. S. Lai, P. V. Dudin, J. V. Macpherson, P. R. Unwin, J. Am. Chem. Soc. 2011, 133, 10744-10747; b) N. Ebejer, M. Schnippering, A. W. Colburn, M. A. Edwards, P. R. Unwin, Anal. Chem. 2010, 82, 9141-9145.
[10] a) C. G. Zoski, Handbook of Electrochemistry, Elsevier B.V., The Netherlands, 2006; b) R. G. Compton, C. E. Banks,
Understanding Voltammetry, Imperial College Press Co., United Kingdom, 2011.
[11] C. G. Williams, M. A. Edwards, A. L. Colley, J. V. Macpherson, P. R. Unwin, Anal. Chem. 2009, 81, 2486-2495.
[12] a) P. J. Feibelman, S. Esch, T. Michely, Phys. Rev. Lett. 1996, 77, 2257-2260; b) T. Zambelli, J. Wintterlin, J. Trost, G. Ertl, Science
1996, 273, 1688-1690.
[13] R. Koestner, Y. Roiter, I. Kozhinova, S. Minko, J. Phys. Chem. C
4 Entry for the Table of Contents (Please choose one layout)
Nanoscale electrochemical
imaging
Stanley C.S. Lai, Anisha N. Patel, Kim McKelvey and Patrick R. Unwin* __________ Page – Page
Definitive Evidence for Fast Electron Transfer at Basal Plane Graphite from High Resolution Electrochemical Imaging
6
Supporting Information for
Definitive Evidence for Fast Electron Transfer at Basal Plane
Graphite from High Resolution Electrochemical Imaging
Stanley C.S. Lai
‡, Anisha N. Patel
‡, Kim McKelvey and Patrick R. Unwin*
Department of Chemistry and MOAC Doctoral Training Centre, University of Warwick, Coventry CV4 7AL, United Kingdom.
‡These authors contributed equally.
* To whom correspondence should be addressed. E-mail: [email protected].
S.1 Basal plane HOPG sample preparation and characterization S.1a Sample preparation and step edge analysis S.1b Capacitance measurements
S.2 Scanning electrochemical cell microscopy (SECCM) S2a Setup
S.2b Contact area determination S.2c SECCM images
S.1
Basal plane HOPG sample preparation and characterization
S.1a
Sample preparation and
step edge analysis.
A fresh surface was revealed by cleaving with scotch tape, as for the majority of studies carried out on HOPG1 including key
studies in which significant conclusions have been drawn relating to the activity of basal plane HOPG.1b-d,1h,1i,2 From AFM analysis
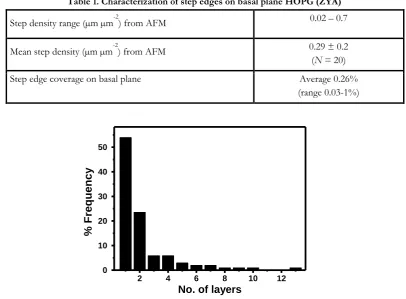
[image:8.595.93.500.239.538.2]of 20 images taken over areas of 3 – 10 µm on 3 different ZYA grade HOPG samples, the step heights in terms of the number of graphite layers was determined and is shown in Figure S1, which shows that ZYA grade HOPG exhibits predominantly monolayer and bilayer steps, and very low step coverage - among the lowest reported - providing the optimum basal surface on which the density of step edges is minimized. The step density is the length of step per unit area of the surface, while data for step edge coverage takes account of different step heights and represents the total amount of edge plane area within a unit area of the basal surface of HOPG.
Table 1. Characterization of step edges on basal plane HOPG (ZYA)
Step density range (µm µm-2) from AFM 0.02 – 0.7
Mean step density (µm µm-2) from AFM 0.29 ± 0.2
(N = 20)
Step edge coverage on basal plane Average 0.26%
(range 0.03-1%)
2 4 6 8 10 12
0 10 20 30 40 50
% Frequ
ency
No. of layers
8
S.1b
Capacitance measurements
The capacitance of HOPG is often used as a measure for surface quality, although a direct relationship between capacitance and step density remains elusive.1c-1g,11 For HOPG surfaces prepared by cleaving with adhesive tape, typical values of 2-3 µF cm-2 can be
found in literature (ref. 1l and references therein). The apparent consensus that the basal plane of HOPG display low (or no) electroactivity was inferred from voltammetric studies of such surfaces.
For our HOPG surfaces, we have found capacitance values ranging from 1.7 to 2.3 µF cm-2, obtained from macroscopic CV
measurements in 1 M KCl at 0.1 V s-1 on ten freshly cleaved HOPG surfaces. The capacitance values of our surfaces lie well within
S.2
Scanning electrochemical cell microscopy (SECCM)
S.2a
Setup
SECCM3 measurements were performed using a system similar to the one described in ref 4, which allowed independent control of
the potential of the substrate and the potential bias between the two quasi-reference counter electrodes (QRCEs) in the tip. The tip was a dual channel probe pulled from borosilicate theta glass capillaries (TGC150-10, Harvard Apparatus) using a CO2-laser puller
(P-2000, Sutter Instruments) to a sharp taper of approximately 400 nm total diameter at the end. The resulting pipet tips were silanized5 to ensure a hydrophobic outer wall. Each channel was filled with the solution of interest and a chloridized silver wire
10
S.2b
Contact area determination
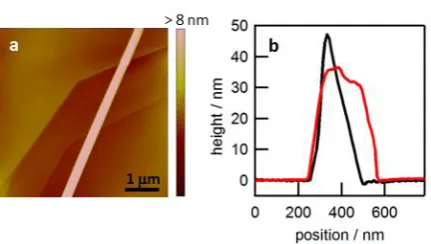
Figure S2.1 Contact area determination of SECCM (a) Tapping mode - atomic force microscope image of polyaniline deposited using SECCM. (d) Cross-sections of deposited polyaniline formed by scanning parallel (red) and perpendicular (black) to the septum in the capillary.
The spatial resolution of SECCM is ultimately determined by the contact area of the meniscus and the substrate, which, in turn, is determined by the tip diameter and local wetting properties. To quantify the contact area, we employed SECCM to
[image:11.595.190.406.86.208.2]S.2c
SECCM images
Figure S2.2 Set of SECCM xy-maps for the reduction of Ru(NH3)63+ obtained during a
[image:12.595.49.361.104.587.2]12 Figure S2.3 Set of SECCM
xy-maps for the reduction of Fe(CN)64- obtained during a
[image:13.595.48.358.68.540.2]S.3
Linear sweep voltammograms obtained with SECCM
Figure S3 Linear sweep voltammograms (LSVs) obtained with the SECCM set-up in the absence of a potential bias between the QRCEs. (a) LSV for the reduction of 2 mM Ru(NH3)63+ (0.1 M KCl). (b) Normalized LSVs for the oxidation of 2 mM Fe(CN)64- (0.1
14
S.4 Experimental
Materials. Analine, hexaamineruthenium(III) chloride (Ru(NH3)6Cl3, Sigma Aldrich, 98%), potassium ferrocyanide (K4Fe(CN)6), Fischer Scientific, analytical grade reagent) and potassium chloride (KCl, Sigma Aldrich , “ReagentPlus”) were all used as received. All aqueous solutions were prepared from ultra-pure water (Millipore MilliQ, resistivity ca. 18.2 MΩ cm at 25 ºC). Dimethyldichlorosilane (Si(CH3)2Cl2, Across Organics, 99+%,) was used to silanize the capillaries.
References
(1) (a) Dumitrescu, I.; Unwin, P. R.; Macpherson, J. V. Chem. Commun.2009, 7345, 6886-901;
(b) Banks, C. E.; Davies, T. J.; Wildgoose, G. G.; Compton, R. G. Chem. Commun2005, 829-841; (c) Bowling, R. J.; Packard, R. T.; Mccreery, R. L. J. Am. Chem. Soc.1989, 111, 1217-1223;
(d) Rice, R. J.; McCreery, R. L. Anal. Chem.1989, 61, 1637-1641; (e) Kneten, K. R.; McCreery, R. L. Anal. Chem.1992, 64, 2518-2524;
(f) Cline, K. K.; Mcdermott, M. T.; Mccreery, R. L. J. Phys. Chem.1994, 98, 5314-5319; (g) McDermott, M. T.; Kneten, K.; Mccreery, R. L. J. Phys. Chem.1992, 96, 3124-3130; (h) Ji, X.; Banks, C. E.; Crossley, A.; Compton, R. G. ChemPhysChem2006, 7, 1337-1344;
(i) Davies, T. J.; Moore, R. R.; Banks, C. E.; Compton, R. G. J. Electroanal. Chem.2004, 574, 123-152; (j) Liu, H.; Favier, F.; Ng, K.; Zach, M. P.; Penner, R. M. Electrochim. Acta2001, 47, 671-677; (k) Xu, J.; Chen, Q.; Swain, G. M. Anal. Chem.1998, 70, 3146-3154.
(l) McCreery, R.L. Chem. Rev.2008, 108, 2646-2687.
(2) (a) Bowling, R.; Packard, R. T.; McCreery, R. L. Langmuir1989, 5, 683-688;
(b) Bowling, R. J.; McCreery, R. L.; Pharr, C. M.; Engstrom, R. C. Analytical1989, 61, 2763-2766; (c) Alsmeyer, Y. W.; McCreery, R. L. Langmuir1991, 7, 2370-2375;