http://wrap.warwick.ac.uk/
Original citation:
ATLAS Collaboration (Including: Farrington, Sinead and Jones, G. (Graham)). (2013)
Measurement of the inclusive jet cross-section in pp collisions at s√=2.76 TeV and
comparison to the inclusive jet cross-section at s√=7 TeV using the ATLAS detector. The
European Physical Journal C, Volume 73 (Number 8). Article Number 2509.
Permanent WRAP url:
http://wrap.warwick.ac.uk/59688
Copyright and reuse:
The Warwick Research Archive Portal (WRAP) makes this work of researchers of the
University of Warwick available open access under the following conditions.
This article is made available under the Creative Commons Attribution- 3.0 Unported
(CC BY 3.0) license and may be reused according to the conditions of the license. For
more details see
http://creativecommons.org/licenses/by/3.0/
A note on versions:
The version presented in WRAP is the published version, or, version of record, and may
be cited as it appears here.
Eur. Phys. J. C (2013) 73:2509 DOI 10.1140/epjc/s10052-013-2509-4
Regular Article - Experimental Physics
Measurement of the inclusive jet cross-section in pp collisions
at
√
s
=
2.76 TeV and comparison to the inclusive jet cross-section
at
√
s
=
7 TeV using the ATLAS detector
The ATLAS Collaboration CERN, 1211 Geneva 23, Switzerland
Received: 17 April 2013 / Revised: 13 June 2013 / Published online: 3 August 2013
© CERN for the benefit of the ATLAS collaboration 2013. This article is published with open access at Springerlink.com
Abstract The inclusive jet cross-section has been measured in proton–proton collisions at√s=2.76 TeV in a dataset corresponding to an integrated luminosity of 0.20 pb−1 col-lected with the ATLAS detector at the Large Hadron Col-lider in 2011. Jets are identified using the anti-kt algorithm
with two radius parameters of 0.4 and 0.6. The inclusive jet double-differential cross-section is presented as a function of the jet transverse momentumpTand jet rapidityy,
cov-ering a range of 20≤pT<430 GeV and|y|<4.4. The
ratio of the cross-section to the inclusive jet cross-section measurement at√s=7 TeV, published by the ATLAS Col-laboration, is calculated as a function of both transverse mo-mentum and the dimensionless quantity xT=2pT/
√ s, in bins of jet rapidity. The systematic uncertainties on the ra-tios are significantly reduced due to the cancellation of cor-related uncertainties in the two measurements. Results are compared to the prediction from next-to-leading order per-turbative QCD calculations corrected for non-perper-turbative effects, and next-to-leading order Monte Carlo simulation. Furthermore, the ATLAS jet cross-section measurements at
√
s=2.76 TeV and √s =7 TeV are analysed within a framework of next-to-leading order perturbative QCD calcu-lations to determine parton distribution functions of the pro-ton, taking into account the correlations between the mea-surements.
1 Introduction
Collimated jets of hadrons are a dominant feature of high-energy particle interactions. In Quantum Chromodynamics (QCD) they can be interpreted in terms of the fragmentation of quarks and gluons produced in a scattering process. The inclusive jet production cross-section provides information
e-mail:[email protected]
on the strong coupling and the structure of the proton, and tests the validity of perturbative QCD (pQCD) down to the shortest accessible distances.
The inclusive jet cross-section has been measured at high energy in proton–antiproton (pp) collisions with√s=
546 GeV and 630 GeV at the SPS [1–5], and with√s=
546 GeV, 630 GeV, 1.8 TeV and 1.96 TeV at the Tevatron [6–22].
The Large Hadron Collider (LHC) [23] at CERN allows the production of jets with transverse momenta in the TeV regime, colliding protons on protons (pp) with a centre-of-mass energy of currently up to√s=8 TeV. The ATLAS Collaboration has presented early measurements of the in-clusive jet cross-section at√s=7 TeV based on a dataset with an integrated luminosity of 17 nb−1 for jets with a
transverse momentum of 60≤pT<600 GeV and a rapid-ity1 of |y|<2.8 [24], as well as for the entire dataset of 37 pb−1taken in 2010 for jets with 20≤pT<1500 GeV and|y|<4.4 [25]. The CMS Collaboration has presented results in the kinematic range of 18≤pT <1100 GeV and|y|<3 in a dataset of 34 pb−1 [26], in the range of 35≤pT<150 GeV and 3.2<|y|<4.7 using 3.1 pb−1 [27], and for 0.1≤pT<2 TeV and|y|<2.5 using 5.0 fb−1 [28]. These data are found to be generally well described by next-to-leading order (NLO) pQCD calculations, corrected for non-perturbative effects from hadronisation and the un-derlying event.
At the start of the 2011 data taking period of the LHC, the ATLAS experiment collected pp collision data at√s=2.76 TeV corresponding to an integrated luminos-ity of 0.20 pb−1. Having a centre-of-mass energy close to the highest energies reached in pp collisions, the dataset
1Rapidity is defined asy=0.5 ln[(E+p
z)/(E−pz)]whereEdenotes
the energy andpzis the component of the momentum along the beam
Page 2 of 56 Eur. Phys. J. C (2013) 73:2509
provides a connection from LHC measurements to previ-ous measurements at the Tevatron. Moreover, measurements with the same detector at different centre-of-mass energies provide stringent tests of the theory, since the dominant sys-tematic uncertainties are correlated. These correlations can be explored in a common fit to the measurements at differ-ent √s or in ratios of the inclusive jet double-differential cross-sections. Hence, uncertainties can be significantly re-duced. Such ratios were reported by previous experiments, UA2 [2], UA1 [4], CDF [7,9] and D0 [12].
In this paper the inclusive jet double-differential cross-section is measured for 20≤pT<430 GeV and rapidities of |y|<4.4 at√s=2.76 TeV. Moreover, the ratio to the previously measured cross-section at √s=7 TeV [25] is determined as a function ofpT and as a function of the di-mensionless quantityxT=2pT/√s[29]. For the ratio mea-sured as a function ofpT, many experimental systematic
un-certainties cancel, while for the ratio measured as a function of xT, theoretical uncertainties are reduced. This allows a precise test of NLO pQCD calculations.
The outline of the paper is as follows. The definition of the jet cross-section is given in the next section, followed by a brief description of the ATLAS detector in Sect.3and the data taking in Sect.4. The Monte Carlo simulation, the the-oretical predictions and the uncertainties on the predictions are described in Sects.5and6, followed by the event selec-tion in Sect.7and the jet reconstruction and calibration in Sect.8. The unfolding of detector effects and the treatment of systematic uncertainties are discussed in Sects.9and10, followed by the results of the inclusive jet cross-section at
√
s=2.76 TeV in Sect.11. The results of the ratio measure-ment, including the discussion of its uncertainties, are pre-sented in Sect.12. In Sect.13the results of an NLO pQCD fit to these data are discussed. The conclusion is given in Sect.14.
2 Definition of the measured variables
2.1 Inclusive single-jet cross-section
Jets are identified using the anti-kt algorithm [30]
imple-mented in the FASTJET[31,32] software package. Two dif-ferent values of the radius parameter,R=0.4 andR=0.6, are used. Inputs to the jet algorithm can be partons in the NLO pQCD calculation, stable particles after the hadroni-sation process in the Monte Carlo simulation, or energy de-posits in the calorimeter in data.
Throughout this paper, the jet cross-section refers to the cross-section of jets built from stable particles, defined by having a proper mean lifetime ofcτ >10 mm. Muons and neutrinos from decaying hadrons are included in this defini-tion.
The inclusive jet double-differential cross-section,d2σ/ dpTdy, is measured as a function of the jet transverse mo-mentumpTin bins of rapidityy. The kinematic range of the
measurement is 20≤pT<430 GeV and|y|<4.4.
The jet cross-section is also measured as a function of the dimensionless quantityxT. For a pure 2→2 central scatter-ing of the partons,xT gives the momentum fraction of the
initial-state partons with respect to the parent proton.
2.2 Ratio of jet cross-sections
at different centre-of-mass energies
The inclusive jet double-differential cross-section can be re-lated to the invariant cross-section according to
Ed 3σ
dp3 =
1 2πpT
d2σ
dpTdy, (1)
whereE andp denote the energy and momentum of the jet, respectively. The dimensionless scale-invariant cross-sectionF (y, xT)can be defined as [33]:
F (y, xT,√s)=p4TEd 3σ
dp3 = p3T
2π d2σ
dpTdy = s
8πx 3 T
d2σ
dxTdy.
(2)
In the simple quark–parton model [34,35],F does not de-pend on the centre-of-mass energy, as follows from dimen-sional analysis. In QCD, however, several effects lead to a violation of the scaling behaviour, introducing apT(or
√ s) dependence toF. The main effects are the scale dependence of the parton distribution functions (PDFs) and the strong coupling constantαS.
The cross-section ratio of the invariant jet cross-section measured at√s=2.76 TeV to the one measured at√s=
7 TeV is then denoted by:
ρ(y, xT)=F (y, xT,2.76 TeV)
F (y, xT,7 TeV) . (3)
The violation of the √s scaling leads to a deviation of
ρ(y, xT)from one.ρ(y, xT)is calculated by measuring the bin-averaged inclusive jet double-differential cross-sections at the two centre-of-mass energies in the samexTranges:
ρ(y, xT)=
2.76 TeV 7 TeV
3
·σ (y, xT,2.76 TeV) σ (y, xT,7 TeV)
, (4)
whereσ (y, xT,√s)corresponds to the measured averaged cross-sectiond2σ/dpTdyin a bin(y, pT=
√
s·xT/2), and xTis chosen to be at the bin centre. Here, thepTbinning for the inclusive jet cross-section at√s=2.76 TeV is chosen such that it corresponds to the samexTranges obtained from thepT bins of the jet cross-section measurement at
√ s=
Eur. Phys. J. C (2013) 73:2509 Page 3 of 56
The ratio of inclusive double-differential cross-sections is also measured as a function of pT, where the samepT
binning is used for both centre-of-mass energies. This ratio is denoted by
ρ(y, pT)=σ (y, pT,2.76 TeV) σ (y, pT,7 TeV)
, (5)
whereσ (y, pT,√s)is the measured averaged cross-section
d2σ/dpTdy in a bin(y, pT)at a centre-of-mass energy of √
s. Since the uncertainty due to the jet energy scale is the dominant experimental uncertainty at a givenpT, the
exper-imental systematic uncertainty is significantly reduced by taking the cross-section ratio in the samepTbins.
3 The ATLAS detector
The ATLAS detector consists of a tracking system (inner detector) in a 2 T axial magnetic field up to a pseudorapid-ity2 of |η| = 2.5, sampling electromagnetic and hadronic calorimeters up to|η| =4.9, and muon chambers in an az-imuthal magnetic field provided by a system of toroidal magnets. A detailed description of the ATLAS detector can be found elsewhere [36].
The inner detector consists of layers of silicon pixel de-tectors, silicon microstrip detectors and transition radiation tracking detectors. It is used in this analysis to identify can-didate collision events by constructing vertices from tracks. Jets are reconstructed using the energy deposits in the calo-rimeter, whose granularity and material varies as a function of η. The electromagnetic calorimeter uses lead as an ab-sorber, liquid argon (LAr) as the active medium and has a fine granularity. It consists of a barrel (|η|<1.475) and an endcap (1.375<|η|<3.2) region. The hadronic calorime-ter is divided into three distinct regions: a barrel region (|η|<0.8) and an extended barrel region (0.8<|η|<1.7) instrumented with a steel/scintillating-tile modules, and an endcap region (1.5<|η|<3.2) using copper/LAr modules. Finally, the forward calorimeter (3.1<|η|<4.9) is instru-mented with copper/LAr and tungsten/LAr modules to pro-vide electromagnetic and hadronic energy measurements, respectively.
The ATLAS trigger system is composed of three consec-utive levels: level 1, level 2 and the event filter, with progres-sively increasing computing time per event, finer granular-ity and access to more detector systems. For jet triggering,
2ATLAS uses a right-handed coordinate system with its origin at the
nominal interaction point (IP) in the centre of the detector and thez
-axis along the beam pipe. Thex-axis points from the IP to the centre
of the LHC ring, and they-axis points upward. The pseudorapidity is
defined in terms of the polar angleθasη= −ln tan(θ/2).
the relevant systems are the minimum bias trigger scintilla-tors (MBTS), located in front of the endcap cryostats cover-ing 2.1<|η|<3.8, as well as calorimeter triggers for cen-tral jets, covering|η|<3.2, and for forward jets, covering 3.1<|η|<4.9, respectively.
4 Data taking
The proton–proton collision data at √s=2.76 TeV were collected at the start of the 2011 data taking period of the LHC. The total integrated luminosity of the collected data is 0.20 pb−1. The proton bunches were grouped in nine bunch trains. The time interval between two consecutive bunches was 525 ns. The average number of interactions per bunch crossing is found to be μ=0.24. All events used in this analysis were collected with good operational status of the relevant detector components for jet measurements.
The data at√s=7 TeV have a total integrated luminos-ity of 37 pb−1. Further details are given in Ref. [25].
5 Monte Carlo simulation
Events used in the simulation of the detector response are produced by the PYTHIA 6.423 generator [37], using the MRST 2007 LO* PDFs [38]. The generator utilises leading-order (LO) pQCD matrix elements for 2→2 pro-cesses, along with a leading-logarithmic pT-ordered
par-ton shower [39], an underlying event simulation with multi-ple parton interactions [40], and the Lund string model for hadronisation [41]. The event generation uses the ATLAS Minimum Bias Tune 1 (AMBT1) set of parameters [42]. Additional proton–proton collisions occurring in the same bunch crossing have not been simulated because the average number of interactions per beam crossing is so small.
The GEANTsoftware toolkit [43] within the ATLAS sim-ulation framework [44] simulates the propagation of the generated particles through the ATLAS detector and their interactions with the detector material.
The HERWIG++ 2.5.1 [45,46] generator is used in addi-tion to PYTHIAin the evaluation of non-perturbative effects in the theory prediction. It is based on the 2→2 LO pQCD matrix elements and a leading-logarithmic angular-ordered parton shower [47]. The cluster model [48] is used for the hadronisation, and an underlying event simulation is based on the eikonal model [49].
6 Theoretical predictions
6.1 NLO pQCD prediction
calcula-Page 4 of 56 Eur. Phys. J. C (2013) 73:2509
tions with various PDFs and factorisation and renormalisa-tion scales, the APPLGRIDsoftware [51] is interfaced with NLOJET++. The renormalisation scale, μR, and the fac-torisation scale, μF, are chosen for each event as μR = μF =pTmax(yi), wherepmaxT (yi)is the maximum jet
trans-verse momentum found in a rapidity bin yi. If jets are present in different rapidity bins, several scales within the event are used.
The default calculation uses the CT10 [52] PDF set. Pre-dictions using the PDF sets MSTW 2008 [53], NNPDF 2.1 (100) [54,55], HERAPDF 1.5 [56] and ABM 11 NLO (nf =5) [57] are also made for comparison. The value for αSis taken from the corresponding PDF set.
Three sources of uncertainty in the NLO pQCD calcu-lation are considered, namely the uncertainty on the PDF sets, the choice of factorisation and renormalisation scales, and the uncertainty on the value of the strong coupling con-stant,αS. The PDF uncertainty is defined at 68 % confidence
level (CL) and evaluated following the prescriptions given for each PDF set and the PDF4LHC recommendations [58]. The uncertainty on the scale choice is evaluated by vary-ing the renormalisation scale and the factorisation scale by a factor of two with respect to the original choice in the cal-culation. The considered variations are
(fμR, fμF)=(0.5,0.5), (0.5,1), (1,0.5),
(1,2), (2,1), (2,2), (6)
wherefμR andfμF are factors for the variation of renor-malisation and factorisation scales, henceμR=fμR·pmaxT
andμF =fμF ·pTmax. The envelope of the resulting varia-tions is taken as the scale uncertainty. The uncertainty re-flecting theαS measurement precision is evaluated follow-ing the recommendation of the CTEQ group [59], by cal-culating the cross-section using a series of PDFs which are derived with various fixed αS values. Electroweak correc-tions are not included in the theory prediccorrec-tions. The effect is found to beO(10 %)at highpT, and negligible at smallpT
for√s=7 TeV [60].
The theoretical predictions for the cross-section ratios at the two different energies,ρ(y, xT)orρ(y, pT), are also ob-tained from the NLO pQCD calculations. The evaluation of the prediction at√s=7 TeV is given in Ref. [25], and the procedure is identical to the one used for √s=2.76 TeV in the present analysis. Hence, the uncertainty on the ra-tio is determined using the same variara-tion in each compo-nent of the considered uncertainties simultaneously for both
√
s=2.76 TeV and√s=7 TeV cross-section predictions.
6.2 Non-perturbative corrections
The fixed-order NLO pQCD calculations, described in Sect. 6.1, predict the parton-level cross-section, which
should be corrected for non-perturbative effects before com-parison with the measurement at particle level. The correc-tions are derived using LO Monte Carlo event generators complemented by the leading-logarithmic parton shower by evaluating the bin-wise ratio of the cross-section with and without hadronisation and the underlying event. Each bin of the NLO pQCD cross-section is then multiplied by the corresponding correction for non-perturbative effects. The baseline correction factors are obtained from PYTHIA
6.425 [37] with the AUET2B CTEQ6L1 tune [61]. The un-certainty is estimated as the envelope of the correction fac-tors obtained from a series of different generafac-tors and tunes: PYTHIA6.425 using the tunes AUET2B LO** [61], AUET2 LO** [62], AMBT2B CTEQ6L1 [61], AMBT1 [42], Peru-gia 2010 [63] and Perugia 2011 [63]; PYTHIA 8.150 [64] with tune 4C [61]; and HERWIG++ 2.5.1 [45] with tune UE7000-2 [61]. The AMBT2B CTEQ6L1 and AMBT1 tunes, which are based on observables sensitive to the mod-elling of minimum bias interactions, are included to provide a systematically different estimate of the underlying event activity.
The NLO pQCD prediction for the cross-section ra-tio also needs correcra-tions for non-perturbative effects. The same procedure is used to evaluate non-perturbative correc-tions for the cross-section at√s=7 TeV using the same series of generator tunes. A ratio of corrections at √s=
2.76 TeV and √s=7 TeV is calculated for each genera-tor tune. As for the cross-section, PYTHIA 6.425 with the AUET2B CTEQ6L1 tune is used as the central value of the correction factor for the cross-section ratio and the envelope of the correction factors from the other tunes is taken as an uncertainty.
6.3 Predictions from NLO matrix elements with parton-shower Monte Carlo simulation
The measured jet cross-section is also compared to predic-tions from POWHEGjet pair production, revision 2169 [65,
66]. POWHEGis an NLO generator that uses the POWHEG
BOX1.0 package [67–69], which can be interfaced to differ-ent Monte Carlo programs to simulate the parton shower, the hadronisation and the underlying event. This simulation us-ing a matched parton shower is expected to produce a more accurate theoretical prediction. However, ambiguities in the matching procedure, non-optimal tuning of parton shower-parameters, and the fact that it is a hybrid between an NLO matrix element calculation and the currently available LO parton-shower generators may introduce additional theoret-ical uncertainties.
Eur. Phys. J. C (2013) 73:2509 Page 5 of 56
Fig. 1 The uncertainty in the NLO pQCD prediction of the inclusive
jet cross-section at√s=2.76 TeV, calculated using NLOJET++ with
the CT10 PDF set, for anti-ktjets withR=0.6 shown in three
repre-sentative rapidity bins as a function of the jetpT. In addition to the
total uncertainty, the uncertainties from the scale choice, the PDF set
and the strong coupling constant,αS, are shown separately
the outgoing partons, pBornT . In addition to the hard scat-ter, POWHEG also generates the hardest partonic emission in the event. The event is evolved to the particle level us-ing a parton-shower event generator, where the radiative emissions in the parton showers are limited by the match-ing scaleμM provided by POWHEG. The simulation of
par-ton showers uses PYTHIAwith the ATLAS underlying event tunes, AUET2B [61] and Perugia 2011 [63]. The tunes are derived from the standalone versions of these event genera-tors, with no optimisation for the POWHEGpredictions. The CT10 PDF set is used in both POWHEGand PYTHIA.
To avoid fluctuations in the final observables after the showering process, the POWHEG event generation is per-formed using a new option3 that became available re-cently [66]. ForpT<100 GeV, this new prediction differs byO(10 %)from the POWHEGprediction at√s=7 TeV from the previous analysis, which followed a different ap-proach [25]. The uncertainty from the renormalisation and factorisation scales for the POWHEGprediction is expected to be similar to that obtained with NLOJET++. The match-ing scale can potentially have a large impact on the cross-section prediction at particle level, affecting the parton shower, initial-state radiation and multiple interactions, but a procedure to estimate this uncertainty is currently not well defined. Therefore no uncertainties are shown for the POWHEGcurves.
3The origin of these fluctuations are rare event topologies in gluon
emissions q→qg and gluon splittingsg→qq¯, related to the fact
that by default POWHEGBOX1.0 does not consider the
correspond-ing configurations with opposite ordercorrespond-ing of thepTfor the final state
parton:q→gqandg→ ¯qq. These processes can be activated in
revi-sion 2169 using the POWHEGoptiondoublefsr=1, which offers
an improved handling of the suppression of these events. More details
are given in Ref. [66].
6.4 Prediction for the inclusive jet cross-section at√s=2.76 TeV
The evaluated relative uncertainties of the NLO pQCD cal-culation for the inclusive jet cross-section at√s=2.76 TeV are shown in Fig.1 as a function of the jet pT for
repre-sentative rapidity bins andR=0.6. In the central rapidity region, the uncertainties are about 5 % forpT100 GeV,
increasing to about 15 % in the highest jetpT bin. In the most forward region, they are 10 % in the lowestpTbin and up to 80 % in the highestpTbin. In the higherpTregion,
the upper bound on the uncertainty is driven by the PDF un-certainty, while the lower bound and the uncertainty at low
pTare dominated by the scale choice. The uncertainties for
R=0.4 are similar.
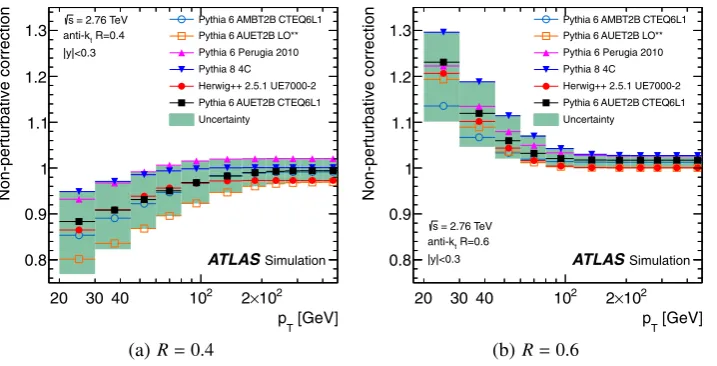
The correction factors for non-perturbative effects and their uncertainties are shown in Fig.2for the inclusive jet cross-section at√s=2.76 TeV in the central rapidity bin. For jets withR=0.4, the correction is about−10 % in the lowestpTbin, while for jets withR=0.6, it is about+20 % as a result of the interplay of the hadronisation and the un-derlying event for the different jet sizes. In the high-pT re-gion, the corrections are almost unity for both jet radius pa-rameters, and the uncertainty is at the level of±2 %.
6.5 Prediction for the cross-section ratio
Figures3(a)–(c) show the uncertainty on the NLO pQCD calculation of ρ(y, xT) in representative rapidity bins for R=0.6. They are significantly reduced to a level of a few percent in the central rapidity region compared to the uncer-tainties on the cross-sections shown in Fig.1. The dominant uncertainty at lowpT is the uncertainty on the renormali-sation and factorirenormali-sation scale choice, while at highpT the
Page 6 of 56 Eur. Phys. J. C (2013) 73:2509
Fig. 2 Non-perturbative correction factors for the inclusive jet
cross-section for anti-kt jets with (a)R=0.4 and (b)R=0.6 in the jet
rapidity region|y|<0.3 as a function of the jetpTfor Monte Carlo
simulations with various tunes. The correction factors derived from
PYTHIA6 with the AUET2B CTEQ6L1 tune (full-square) are used for the NLO pQCD prediction in this measurement, with the uncertainty indicated by the shaded area. For better visibility, some tunes used in the uncertainty determination are not shown
Fig. 3 The uncertainty in the NLO pQCD prediction of the
cross-section ratioρ(y, xT)((a)–(c)) andρ(y, pT)((d)–(f)), calculated
us-ing NLOJET++ with the CT10 PDF set, for anti-ktjets withR=0.6
shown in three representative rapidity bins as a function of the jetxT
and of the jetpT, respectively. In addition to the total uncertainty, the
uncertainties from the scale choice, the PDF set and the strong coupling
[image:7.595.51.541.317.669.2]Eur. Phys. J. C (2013) 73:2509 Page 7 of 56
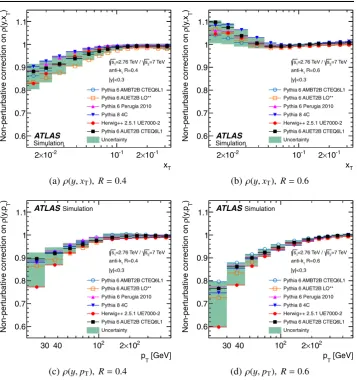
Fig. 4 Non-perturbative
correction factors for the
cross-section ratios,ρ(y, xT)
andρ(y, pT), for anti-ktjets
withR=0.4 orR=0.6 shown
for a jet rapidity of|y|<0.3 for
Monte Carlo simulations with various tunes as a function of
the jetxTand of the jetpT,
respectively. The correction
factors derived from PYTHIA6
with the AUET2B CTEQ6L1 tune (full-square) are used for the NLO pQCD prediction in this measurement, with the uncertainty indicated by the shaded area. For better visibility, some tunes used in the uncertainty determination are not shown
The NLO pQCD calculation ofρ(y, pT)has an uncertainty of less than±5 % forpTup to 200 GeV in the central rapid-ity region, as shown in Fig.3(d). The uncertainty increases for higherpT of the jet due mostly to the uncertainties on
the PDFs, which are below 10 % for central jets. In the for-ward region, it reaches up to 80 % in the highest pT bins,
as shown in Figs.3(e) and3(f). The corresponding uncer-tainties for jets withR=0.4 are similar, except for a larger contribution due to the scale choice in the uncertainty on
ρ(y, pT).
Non-perturbative corrections toρ(y, xT)have a different
xTdependence for jets withR=0.4 andR=0.6, as shown
in Figs.4(a) and4(b). The behaviour ofρ(y, xT)is driven by the corrections for the cross-section at√s=2.76 TeV sincepT7 TeV=(7/2.76)·p2.76 TeVT in the samexTbins (see AppendixA) and since the non-perturbative correction is al-most flat in the high-pT region. For jets withR=0.4, the
correction is−10 % in the lowestxT bin. ForR=0.6, the correction in this region is in the opposite direction, increas-ing the prediction by+10 %. The uncertainty in the lowest
xT bin for both radius parameters is ∼ ±10 %. The
non-perturbative corrections toρ(y, pT)are shown in Figs.4(c)
and4(d), where a similarpT dependence for R=0.4 and
R =0.6 is found. They amount to −10 % for jets with
R=0.4 and −25 % for jets with R =0.6 in the lowest
pT bins. This is due to the correction factors for the NLO pQCD prediction at√s=7 TeV [25] being larger than those at√s=2.76 TeV. Corrections obtained from PYTHIAwith various tunes generally agree within 5 % for central jets, while the non-perturbative corrections from HERWIG++ de-viate from the ones of the PYTHIAtunes by more than 10 % in the lowestpTbin.
7 Event selection
Events are selected online using various trigger definitions according to thepTand the rapidityyof the jets [70]. In the
lowestpTregion (pT<35 GeV for|y|<2.1,pT<30 GeV for 2.1≤ |y|<2.8,pT<28 GeV for 2.8≤ |y|<3.6, and
pT<26 GeV for 3.6≤ |y|<4.4), a trigger requiring at least
Page 8 of 56 Eur. Phys. J. C (2013) 73:2509
scale.4The efficiency of the jet-based triggers is determined using the MBTS, and the one for MBTS using the indepen-dent trigger from the Zero Degree Calorimeter [71]. Only triggers that are >99 % efficient for a given jet pT value are used. In the region 2.8<|y|<3.6, both a central and a forward jet trigger are used in combination to reach an effi-ciency of >99 %. Events are required to have at least one well-reconstructed event vertex, which must have at least three associated tracks with a minimumpTof 150 MeV.
8 Jet reconstruction and calibration
The reconstruction procedure and the calibration factors for the jet cross-section measurement at √s =2.76 TeV are nearly identical to those used for the measurement at
√
s=7 TeV with 2010 data [25]; the few exceptions are explicitly specified below.
Jets are reconstructed with the anti-kt algorithm using
as input objects topological clusters [72,73] of energy de-posits in the calorimeter, calibrated at the electromagnetic scale. The four-momenta of the reconstructed jets are cor-rected event-by-event using the actual vertex position. A jet energy scale (JES) correction is then applied to correct for detector effects such as energy loss in dead material in front of the calorimeter or between calorimeter segments, and to compensate for the lower calorimeter response to hadrons than to electrons or photons [72,73]. Due to the low num-ber of interactions per bunch crossing, an offset correction accounting for additional energy depositions from multiple interactions in the same bunch crossing, so-called pile-up, is not applied in this measurement.
The estimation of the uncertainty in the jet energy mea-surement uses single-hadron calorimeter response measure-ments [74] and systematic Monte Carlo simulation varia-tions. An uncertainty of about 2.5 % in the central calorime-ter region over a wide momentum range of 60≤ pT <
800 GeV is obtained [73]. For jets with lowerpT and for forward jets the uncertainties are larger.
All reconstructed jets withpT>20 GeV,|y|<4.4 and a positive decision from the trigger that is used in the cor-responding jet kinematic region are considered in this anal-ysis. Jets are furthermore required to pass jet quality selec-tions to reject fake jets reconstructed from non-collision sig-nals, such as beam-related background, cosmic rays or de-tector noise. The applied selections were established with the √s =7 TeV data in 2010 [25, 73] and are validated in the √s =2.76 TeV data by studying distributions of
4The electromagnetic scale is the basic calorimeter signal scale for the
ATLAS calorimeter. It has been established using test-beam measure-ments for electrons and muons to give the correct response for the en-ergy deposited in electromagnetic showers, but it does not correct for the lower response of the calorimeter to hadrons.
the selection variables with techniques similar to those in Ref. [73]. The rate of fake jets after the jet selection is neg-ligible.
The efficiency of the jet quality selection is measured us-ing a tag-and-probe method [73]. The largest inefficiency is found to be below 4 % for jets with pT =20 GeV. Within the statistical uncertainty, the measured efficiency is in good agreement with the efficiency previously measured for√s=7 TeV data in 2010. Because of the larger number of events in the 2010 data at√s=7 TeV, the jet selection efficiency from the 2010 data is taken.
Various types of validity and consistency checks have been performed on the data, such as testing the expected in-variance of the jet cross-section as a function ofφ, or the stability of the jet yield over time. No statistically signifi-cant variations are detected. The basic kinematic variables are described by the Monte Carlo simulation within the sys-tematic uncertainties.
9 Unfolding of detector effects
Corrections for the detector inefficiencies and resolutions are performed to extract the particle-level cross-section, based on a transfer matrix that relates thepT of the jet at particle-level and the reconstruction-level.
For the unfolding, the Iterative, Dynamically Stabilised (IDS) Bayesian unfolding method [75] is used. The method takes into account the migrations of events across the bins and uses data-driven regularisation. It is performed sepa-rately for each rapidity bin, since migrations acrosspTbins are significant. The migrations across rapidity bins, which are much smaller, are taken into account using the bin-by-bin unfolding.
The Monte Carlo simulation to derive the transfer ma-trix is described in Sect.5. The Monte Carlo samples are reweighted on a jet-by-jet basis as a function of jetpTand rapidity. The reweighting factors are obtained from the ra-tio of calculated cross-secra-tions using the MSTW 2008 NLO PDF set [53] with respect to the MRST 2007 LO* PDF set [38]. This improves the description of the jetpT
distri-bution in data. Additionally, a jet selection similar to the jet quality criteria in data is applied to jets with lowpT in the
Monte Carlo simulation at|η| ∼1.
The transfer matrix for the jetpTis derived by matching
a particle-level jet to a reconstructed jet based on a geometri-cal criterion, in which a particle-level jet and a reconstructed jet should be closest to each other within a radius ofR=0.3 in the(η, φ)-plane. The spectra of unmatched particle-level and reconstructed jets are used to provide the matching ef-ficiencies, obtained from the number of the matched jets di-vided by the number of all jets including unmatched jets, both for particle-level jets,part, and for reconstructed jets,
Eur. Phys. J. C (2013) 73:2509 Page 9 of 56
The data are unfolded to particle level using a three-step procedure, namely, correction for matching inefficiency at reconstructed level, unfolding for detector effects and then correction for matching inefficiency at particle level. The fi-nal result is given by the equation:
Nipart= j
Njreco·jrecoAij/ipart, (7)
wherei and j are the particle-level and reconstructed bin indices, respectively, and Nkpart and Nkreco are the number of particle-level jets and the number of reconstructed jets in bink.Aij is an unfolding matrix, which gives the
probabil-ity for a level jet with a certain reconstructed-level pTto have a given particle-levelpT. It is determined
using the IDS method. The number of iterations is chosen such that the bias in the closure test (see below) is small and at most at the percent level. In this measurement, this is achieved after one iteration.
The precision of the unfolding technique has been stud-ied using a data-driven closure test [75]. In this study the particle-levelpTspectrum in the Monte Carlo simulation is
reweighted and convolved through the folding matrix, which gives the probability for a particle-level jet with a certain particle-levelpTto have a given reconstructed-levelpT. The
weights are chosen such that significantly improved agree-ment between the resulting reconstructed spectrum and data is attained. The reconstructed spectrum in this reweighted Monte Carlo simulation is then unfolded using the same pro-cedure as for the data. Comparison of the spectrum obtained from the unfolding with the original reweighted particle-level spectrum provides an estimate of the bias, which is interpreted as the systematic uncertainty.
As an estimate of further systematic uncertainties, the un-folding procedure is repeated using different transfer ma-trices created with tighter and looser matching criteria of
R=0.2 and R=0.4. The deviations of the results from the nominal unfolding result are considered as an additional uncertainty on the unfolding procedure.
The statistical uncertainties are propagated through the unfolding by performing pseudo-experiments. An ensem-ble of pseudo-experiments is created in which each bin of the transfer matrix is varied according to its statistical un-certainty from the Monte Carlo samples. A separate set of pseudo-experiments is performed in which the data spec-trum is fluctuated according to the statistical uncertainty tak-ing the correlation between jets produced in the same event into account. The unfolding is then applied to each pseudo-experiment, and the resulting ensembles are used to calcu-late the covariance matrix of the corrected spectrum, from which the uncertainties are obtained.
The unfolding procedure is repeated for the propagation of the uncertainties on the jet energy and angle measure-ments, as described in the next section.
10 Systematic uncertainties
on the cross-section measurement
The following sources of systematic uncertainty are consid-ered in this measurement: the trigger efficiency, jet recon-struction and calibration, the unfolding procedure and the luminosity measurement.
An uncertainty on the trigger efficiency of 1 % is conser-vatively chosen for most of the kinematic region (|y|<2.8;
pT ≥45 GeV in 2.8≤ |y|<3.6; and pT≥30 GeV in
3.6≤ |y|<4.4). A 2 % systematic uncertainty is assigned for jets withpT<45 GeV in the region 2.8≤ |y|<3.6 or withpT<30 GeV in the region 3.6≤ |y|<4.4, as the trig-gers are used forpTclose to the lowestpTpoint with 99 % efficiency for these jets.
The uncertainty on the jet reconstruction efficiency is the same as in the previous measurement at√s=7 TeV [25] and is 2 % forpT<30 GeV and 1 % forpT>30 GeV. It is evaluated using jets reconstructed from tracks [73]. The uncertainty on the jet selection efficiency from the measure-ment at √s=7 TeV is applied in this measurement, but a minimal uncertainty of 0.5 % is retained. The latter ac-counts for the level of agreement of the central value in the comparison between the used jet selection efficiency and the measured jet selection efficiency at√s=2.76 TeV.
The uncertainty due to the jet energy calibration is eval-uated using the same uncertainties on the sources as in the previous measurement at√s=7 TeV [25]. Effects from the systematic uncertainty sources are propagated through the unfolding procedure to provide the uncertainties on the mea-sured cross-sections. The JES uncertainty and its sources are described in detail in Ref. [73], where the total JES uncer-tainty is found to be less than 2.5 % in the central calorime-ter region for jets with 60< pT<800 GeV, and maximally 14 % forpT<30 GeV in the most forward region. The JES
applied to the reconstructed jets in the Monte Carlo simu-lation is varied separately for each JES uncertainty source both up and down by one standard deviation. The resulting
pT spectra are unfolded using the nominal unfolding
ma-trix. The relative shifts with respect to the nominal unfolded spectrum are taken as uncertainties on the cross-section.
cross-Page 10 of 56 Eur. Phys. J. C (2013) 73:2509
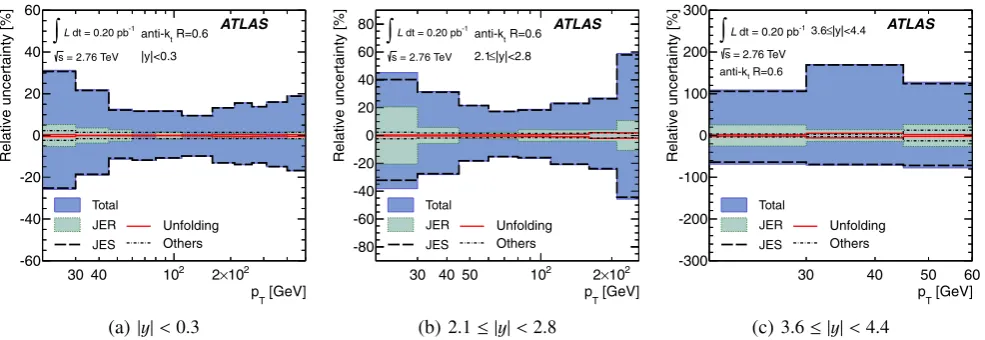
Fig. 5 The systematic uncertainty on the inclusive jet cross-section
measurement for anti-ktjets withR=0.6 in three representative
rapid-ity bins, as a function of the jetpT. In addition to the total uncertainty,
the uncertainties from the jet energy scale (JES), the jet energy
reso-lution (JER), the unfolding procedure and the other systematic sources
are shown separately. The 2.7 % uncertainty from the luminosity
mea-surement and the statistical uncertainty are not shown
sections unfolded with the modified transfer matrix and with the nominal one is taken as the uncertainty in the measure-ment.
The jet angular resolution is estimated in Monte Carlo simulation from the polar angle between the reconstructed jet and its matched jet at particle level. A new transfer matrix with angular resolution degraded by 10 % is used for the data unfolding, and the relative difference from the nominal unfolded result is assigned as the resulting uncertainty.
The uncertainties in the unfolding procedure are descri-bed in Sect. 9. The closure test and the variation of the matching criterion used to construct the transfer matrix are examined. The impact of a possible mis-modelling of the jet
pT spectrum in the Monte Carlo simulation is assessed in
the closure test of the unfolding procedure.
The integrated luminosity is calculated by measuringpp
interaction rates with several ATLAS devices. The absolute calibration is derived from van der Meer scans [77,78]. In total, four scan sessions were performed during the collec-tion of the dataset used in the jet cross-seccollec-tion measure-ments reported here. The uncertainty in the luminosity de-termination arises from three main contributions: bunch-population measurements, beam conditions during the lu-minosity calibration scans, and long-term consistency of the different algorithms used to measure the instantaneous minosity during data collection. The uncertainty on the lu-minosity for the 2.76 TeV dataset is ±2.7 %, dominated by the irreproducibility of beam conditions during the cal-ibration scans. The total systematic uncertainty for the 2010 dataset at√s=7 TeV is±3.4 % [79], dominated by bunch-population measurement uncertainties. Because of signifi-cant improvements to the beam instrumentation implemen-ted between the two running periods, and because the dom-inant systematic uncertainties are of independent origins in
the two datasets, these luminosity uncertainties are treated as uncorrelated.
The evaluated systematic uncertainties on the measured cross-section are added in quadrature and shown in Fig.5
for representative rapidity bins andR=0.6. Results for jets withR=0.4 are similar. The systematic uncertainty on this measurement is driven by the uncertainties on the JES. The very steeply falling jetpTspectrum, especially for large ra-pidity, transforms even relatively modest uncertainties on the transverse momentum into large changes in the mea-sured differential cross-section. The uncertainty on the jet energy resolution also has a sizable effect on the total sys-tematic uncertainty of the measurement in the lowpTbins. Other sources of uncertainty are found to have a smaller im-pact on the results.
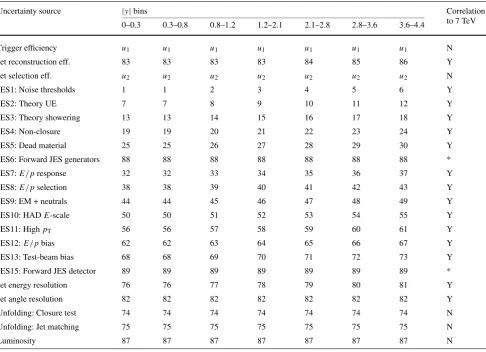
A total of 22 independent sources of systematic uncer-tainty have been considered. The correlations of the system-atic uncertainties acrosspT andy are examined and sum-marised in Table1. In the table, 88 independent nuisance pa-rameters describe the correlations of systematic uncertain-ties over the whole phase space. The systematic effect on the cross-section measurement associated with each nuisance parameter is treated as completely correlated inpT andy.
The table also shows the correlation with respect to the pre-vious√s=7 TeV measurement using 2010 data, which is used in the extraction of the cross-section ratio in Sect.12.
11 Inclusive jet cross-section at√s=2.76 TeV
Eur. Phys. J. C (2013) 73:2509 Page 11 of 56
Table 1 Description of the bin-to-bin uncertainty correlation in the
measurement of the inclusive jet cross-section at√s=2.76 TeV. Each
number corresponds to a nuisance parameter for which the
correspond-ing uncertainty is fully correlated in thepTof the jet. Bins with the
same nuisance parameter are treated as fully correlated, while bins with different nuisance parameters are uncorrelated. Numbers are assigned
to be the same as in the previous publication [25]. The sources labelled
byuiare sources uncorrelated inpTandyof the jet. The correlation
with the previous cross-section measurement at√s=7 TeV [25] is
in-dicated in the last column, where full correlation is inin-dicated by a Y and
no correlation by a N. The description of the JES uncertainty sources
can be found in Refs. [73,74]. JES14 is a source due to the pile-up
cor-rection and is not considered in this measurement. The sources JES6 and JES15 were merged together in the previous measurement and the sum of the two uncertainties added in quadrature is fully correlated with the JES6 in the previous measurement, indicated by the symbol “*” in the table. The nuisance parameter label 31 is skipped in order to be able to keep the same numbers for corresponding nuisance pa-rameters in the two jet cross-section measurements. The values for the
nuisance parameters are given in Tables4–45
Uncertainty source |y|bins Correlation
to 7 TeV
0–0.3 0.3–0.8 0.8–1.2 1.2–2.1 2.1–2.8 2.8–3.6 3.6–4.4
Trigger efficiency u1 u1 u1 u1 u1 u1 u1 N
Jet reconstruction eff. 83 83 83 83 84 85 86 Y
Jet selection eff. u2 u2 u2 u2 u2 u2 u2 N
JES1: Noise thresholds 1 1 2 3 4 5 6 Y
JES2: Theory UE 7 7 8 9 10 11 12 Y
JES3: Theory showering 13 13 14 15 16 17 18 Y
JES4: Non-closure 19 19 20 21 22 23 24 Y
JES5: Dead material 25 25 26 27 28 29 30 Y
JES6: Forward JES generators 88 88 88 88 88 88 88 *
JES7:E/presponse 32 32 33 34 35 36 37 Y
JES8:E/pselection 38 38 39 40 41 42 43 Y
JES9: EM + neutrals 44 44 45 46 47 48 49 Y
JES10: HADE-scale 50 50 51 52 53 54 55 Y
JES11: HighpT 56 56 57 58 59 60 61 Y
JES12:E/pbias 62 62 63 64 65 66 67 Y
JES13: Test-beam bias 68 68 69 70 71 72 73 Y
JES15: Forward JES detector 89 89 89 89 89 89 89 *
Jet energy resolution 76 76 77 78 79 80 81 Y
Jet angle resolution 82 82 82 82 82 82 82 Y
Unfolding: Closure test 74 74 74 74 74 74 74 N
Unfolding: Jet matching 75 75 75 75 75 75 75 N
Luminosity 87 87 87 87 87 87 87 N
in the rapidity region of |y|<4.4, covering seven orders of magnitude in cross-section. The results are compared to NLO pQCD predictions calculated with NLOJET++ using the CT10 PDF set. Corrections for non-perturbative effects are applied.
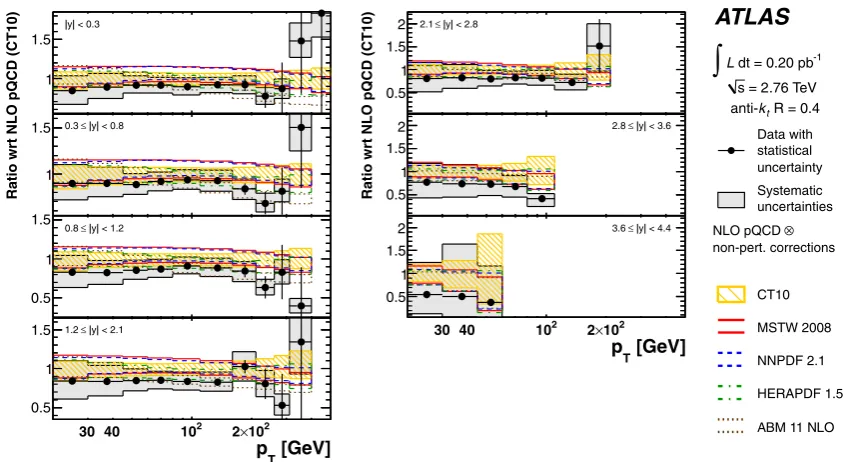
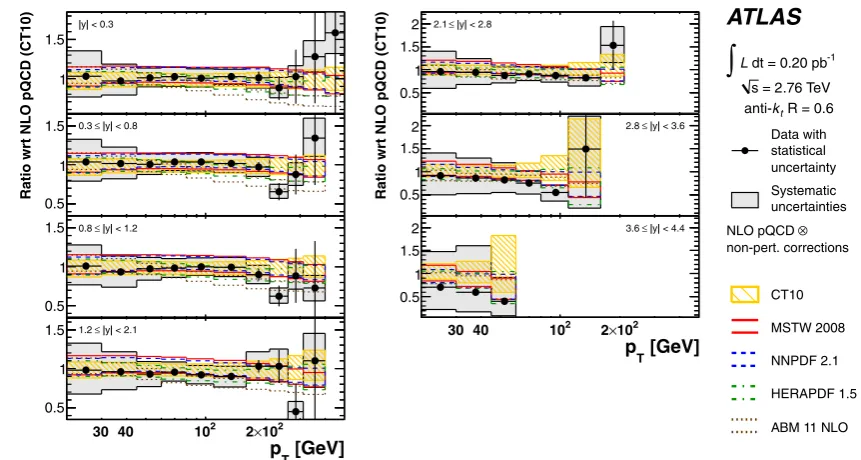
The ratio of the measured cross-sections to the NLO pQCD predictions using the CT10 PDF set is presented in Figs. 8 and9 for jets with R=0.4 andR =0.6, respec-tively. The results are also compared to the predictions ob-tained using the PDF sets MSTW 2008, NNPDF 2.1, HER-APDF 1.5 and ABM 11. The measurement is consistent with all the theory predictions using different PDF sets within their systematic uncertainties for jets with both radius pa-rameters. However, the data for jets with R =0.4 have
a systematically lower cross-section than any of the the-ory predictions, while such a tendency is seen only in the forward rapidity regions in the measurement for jets with
R=0.6.
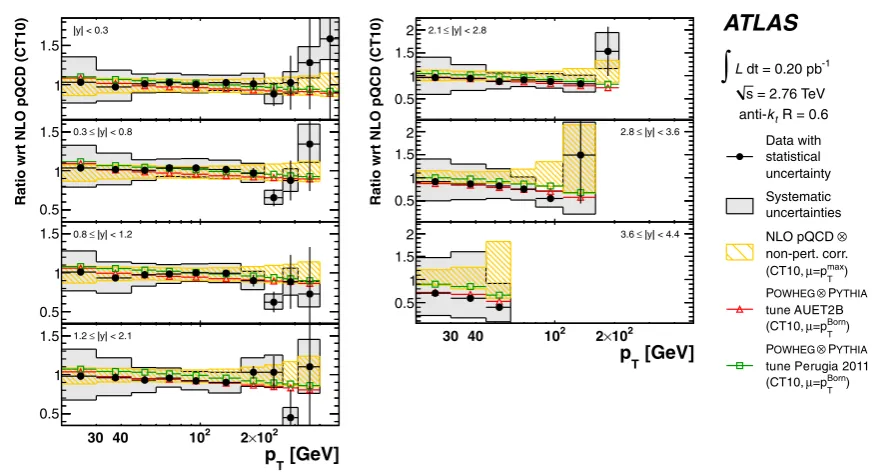
The comparison of the data with the POWHEG predic-tion for anti-kt jets withR=0.4 andR=0.6 is shown in
Figs. 10 and11as a function of the jet pT in bins of ra-pidity. In general, the POWHEG prediction is found to be in good agreement with the data. Especially in the forward region, the shape of the data is very well reproduced by the POWHEGprediction, while small differences are observed in the central region. As seen in the previous measurement at
√
Page 12 of 56 Eur. Phys. J. C (2013) 73:2509
Fig. 6 Inclusive jet double-differential cross-section as a function of
the jetpT in bins of rapidity, for anti-kt jets withR=0.4. For
[image:13.595.313.540.68.273.2]pre-sentation, the cross-section is multiplied by the factors indicated in the legend. The shaded area indicates the experimental systematic uncer-tainties. The data are compared to NLO pQCD predictions calculated using NLOJET++ with the CT10 PDF set, to which non-perturbative corrections have been applied. The hashed area indicates the predic-tions with their uncertainties. The 2.7 % uncertainty from the luminos-ity measurements is not shown
Fig. 7 Inclusive jet double-differential cross-section as a function of
the jetpTin bins of rapidity, for anti-kt jets withR=0.6. For
pre-sentation, the cross-section is multiplied by the factors indicated in the legend. The shaded area indicates the experimental systematic uncer-tainties. The data are compared to NLO pQCD predictions calculated using NLOJET++ with the CT10 PDF set, to which non-perturbative corrections have been applied. The hashed area indicates the predic-tions with their uncertainties. The 2.7 % uncertainty from the luminos-ity measurements is not shown
Fig. 8 Ratio of the measured inclusive jet double-differential
cross-section to the NLO pQCD prediction calculated with NLOJET++ with the CT10 PDF set corrected for non-perturbative effects. The ratio is
shown as a function of the jetpTin bins of jet rapidity, for anti-ktjets
withR=0.4. The figure also shows NLO pQCD predictions obtained
with different PDF sets, namely ABM 11, NNPDF 2.1, HERAPDF 1.5
and MSTW2008. Statistically insignificant data points at largepTare
[image:13.595.85.507.423.654.2]Eur. Phys. J. C (2013) 73:2509 Page 13 of 56
Fig. 9 Ratio of the measured inclusive jet double-differential
cross-section to the NLO pQCD prediction calculated with NLOJET++ with the CT10 PDF set corrected for non-perturbative effects. The ratio is
shown as a function of the jetpTin bins of jet rapidity, for anti-ktjets
withR=0.6. The figure also shows NLO pQCD predictions obtained
with different PDF sets, namely ABM 11, NNPDF 2.1, HERAPDF 1.5
and MSTW2008. Statistically insignificant data points at largepTare
omitted. The 2.7 % uncertainty from the luminosity measurements is not shown
Fig. 10 Ratio of the measured inclusive jet double-differential
cross-section to the NLO pQCD prediction calculated with NLOJET++ with the CT10 PDF set corrected for non-perturbative effects. The ratio is
shown as a function of the jetpTin bins of jet rapidity, for anti-ktjets
withR=0.4. The figure also shows predictions from POWHEGusing
PYTHIAfor the simulation of the parton shower and hadronisation with the AUET2B tune and the Perugia 2011 tune. Only the statistical
uncer-tainty is shown on the POWHEGpredictions. Statistically insignificant
data points at largepTare omitted. The 2.7 % uncertainty from the
luminosity measurements is not shown
which is generally in closer agreement with data. In contrast to the NLO pQCD prediction with corrections for non-per-turbative effects, the POWHEGprediction agrees well with
[image:14.595.98.509.359.581.2]Page 14 of 56 Eur. Phys. J. C (2013) 73:2509
Fig. 11 Ratio of the measured inclusive jet double-differential
cross-section to the NLO pQCD prediction calculated with NLOJET++ with the CT10 PDF set corrected for non-perturbative effects. The ratio is
shown as a function of the jetpTin bins of jet rapidity, for anti-ktjets
withR=0.6. The figure also shows predictions from POWHEGusing
PYTHIAfor the simulation of the parton shower and hadronisation with the AUET2B tune and the Perugia 2011 tune. Only the statistical
uncer-tainty is shown on the POWHEGpredictions. Statistically insignificant
data points at largepTare omitted. The 2.7 % uncertainty from the
luminosity measurements is not shown
12 Cross-section ratio of√s=2.76 TeV to√s=7 TeV
12.1 Experimental systematic uncertainty
As indicated in Table1, the systematic uncertainties on the measurement due to jet reconstruction and calibration are considered as fully correlated between the measurements at √s=2.76 TeV and √s=7 TeV. For each correlated systematic sourcesi, the relative uncertaintyρsi/ρon the cross-section ratio is calculated as
ρsi
ρ =
1+δs2.76 TeV
i 1+δ7 TeV
si
−1, (8)
whereδ2.76 TeVs
i andδ
7 TeV
si are relative uncertainties caused by a sourcesi in the cross-section measurements at
√ s=
2.76 TeV and √s=7 TeV, respectively. Systematic un-certainties that are uncorrelated between the two centre-of-mass energies are added in quadrature. The uncertainties on the trigger efficiency and the jet selection efficiency, and the ones from the unfolding procedure are conservatively con-sidered as uncorrelated between the two measurements at the different energies. The measurement at√s=7 TeV has an additional uncertainty due to pile-up effects in the jet en-ergy calibration. It is added to the uncertainty in the cross-section ratio. The uncertainties in the luminosity measure-ments are also treated as uncorrelated (see Sect.10), result-ing in a luminosity uncertainty of 4.3 %. The uncertainty
on the momentum of the proton beam, based on the LHC magnetic model, is at the level of 0.1 % [80] and highly cor-related between different centre-of-mass energies; hence, it is negligible for the ratio.
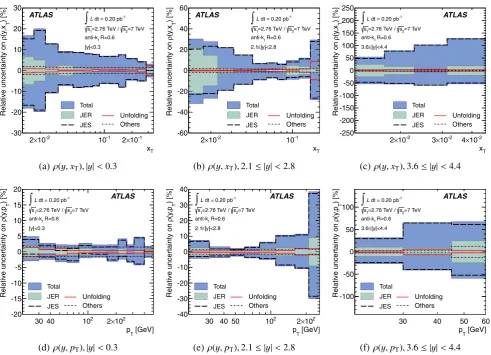
The experimental systematic uncertainties on both
ρ(y, xT) andρ(y, pT) are shown in Fig. 12for represen-tative rapidity bins for jets withR=0.6. Forρ(y, xT)the uncertainties are 5 %–20 % for the central jets and+−160 %60 % for the forward jets. For jets withR=0.4, uncertainties are sim-ilar, except for central jets with lowpTwhere the uncertainty is within±15 %. A significant reduction of the uncertainty is obtained forρ(y, pT), being well below 5 % in the central
region. In the forward region, the uncertainty is±70 % for jets withR=0.6, and+−100 %70 % for jets withR=0.4.
12.2 Results
Figures13and14show the extracted cross-section ratio of the inclusive jet cross-section measured at√s=2.76 TeV to the one measured at√s=7 TeV, as a function of xT,
for jets withR=0.4 andR=0.6, respectively. The mea-sured cross-section ratio is found to be 1.1< ρ(y, xT) <1.5 for both radius parameters. This approximately constant be-haviour reflects both the asymptotic freedom of QCD and evolution of the gluon distribution in the proton as a func-tion of the QCD scale. The measurement shows a slightly differentxTdependence for jets withR=0.4 andR=0.6,
Eur. Phys. J. C (2013) 73:2509 Page 15 of 56
Fig. 12 The systematic uncertainty on the cross-section ratios, ρ(y, xT)andρ(y, pT), for anti-kt jets withR=0.6 in three
repre-sentative rapidity bins, as a function of the jetxTand of the jetpT,
respectively. In addition to the total uncertainty, the uncertainties from
the jet energy scale (JES), the jet energy resolution (JER), the unfold-ing procedure and other systematic sources are shown separately. The 4.3 % uncertainty from the luminosity measurements and the statistical uncertainty are not shown
non-perturbative corrections for the two radius parameters, already seen in Figs.4(a) and4(b). The measurement is then compared to the NLO pQCD prediction, to which correc-tions for non-perturbative effects are applied, obtained using the CT10 PDF set. It is in good agreement with the predic-tion.
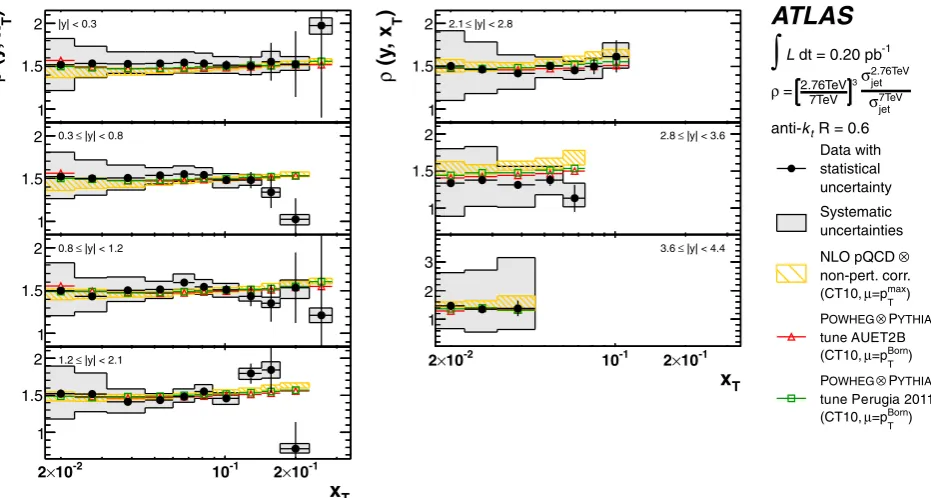
Figures15and16show the same cross-section ratio com-pared to predictions from POWHEGwith the CT10 PDF set. The tunes AUET2B and Perugia 2011 give very similar dictions in general, and also agree well with the pQCD pre-diction with non-perturbative corrections applied.
Figures17and18show the cross-section ratio as a func-tion of the jetpT, plotted as the double ratio with respect to
the NLO pQCD prediction using the CT10 PDF set with non-perturbative corrections applied, for anti-kt jets with R=0.4 andR=0.6.5
5As written in Sect.9, the measurement at√s=2.76 TeV uses a
qual-ity selection for jets with lowpTin Monte Carlo simulation at|η| ∼1,
The systematic uncertainty on the measurement is sig-nificantly reduced and is generally smaller than the the-ory uncertainties. The measurement is also compared to the predictions using different PDF sets, namely MSTW2008, NNPDF 2.1, HERAPDF 1.5 and ABM 11. In general, the measured points are slightly higher than the predictions in the central rapidity regions and are lower in the forward rapidity regions. The deviation is more pronounced for the prediction using the ABM 11 PDF set in the barrel region,
which is a different treatment than was done for the published
mea-surement at√s=7 TeV [25]. The ratio is extracted using the
co-herent treatment in the two measurements at the different beam
en-ergies, shifting the measured cross-section at√s=7 TeV from the
published result within its uncertainty. The shifts are sizable in the
bin 0.8≤ |y|<1.2 only. For jets withR=0.4 (R=0.6), they are
13 % (10 %) in the 20≤pT<30 GeV bin, and 1.5 % (2.6 %) in the
30≤pT<45 GeV bin. In the rapidity range 1.2≤ |y|<2.1, the shift
is 1.8 % (1.9 %) at 20≤pT<30 GeV. These bins in the√s=7 TeV
measurement only enter in the extraction ofρ(y, pT)and not in that of
Page 16 of 56 Eur. Phys. J. C (2013) 73:2509
Fig. 13 Ratio of the inclusive jet cross-section at√s=2.76 TeV to
the one at√s=7 TeV as a function ofxTin bins of jet rapidity, for
anti-kt jets withR=0.4. The theoretical prediction is calculated at
next-to-leading order with the CT10 PDF set and corrected for
non-perturbative effects. Statistically insignificant data points at largexT
are omitted. The 4.3 % uncertainty from the luminosity measurements is not shown
Fig. 14 Ratio of the inclusive jet cross-section at√s=2.76 TeV to
the one at√s=7 TeV as a function ofxTin bins of jet rapidity, for
anti-kt jets withR=0.6. The theoretical prediction is calculated at
next-to-leading order with the CT10 PDF set and corrected for
non-perturbative effects. Statistically insignificant data points at largexT
Eur. Phys. J. C (2013) 73:2509 Page 17 of 56
Fig. 15 Ratio of the measured inclusive jet double-differential
cross-section at√s=2.76 TeV to the one at√s=7 TeV as a function of the
jetxTin bins of jet rapidity, for anti-ktjet withR=0.4. The
theoreti-cal prediction from NLOJET++ is theoreti-calculated using the CT10 PDF set with corrections for non-perturbative effects applied. Also shown are
POWHEGpredictions using PYTHIAfor the simulation of the parton shower and hadronisation with the AUET2B tune and the Perugia 2011
tune. Only the statistical uncertainty is shown on the POWHEG
predic-tions. Statistically insignificant data points at largexTare omitted. The
[image:18.595.68.534.404.653.2]4.3 % uncertainty from the luminosity measurements is not shown
Fig. 16 Ratio of the measured inclusive jet double-differential
cross-section at√s=2.76 TeV to the one at√s=7 TeV as a function of the
jetxTin bins of jet rapidity, for anti-ktjet withR=0.6. The
theoreti-cal prediction from NLOJET++ is theoreti-calculated using the CT10 PDF set with corrections for non-perturbative effects applied. Also shown are
POWHEGpredictions using PYTHIAfor the simulation of the parton shower and hadronisation with the AUET2B tune and the Perugia 2011
tune. Only the statistical uncertainty is shown on the POWHEG
predic-tions. Statistically insignificant data points at largexTare omitted. The
Page 18 of 56 Eur. Phys. J. C (2013) 73:2509
Fig. 17 Ratio of the inclusive jet cross-section at√s=2.76 TeV to
the one at√s=7 TeV, shown as a double ratio to the theoretical
pre-diction calculated with the CT10 PDFs as a function of the jetpTin
bins of jet rapidity, for anti-ktjets withR=0.4. Statistically
insignif-icant data points at largepTare omitted. The 4.3 % uncertainty from
the luminosity measurements is not shown
Fig. 18 Ratio of the inclusive jet cross-section at√s=2.76 TeV to
the one at√s=7 TeV, shown as a double ratio to the theoretical
pre-diction calculated with the CT10 PDFs as a function of the jetpTin
bins of jet rapidity, for anti-ktjets withR=0.6. Statistically
insignif-icant data points at largepTare omitted. The 4.3 % uncertainty from
[image:19.595.72.532.51.304.2] [image:19.595.70.530.421.674.2]Eur. Phys. J. C (2013) 73:2509 Page 19 of 56
which yields a different shape with respect to the other PDF sets.
The very small systematic uncertainty in the ρ(y, pT)
measurement suggests that the measured jet cross-section at
√
s=2.76 TeV may contribute to constrain the PDF uncer-tainties in a global PDF fit in the pQCD framework by cor-rectly taking the correlation of systematic uncertainties to the previous√s=7 TeV measurement into account. Such an NLO pQCD analysis is described in Sect.13.
A comparison of the jet cross-section ratio as a function ofpTto the POWHEGprediction is made in Figs.19and20. Differences between the tunes used in PYTHIAfor the par-ton shower are very small, and deviations are seen only in the forward region for largepT. Like the NLO pQCD pre-diction with non-perturbative corrections, the POWHEG pre-diction has a different trend in the central rapidity region with respect to data, deviating by more than 10 %. However, it follows the data very well in the forward region.
13 NLO pQCD analysis of HERA and ATLAS jet data
Knowledge of the PDFs of the proton comes mainly from deep-inelastic lepton–proton scattering experiments cover-ing a broad range of momentum-transfer squaredQ2and of Bjorkenx. The PDFs are determined from data using pQCD in the DGLAP formalism [81–85]. The quark distributions in the region x 0.01 are in general well constrained by the precise measurement of the proton structure function
F2(x, Q2)at HERA [86]. However, the gluon momentum distributionxg(x, Q2)atx values above 0.01 has not been as precisely determined in deep-inelastic scattering. The in-clusive jetpTspectrum at low and moderatepTis sensitive
to the gluon distribution function.
The systematic uncertainty on the jet cross-section at
√
s=2.76 TeV is strongly correlated with the ATLAS jet cross-section measured at √s =7 TeV, as described in Sect. 8. Therefore, increased sensitivity to the PDFs is ex-pected when these two jet cross-section datasets are ana-lysed together, with proper treatment of correlation between the measurements.
A combined NLO pQCD analysis of the inclusive jet cross-section in ppcollisions at √s=2.76 TeV together with the ATLAS inclusive jet cross-section inppcollisions at √s=7 TeV [25] and HERA I data [86] is presented here. The analysis is performed using the HERAFitter pack-age [86–88], which uses the light-quark coefficient func-tions calculated to NLO as implemented in QCDNUM [89] and the heavy-quark coefficient functions from the variable-flavour number scheme (VFNS) [90,91] for the PDF evolu-tion, as well as MINUIT [92] for minimisation ofχ2. The data are compared to the theory using the χ2function de-fined in Refs. [93–95]. The heavy quark masses are cho-sen to be mc =1.4 GeV and mb=4.75 GeV [53]. The
strong coupling constant is fixed toαS(MZ)=0.1176, as
in Ref. [86]. A minimum Q2 cut of Q2min=3.5 GeV2 is imposed on the HERA data to avoid the non-perturbative re-gion. The prediction for the ATLAS jet data is obtained from the NLO pQCD calculation to which the non-perturbative correction is applied as described in Sect. 6. Due to the large values of the non-perturbative corrections and their large uncertainties at low pT of the jet, all the bins with
pT<45 GeV are excluded from the analysis.
The DGLAP evolution equations yield the PDFs at any value ofQ2, given that they are parameterised as functions ofx at an initial scaleQ20. In the present analysis, this scale is chosen to beQ20=1.9 GeV2 such that it is below m2c. PDFs are parameterised at the evolution starting scaleQ20
using a HERAPDF-inspired ansatz as in Ref. [96]:
xuv(x)=Auvx
Buv(
1−x)Cuv1+E
uvx
2,
xdv(x)=Advx
Bdv(
1−x)Cdv,
xU (x)¯ =AU¯xBU¯(1−x)CU¯,
xD(x)¯ =AD¯xBD¯(1−x)CD¯,
xg(x)=AgxBg(1−x)Cg−Agx Bg(
1−x)Cg.
(9)
HereU¯ = ¯uwhereasD¯ = ¯d+ ¯s. The parametersAuv and
Adv are fixed using the quark counting rule and Ag us-ing the momentum sum rule. The normalisation and slope parameters, A and B, of u¯ andd¯ are set equal such that
xu¯=xd¯atx→0. An extra term for the valence distribution (Euv) is observed to improve the fit quality significantly. The strange-quark distribution is constrained to a certain frac-tion ofD¯ asxs¯=fsxD¯, wherefs=0.31 is chosen in this
analysis. The gluon distribution uses the so-called flexible form, suggested by MSTW analyses, with Cg =25 [53]. This value of theCg parameter ensures that the additional term contributes at lowxonly. With all these additional con-straints applied, the fit has 13 free parameters to describe the parton densities.
Page 20 of 56 Eur. Phys. J. C (2013) 73:2509
Fig. 19 Ratio of the inclusive jet cross-section at√s=2.76 TeV to
the one at √s=7 TeV, shown as a double ratio to the theoretical
prediction calculated with the CT10 PDFs as a function ofpTin bins
of jet rapidity, for anti-ktjets withR=0.4. Also shown are POWHEG
predictions using PYTHIAfor the simulation of the parton shower and
hadronisation with the AUET2B tune and the Perugia 2011 tune. Only
the statistical uncertainty is shown on the POWHEGpredictions.
Sta-tistically insignificant data points at largepTare omitted. The 4.3 %
uncertainty from the luminosity measurements is not shown
Fig. 20 Ratio of the inclusive jet cross-section at√s=2.76 TeV to
the one at√s=7 TeV, shown as a double ratio to the theoretical
pre-diction calculated with the CT10 PDFs as a function ofpTin bins of
jet rapidity, for anti-kt jets withR=0.6. Also shown are POWHEG
predictions using PYTHIAfor the simulation of the parton shower and
hadronisation with the AUET2B tune and the Perugia 2011 tune. Only
the statistical uncertainty is shown on the POWHEGpredictions.
Sta-tistically insignificant data points at largepTare omitted. The 4.3 %
[image:21.595.78.534.50.301.2] [image:21.595.73.535.400.651.2]