Warthin Tumor of the Parotid Gland:
Diagnostic Value of MR Imaging with
Histopathologic Correlation
Mitsuaki Ikeda, Ken Motoori, Toyoyuki Hanazawa, Yuichiro Nagai, Seiji Yamamoto, Takuya Ueda, Hiroyuki Funatsu, and Hisao Ito
BACKGROUND AND PURPOSE:The purpose of our study was to describe the MR imaging appearance of Warthin tumors multiple MR imaging techniques and to interpret the difference in appearance from that of malignant parotid tumors.
METHODS: T1-weighted, T2-weighted, short inversion time inversion recovery, diffusion-weighted, and contrast-enhanced dynamic MR images of 19 Warthin tumors and 17 malignant parotid tumors were reviewed. MR imaging results were compared with those of pathologic analysis.
RESULTS: Epithelial stromata and lymphoid tissue with slitlike small cysts in Warthin tumors showed early enhancement and a high washout rate (>30%) on dynamic contrast-enhanced images, and accumulations of complicated cysts showed early enhancement and a low washout ratio (<30%). The areas containing complicated cysts showed high signal intensity on T1-weighted images, whereas some foci in those areas showed low signal intensity on short tau inversion recovery images. The mean minimum signal intensity ratios (SIRmin) of Warthin
tumor on short tau inversion recovery (0.29 ⴞ 0.22 SD) (P < .01) and T2-weighted images (0.28ⴞ0.09) (P< .05) were significantly lower than those of malignant parotid tumors (0.53ⴞ 0.19, 0.48ⴞ 0.19). The average washout ratio of Warthin tumors (44.0 ⴞ 20.4%) was higher than that of malignant parotid tumors (11.9ⴞ11.6%). The mean apparent diffusion coefficient of Warthin tumors (0.96ⴞ 0.13ⴛ 10ⴚ3mm2/s) was significantly lower (P< .01) than that of
malignant tumors (1.19ⴞ 0.19ⴛ10ⴚ3mm2/s).
CONCLUSION:Detecting hypointense areas of short tau inversion recovery and T2-weighted images or low apparent diffusion coefficient values on diffusion-weighted images was useful for predicting whether salivary gland tumors were Warthin tumors. The findings of the dynamic contrast-enhanced study also were useful.
Imaging of the salivary glands has two purposes: first, to establish the precise extent and site of a salivary lesion, and second, to provide some indication of its pathologic nature. It is of major importance to deter-mine whether a salivary gland tumor is benign or malignant and to assess its extent and relationship to adjacent structures preoperatively, because this infor-mation will strongly influence the choice of surgical procedure. Local excision or superficial parotidec-tomy is performed for benign tumors, whereas total
parotidectomy, with or without facial nerve removal, is performed for malignant tumors (1, 2). The patho-logic diagnosis is typically determined by fine needle aspiration cytology. Although fine needle aspiration cytology is the most cost-effective and minimally in-vasive way to determine the histologic character of a parotid tumor, fine needle aspiration cytology is not always conclusive because specimen material from a small or deep mass may be insufficient (3–5). Thus, although there seems to be an important role for pre-operative imaging, in reality its clinical significance is relatively little.
General agreement exists that the use of standard MR imaging sequences usually will not allow differ-entiation between parotid tumors (6–11). A few arti-cles have reported the usefulness of dynamic contrast-enhanced and diffusion-weighted images for predicting whether salivary gland tumors are benign or malig-nant (12). This is complicated in that Warthin tumor, Received October 2, 2003; accepted after revision December 22.
From the Departments of Radiology (M.I., K.M., S.Y., T.U., H.F., H.I.) and Otolaryngology (T.H.), Chiba University Hospital, and the Department of Molecular Pathology (Y.N.), Chiba Post-graduate School of Medicine, Chiba, Japan.
Address reprint requests to Ken Motoori, MD, Department of Radiology, Chiba University Hospital, 1-8-1, Inohana, Chuo-ku, Chiba City, Chiba, Japan, 260-8677.
©American Society of Neuroradiology
a benign parotid gland tumor, is reported to mimic malignant neoplasm (13). MR imaging is an estab-lished and useful way of showing the morphology and extent of head and neck tumors and their relationship to adjacent structures. If, however, MR imaging could make a reliable distinction between benign and ma-lignant neoplasms, its role and importance in diag-nostics would become considerably more valuable. The purpose of this study, then, was to more precisely reveal the MR imaging features of Warthin tumor, which is described as a mimicker of malignant neo-plasm, by using multiple MR images—T1-weighted, T2-weighted, short inversion time inversion recovery (STIR), diffusion-weighted, and dynamic contrast-en-hanced MR images—to help ensure a correct diag-nosis and differentiate the tumor from parotid malignancies.
Methods
Patients
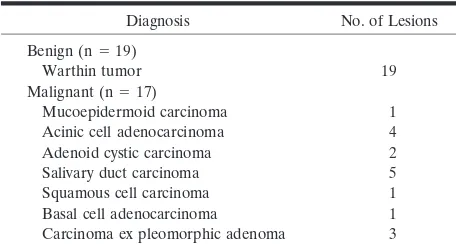
Between November 2001 and January 2003, MR imaging studies of clinically suspected parotid tumors were performed before surgery or fine needle aspiration cytology. From this period, we reviewed the MR images of all pathologically proved Warthin tumors (19 tumors in 17 patients; 16 men and one woman; mean age, 65 years; age range, 46–85 years). Of the 17 patients with 19 tumors, nine with 11 lesions had under-gone surgery, and eight with eight lesions had underunder-gone nee-dle biopsy. We also reviewed the MR imaging studies of all pathologically proved malignant parotid tumors (17 tumors in 17 patients; seven men and 10 women; mean age, 54 years; age range, 20–89 years). The distributions of Warthin tumors and malignant tumors are shown in Table 1.
MR Imaging Techniques
All MR imaging examinations were performed by using a 1.5-T MR imaging unit (GE Medical Systems, Milwaukee, WI) with a neurovascular array coil. T1-weighted images (400–500/ 9–14 [TR/TE]) of the transverse plane, STIR images (4000/30; echo train length, 12; inversion time, 150 ms) of the same transverse plane as the T1-weighted images, diffusion-weighted images (spin-echo single shot echo-planar sequence with b factors of 0 and 1000 s/mm2) of the same transverse plane, and T2-weighted spin-echo images (4000/104; echo train length, 16) of the same transverse or coronal plane were obtained at a section thickness of 6 mm, an intersection gap of 1 mm, an acquisition matrix of 256⫻256 (128⫻128 on the diffusion-weighted images), and a field of view of 22⫻22 cm.
Dynamic contrast-enhanced MR images were obtained by 3D fat suppression T1-weighted multiphase spoiled gradient recalled imaging (6.3/1.4) for 4 minutes, with each phase lasting 27 seconds and then a 3-second interval, an effective section thickness of 4 mm, a field of view of 22 ⫻22 cm, and an acquisition matrix of 256⫻ 224. After the first set was ob-tained, contrast material injection was started immediately. Gadodiamide hydrate (Omniscan; Daiichi Pharmaceutical Corporation, Tokyo, Japan) was administered (0.2 mL/kg body weight) at a rate of 2.0 mL/s and then a 20-mL saline flush was delivered into the antecubital vein. Seven sets of dynamic contrast-enhanced images were obtained serially at 3, 33, 63, 93, 123, 153, and 183 seconds. Soon after the dynamic contrast-enhanced MR imaging, fat suppression T1-weighted images (340–400/20) of the same transverse plane as that of the un-enhanced T1-weighted images or the coronal plane were ob-tained with an acquisition matrix of 256 ⫻ 224. Apparent diffusion coefficient (ADC) maps were automatically con-structed from diffusion-weighted images. T1-weighted, dy-namic contrast-enhanced, diffusion-weighted, and fat suppres-sion contrast-enhanced T1-weighted images were obtained from all 19 Warthin tumors and 17 malignant tumors. Short tau inversion recovery images were obtained of all cases of Warthin tumors and 16 of 17 cases of malignant tumors; T2-weighted images were obtained from nine of 19 and 10 of 17 cases. This extensive routine MR imaging study can be performed in ap-proximately 15 minutes.
Image and Pathologic Analyses
Two experienced radiologists (K.M., T.U.) evaluated the T1-weighted, STIR, and T2-weighted images to determine size, location (superficial lobe or deep lobe), nature of margin (def-inition and lobulation), and signal intensity of the tumors. In the evaluation of T1-weighted, T2-weighted, and STIR, the maximum (SImax), minimum (SImin), and CSF (SIcsf) signal intensities of the tumors were obtained. SIR was calculated as follows:
SIRmax⫽SImax/SIcsf, SIRmin⫽SImin/SIcsf.
One radiologist (K.M.) measured the signal intensities of the lesions on each dynamic image with an electronic cursor to define the region of interest in each patient. Where markedly heterogeneous enhancement was seen, multiple regions of in-terest were obtained. Time–signal intensity curves were then plotted from signal intensity values obtained for the tumors, the ipsilateral artery, and the ipsilateral vein. Time–signal in-tensity curves were divided into five types according to those presented by Takashima et al (14): type A, curve peaks 3 to 30 seconds after administration of contrast material; type B, curve peaks at 33 to 60 seconds; type C, curve peaks at 63 to 180 seconds; type D, gradual upward slope; and type E, unen-hanced. Type C was divided into four subtypes: C1, curve peaks at 63 to 90 seconds; C2, curve peaks at 93 to 120 seconds; C3, curve peaks at 123 to 150 seconds; and C4, curve peaks at 153 to 180 seconds. Washout ratio was calculated by a modified method of that presented by Yabuuchi et al (12) as follows:
[(SImax⫺SI3.5min)/(SImax⫺SIpre)]⫻100(%),
where SImax was the signal intensity at maximal contrast en-hancement, SI3.5 minthe signal intensity at 3.5 minutes after contrast material administration, and SIpre the unenhanced (“precontrast”) signal intensity.
[image:2.603.54.282.70.192.2]The ADC values of the lesions were measured on each diffusion-weighted image with an electronic cursor to define the region of interest. In measuring the signal intensities, we avoided obvious cystic portions. The ADC values of the spinal cord on diffusion-weighted images also were measured to as-sess the validity of our method and to compare our findings with the results from those of previous investigations. The tumors were marked at the top during surgery. For MR images,
TABLE 1: Histopathology diagnoses of salivary gland tumors
Diagnosis No. of Lesions Benign (n⫽19)
Warthin tumor 19
Malignant (n⫽17)
they were cut on an axial plane. An experienced radiologist (K.M.) and a pathologist (Y.N.) correlated the MR images and pathologic specimens.
Results
Size, Location, and Shape of Tumors
Seventeen patients presented with 19 Warthin tu-mors of the parotid gland. Two cases had bilateral tumors. The average maximal cross-sectional diame-ter was 2.4 cm (range, 0.8–5.0 cm). Eighteen Warthin tumors were located in the caudal portion of the parotid gland. All tumors showed well-defined mar-gins on T1-weighted and T2-weighted images. Six tumors revealed unclear margins on STIR images, because their signal intensities were as low as those of the parotid glands. Fourteen Warthin tumors showed well-defined margins on fat suppression T1-weighted images, with the other five showing unclear margins, because they were enhanced as much as the paren-chyma of the parotid glands did. The average maxi-mal cross-sectional diameter of the 17 maxi-malignant pa-rotid tumors was 3.3 cm (range, 1.0–4.7 cm). Six malignant tumors showed well-defined margins, and the other 11 showed partially unclear or invasive mar-gins on all MR images.
Signal Intensities of Tumors
All Warthin tumors had low signal intensity for the salivary gland and isointensity compared with muscle on T1-weighted images. Although small high-signal-intensity spots or areas could be detected in 12 or 19 Warthin tumors, no significant difference was ob-served between Warthin tumors and malignant pa-rotid tumors in SIRmax and SIRmin on T1-weighted
images. On T2-weighted and STIR images, many Warthin tumors had low-signal-intensity foci. The mean SIRmin of Warthin tumors on STIR images
(0.29 ⫾ 0.22 SD) was significantly lower (P ⬍ .01) than that of malignant parotid tumors (0.53⫾0.19). The mean SIRminof Warthin tumors on T2-weighted
images (0.28⫾0.09) was also significantly lower (P⬍
.05) than that of malignant parotid tumors (0.48 ⫾
0.19). No significant differences in SIRmaxwere seen
on STIR and T2-weighted images between Warthin tumors and malignant parotid tumors.
Time–Contrast Enhancement Ratio and Washout Ratio of Tumors
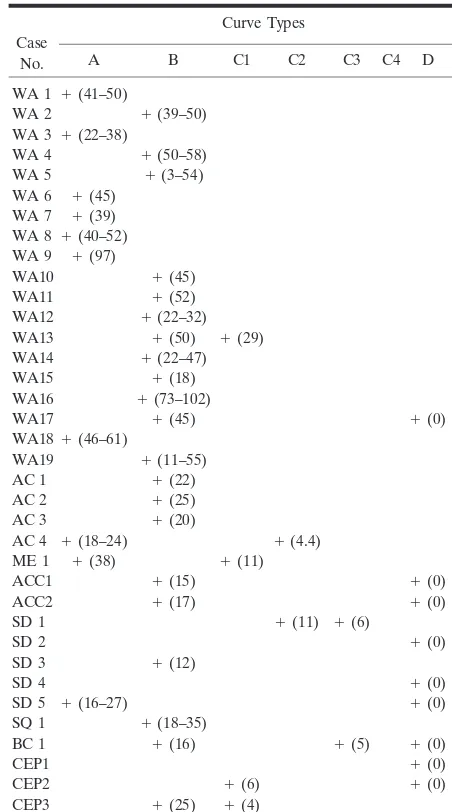
The artery curve peaked at 3 to 30 seconds after the administration of contrast agent (type A). Strongest enhancement of the vein was at 33 to 60 seconds (type B). Seven (36.8%) of the 19 Warthin tumors had type A curves, and the other 12 (63.2%) had type B curves. One Warthin tumor with a type A curve also had a type E curve. Six Warthin tumors with type B curves had one or two additional types of curves: type C1 in one case, both types D and E in one case, and type E in four cases. The average washout ratio of all 19 Warthin tumors was 44.0% ⫾ 20.4, that of the
seven type A tumors was 47.4%⫾17.8, and that of the 12 type B tumors was 42.3%⫾ 22.1. One type A and six type B tumors had areas showing a wash-out ratio lower than 30%. Of the malignant parotid tumors, eight showed type D curves. The average value of the washout ratio of all 17 malignant pa-rotid tumors was 11.9% ⫾ 11.6. The time–signal intensity curves and washout ratios of the tumors are summarized in Table 2.
ADC Values of Tumors
[image:3.603.306.532.79.485.2]All diffusion-weighted images of 19 Warthin tu-mors and 17 malignant tutu-mors showed irregularly high signal intensities. The ADC values of both tu-mors and of spinal cord were measured. The average of the ADC values of the 19 Warthin tumors (0.96⫾ TABLE 2: Time intensity curves of tumors as shown by dynamic MR imaging
Case No.
Curve Types
A B C1 C2 C3 C4 D E
WA 1 ⫹(41–50) ⫹
WA 2 ⫹(39–50) ⫹
WA 3 ⫹(22–38)
WA 4 ⫹(50–58) ⫹
WA 5 ⫹(3–54) WA 6 ⫹(45)
WA 7 ⫹(39) WA 8 ⫹(40–52) WA 9 ⫹(97)
WA10 ⫹(45)
WA11 ⫹(52)
WA12 ⫹(22–32) WA13 ⫹(50) ⫹(29)
WA14 ⫹(22–47) ⫹
WA15 ⫹(18) ⫹
WA16 ⫹(73–102)
WA17 ⫹(45) ⫹(0) ⫹
WA18⫹(46–61)
WA19 ⫹(11–55)
AC 1 ⫹(22)
AC 2 ⫹(25)
AC 3 ⫹(20) ⫹
AC 4 ⫹(18–24) ⫹(4.4) ME 1 ⫹(38) ⫹(11)
ACC1 ⫹(15) ⫹(0)
ACC2 ⫹(17) ⫹(0) ⫹
SD 1 ⫹(11) ⫹(6) ⫹
SD 2 ⫹(0)
SD 3 ⫹(12) ⫹
SD 4 ⫹(0)
SD 5 ⫹(16–27) ⫹(0)
SQ 1 ⫹(18–35)
BC 1 ⫹(16) ⫹(5) ⫹(0)
CEP1 ⫹(0)
CEP2 ⫹(6) ⫹(0) ⫹
CEP3 ⫹(25) ⫹(4) ⫹
0.13, 0.72 to 1.17 ⫻ 10⫺3 mm2/s) was significantly
lower (P⬍.01) than that of the 17 malignant tumors (1.19⫾0.19, 0.79 to 1.65⫻10⫺3mm2/s). The average
of the ADC values of the Warthin tumors was also lower than that of the spinal cord (1.02⫾0.05, 0.93 to 1.16⫻ 10⫺3mm2/s), but not significantly.
Correlations between Radiologic and Pathologic Findings
All dissected Warthin tumors had fibrous capsules at the maximal diameter section. The fibrous cap-sules, sometimes shown on MR images, varied in thickness, and the tumors were separated from nor-mal major glands. The high-signal-intensity foci on unenhanced STIR and T2-weighted images corre-sponded to cysts (Fig 1). These macroscopic cysts usually were sizable, and they lost their contents when the tumors were subjected to specimen preparation. They showed high ADC values (1.63⫾ 0.50⫻ 10⫺3
mm2/s) on diffusion-weighted images. Microscopic
cysts in the macroscopic solid components of Warthin tumors varied from small slitlike spaces to those sev-eral centimeters in length and occupied a consider-able portion of the entire lesion. The microscopic slitlike cysts, mostly not detectable as high-signal-intensity foci on STIR and T2-weighted images, showed characteristic low ADC values on diffusion-weighted images. They were filled with proteinous secretion (Fig 1). High-signal-intensity areas on T1-weighted images corresponded to areas with accumu-lations of microscopic cysts containing proteinous fluid with foamy cells, red cells, and neutrophils (Fig 2). Sometimes, the macroscopic solid area with these microscopic complicated cysts showed characteristic low signal intensities on STIR images. The typical components of Warthin tumor (slitlike cysts, or arbo-rescent spaces lined by a papillary proliferation of bilayered oncocytic epithelia with supporting stroma composed largely of lymphoid tissue) showed type A or B perfusion curves with high washout ratio (ⱖ30%) on dynamic contrast-enhanced images and low ADC values (0.88 ⫾ 0.17 ⫻ 10⫺3 mm2/s) on
diffusion-weighted images (Fig 1). The epithelial stroma and lymphoid tissue with accumulating micro-scopic complicated cysts also showed type A or B time–signal intensity curves on dynamic images, but their washout ratio was sometimes low (⬍30%) (Fig 2).
Discussion
It is clinically important to determine preopera-tively whether a salivary gland tumor is benign or malignant, because such a determination will strongly influence the choice of surgical procedure. If the tumor is benign, waiting to remove it allows it to grow larger, making the eventual surgery more difficult and prone to complications. In case of pleomorphic ade-noma, prolonged delay can lead to malignant change, and therefore prompt local excision or superficial parotidectomy. If the mass is initially malignant, total
parotidectomy with or without facial nerve removal is performed without delay (1, 2). As for Warthin tu-mors, enucleation is recommended when the diagno-sis is known preoperatively, and ⬍2% recurrence is reported (15–17).
The morphology and extent of head and neck tu-mors and their relationship to adjacent structures can be clearly shown by MR imaging. However, it is com-monly thought that MR imaging cannot make a reli-able distinction between benign and malignant neo-plasms, and that a pathologic diagnosis by such method is out of reach (6–11). Nevertheless, Yabuu-chi et al (12) and Wang et al (13) have reported that dynamic contrast-enhanced and diffusion-weighted imaging methods are useful for predicting whether salivary gland tumors are benign or malignant.
Warthin tumor generally has been regarded as the second most common benign tumor of the parotid gland after pleomorphic adenoma. It occurs largely in middle-aged and older men (18) and usually in the parotid gland or periparotid region, mostly involving the inferior pole of the gland. Multicentric occur-rence is seen more often with Warthin tumor than any other salivary gland tumor. Warthin tumors usually are spherical to ovoid, have a smooth surface, and normally are 2 to 4 cm in diameter. All tumors in this study showed well-defined margins on T1- and T2-weighted images, and the average maximal cross-sec-tional diameter of the Warthin tumors at our institute was 2.4 cm (range, 0.8–5.0 cm). Our data agreed well with data reported in previous articles (18, 19).
al-ways appear as high-signal-intensity areas on T1-weighted images.
Both the cellular matrix with usual large cysts and with complicated cysts, which were small and slitlike, showed type A or B time–signal intensity curves on
dynamic contrast-enhanced images. Our data agreed well with data reported in previous articles (8, 12, 14). According to Yabuuchi et al (12), a correlation ex-isted between the washout ratio and cellularity-stro-mal grade; they reported that Warthin tumors with
FIG 1. Images of a Warthin tumor in the left parotid gland of a 70-year-old man.
A, STIR image (4000/30), obtained in the axial plane, shows the tumor with moderate-to-high signal intensity. The high-signal-intensity area is a cystic lesion (*); the area showed no enhancement on contrast-enhanced images (see panelC, region of interest2).
B, T1-weighted image (400/9), obtained in the axial plane, shows a hypointense tumor.
C, Fat suppression contrast-enhanced T1-weighted image (300/20), obtained in the coronal plane, shows solid (region of interest1) and cystic (region of interest2) tumor in the inferior pole of the parotid gland.
D, Signal intensity graph shows that the washout ratio of the solid component was 41%. The cystic region shows no enhancement (type E). The ADC values of the solid and cystic components were 0.96⫻10⫺3mm2/s and 2.74⫻10⫺3mm2/s, respectively. The ADC value of the spinal cord was 1.02⫻10⫺3mm2/s.
E, Axial section of the specimen shows solid and large cystic components (*). The large cyst lost its contents.
many microvessels and hypercellular stromata had a high washout ratio (ⱖ30%) and that malignant tu-mors with many microvessels and hypocellular stro-mata had a low washout ratio (⬍30%). In our study, 12 (63%) of the 19 Warthin tumors showed an exclu-sively high washout ratio, except in the unenhanced areas. The other seven (37%) had low washout ratio components, and one of the seven had low washout ratio components only. In the present study, a differ-ence was shown concerning washout ratio between the areas containing usual microscopic cysts and mi-croscopic complicated cysts. The permeability and diffusion of contrast material in the two areas can be assumed to be different, with contrast material pos-sibly diffusing in complicated cysts as it does in foamy cells, red cells, and neutrophils. Complicated cysts would then form an extracellular matrix containing slowly distributed and accumulating contrast material.
The average value of the washout ratio of all 19 Warthin tumors was 44.0%⫾ 20.4 and that of all 17
malignant parotid tumors was 11.9%⫾11.6. A 30% washout ratio is generally considered the borderline for predicting whether salivary gland tumors are be-nign or malignant.
The average ADC value of 19 Warthin tumors (0.96 ⫾ 0.13 ⫻ 10⫺3 mm2/s) was significantly lower
than that of 17 malignant tumors (1.19⫾0.19⫻10⫺3
mm2/s) (P ⬍ .01). Macroscopic cysts showing high
signal intensity on STIR and T2-weighted images had high ADC values. In the case of Warthin tumors, epithelial and lymphoid stromata with microscopic slitlike cysts filled with proteinous fluid had low ADC values. It was not surprising that the mean ADC value of large cystic components was markedly higher than that of hypercellular tissue, because the mobility of water protons is relatively freer in fluid than in other tissues. The small cysts filled with proteinous fluid in Warthin tumors could not be detected as high-signal-intensity foci on STIR and T2-weighted images, and they had lower ADC values than the
high-signal-FIG 2. Images of a Warthin tumor in the left parotid gland of a 61-year-old man.
A, STIR image (4000/30), obtained in the axial plane, shows the tumor to be iso- to hypointense to the parotid gland. Characteristically small low-signal-intensity foci (arrows) can be detected. The margin of the tumor also has hypointense foci.
B, T1-weighted image (400/9), obtained in the axial plane, shows the tumor to have the isointensity of muscle and relatively high-signal-intensity areas, whereas the STIR image shows low-signal-intensity areas (arrows). The margin of the tumor also is hypointense on T1-weighted images.
C, Axial dynamic contrast-enhanced image shows all areas of this tumor to have type B perfusion curves.
D, Signal intensity graph shows that foci that showed hypointensity on the STIR image and relatively high signal intensity on the T1-weighted image (region of interest1) had a low washout ratio (3%) and the other region (region of interest2) had a high washout ratio (54%).
intensity cysts on STIR and T2-weighted images. The difference between the two types of cysts can be attributed to the viscosity of their contents. Highly viscosous contents, such as dense proteinous secre-tions, show lower ADC values than those of serous fluid (23). Hypercellular matrix and microscopic slit-like cysts filled with highly viscosous contents in War-thin tumor have low ADC values on diffusion-weighted images. According to Wang et al (13), the mean ADC value of malignant lymphomas (0.66 ⫾
0.17 ⫻ 10⫺3 mm2/s) was significantly smaller (P ⬍
.001) than that of carcinomas (1.13 ⫾ 0.43 ⫻ 10⫺3
mm2/s), which in turn was significantly smaller (P ⫽
.002) than that of benign solid tumors. They used an ADC value smaller than 1.22⫻10⫺3mm2/s for
pre-dicting malignancy. Their study included only three Warthin tumors among 10 benign solid tumors of the head and neck. The ADC values of spinal cords in our study were similar to those reported by Wang et al, but all Warthin tumors in our study would be falsely positive if the criterion presented by Wang et al were used. We think that a low ADC value is a noteworthy feature of Warthin tumor.
Conclusion
Most Warthin tumors were revealed to involve the inferior pole of parotid glands and to have a smooth margin on T1- and T2-weighted images. Warthin tu-mor, epithelial stroma, and lymphoid tissue with mi-croscopic cysts filled with proteinous secretion showed early enhancement, type A or B perfusion curves, and a high washout ratio (ⱖ30%) on dynamic contrast-enhanced images and a low ADC value on diffusion-weighted images. The cellular components with accumulated microscopic cysts containing pro-teinous fluid with foamy cells, red cells, and neutro-phils were recognized as high-signal-intensity foci on T1-weighted images and characteristically hypoin-tense areas on STIR and T2-weighted images. These cellular components with accumulated microscopic complicated cysts showed a low washout ratio (⬍30%) on dynamic contrast-enhanced images. The additional information of ADC, washout ratio, and time– signal intensity curves confirmed that the tumor was a Warthin tumor. A 30% washout ratio threshold tended to be useful for predicting whether salivary gland tumors were benign or malignant. The ADC values of Warthin tumors (0.96⫾0.13⫻10⫺3mm2/s)
were significantly lower (P⬍ .01) than those of ma-lignant tumors (1.19⫾0.19 ⫻10⫺3mm2/s), as were
the signal intensities of the characteristic hypointense areas of Warthin tumors on STIR and T2-weighted images. Our extensive routine MR imaging study re-quires approximately 15 minutes to obtain all images and is excellent not only for assessing the extent of a salivary gland tumor and the relationship to adjacent structures, but also for determining whether the tu-mor is benign or malignant.
Acknowledgment
We are grateful to Chikako Suzuki for arranging the prep-arations of the study.
References
1. Donovan DT, Conley JJ.Capsular significance in parotid tumor surgery: reality and myths of lateral lobectomy. Laryngoscope
1984;94:324–329
2. Dykun RJ, Deitel M, Borowy ZJ, Jackson S.Treatment of parotid neoplasms.Can J Surg1980;23:14–19
3. Que Hee CG, Perry CF.Fine-needle aspiration cytology of parotid tumours: Is it useful?Aust N Z J Surg2001;71:345–348
4. Zbaren P, Schar C, Hotz MA, Loosli H. Value of fine-needle aspiration cytology of parotid gland masses. Laryngoscope
2001;111:1989–1992
5. Flezar M, Pogacnik A.Warthin’s tumour: unusual vs. common morphological findings in fine needle aspiration biopsies. Cytopa-thology2002;13:232–241
6. Schlakman BN, Yousem DM.MR of intraparotid masses.AJNR Am J Neuroradiol1993;14:1173–1180
7. Joe VQ, Westesson PL.Tumors of the parotid gland: MR imaging characteristics of various histologic types.AJR Am J Roentgenol
1994;163:433–438
8. Tsushima Y, Matsumoto M, Endo K, Aihara T, Nakajima T. Char-acteristic bright signal of parotid pleomorphic adenomas on T2-weighted MR images with pathological correlation. Clin Radiol
1994;49:485–489
9. Vogl TJ, Dresel SH, Spath M, et al.Parotid gland: plain and gadolinium-enhanced MR imaging.Radiology1990;177:667–674 10. Freling NJ, Molenaar WM, Vermey A, et al.Malignant parotid
tumors: clinical use of MR imaging and histologic correlation. Radiology1992;185:691–696
11. Browne RF, Golding SJ, Watt-Smith SR.The role of MRI in facial swelling due to presumed salivary gland disease. Br J Radiol
2001;74:127–133
12. Yabuuchi H, Fukuya T, Tajima T, Hachitanda Y, Tomita K, Koga M. Salivary gland tumors: diagnostic value of gadolinium-en-hanced dynamic MR imaging with histopathologic correlation. Radiology2003;226:345–354
13. Wang J, Takashima S, Takayama F, et al.Head and neck lesions: characterization with diffusion-weighted echo-planar MR imaging. Radiology2001;220:621–630
14. Takashima S, Noguchi Y, Okumura T, Aruga H, Kobayashi T.
Dynamic MR imaging in the head and neck. Radiology
1993;189:813–821
15. Ebbs SR, Webb AJ. Adenolymphoma of the parotid: aetiology, diagnosis and treatment.Br J Surg1986;73:627–630
16. Heller KS, Attie JN.Treatment of Warthin’s tumor by enucleation. Am J Surg1988;156:294–296
17. Batori M, Mariotta G, Giovannone G, Casella G, Casella MC.
Warthin’s tumor of parotid gland: treatment of a retroneural lesion by enucleation.Eur Rev Med Pharmacol Sci2002;6:105–111 18. Eveson JW, Cawson RA.Salivary gland tumours: a review of 2410 cases with particular reference to histological types, site, age and sex distribution.J Pathol1985;146:51–58
19. Ellis GL, Auclair PL. Warthin’s tumor (papillary cystadenoma lymphomatosum).In:Tumors of the Salivary Glands: Atlas of Tumor Pathology.Washington, D.C.: Armed Forces Institute of Pathology; 1996:68–80
20. Minami M, Tanioka H, Oyama K, et al.Warthin tumor of the parotid gland: MR-pathologic correlation.AJNR Am J Neuroradiol
1993;14:209–214
21. Chaudhuri R, Bingham JB, Crossman JE, Gleeson MJ.Magnetic resonance imaging of the parotid gland using the STIR sequence. Clin Otolaryngol1992;17:211–217
22. Ryu KN, Jin W, Ko YT, et al.Bone bruises: MR characteristics and histological correlation in the young pig. Clin Imaging
2000;24:371–380
![{5,5′ Dihydroxy 2,2′ [o phenylenebis(nitrilomethylidyne)]diphenolato}nickel(II) dihydrate](data:image/gif;base64,R0lGODlhAQABAIAAAP///wAAACH5BAEAAAAALAAAAAABAAEAAAICRAEAOw==)