ISSN Online: 1947-3818 ISSN Print: 1949-243X
Wind Power System Risk Assessment Based on
Fuzzy Clustering and Copula Function Modeling
Mingshun Liu
1, Lijin Zhao
1, Liang Huang
1, Wenhao Han
2, Changhong Deng
2, Zhijun Long
21Guizhou Power Grid Co., Ltd., Guiyang, China
2School of Electrical Engineering, Wuhan University, Wuhan, China
Abstract
According to the characteristics of the correlation of multiple wind farm out-put, this paper put forwards a modeling method based on fuzzy c-means clus-tering and the copula function, and correlation wind farms are inserted into IEEE-RTS79 reliability system for risk assessment. By the probabilistic load flow calculated by Monte Carlo simulation method, the probability of the ac-cident is derived, and bus voltage and branch power flow overload risk index are defined in this paper. The results show that this method can realize the modeling of the correlation of wind power output, and the risk index can identify the weakness of the system, which can provide reference for the oper-ation and maintenance personnel.
Keywords
Correlation, Fuzzy Clustering, Copula Function, Risk Assessment
1. Introduction
Safety is the key of the power system. With the development of wind power technology and large-scale wind power integration, the strong stochastic volatil-ity is bound to bring more serious challenges to stable operation of the system [1]. Besides considering that the same area may have multiple wind farms, due to the similarity of factors such as geographical environment, its output will show some kind of relationship [2]. So it’s necessary to conduct the risk assess-ment of electric power system considering wind power correlation to identify the system weak link, and then take the corresponding effective measures to ensure safety and steady operation.
To consider output correlation of wind power and then conduct risk assess-ment, modeling the correlation problem is the beginning. Copula function [3] is effective in correlation problem. [4] connects copula theory with Monte Carlo
How to cite this paper: Liu, M.S., Zhao, L.J., Huang, L., Han, W.H., Deng, C.H. and Long, Z.J. (2017) Wind Power System Risk Assessment Based on Fuzzy Clustering and Copula Function Modeling. Energy and Power Engineering, 9, 352-364.
https://doi.org/10.4236/epe.2017.94B041
simulation method for probabilistic load flow calculation. [5] [6] use a hybrid copula function for the modeling of input variables of correlation, and deter-mined the weighting coefficient of each copula function through expectation maximization method and least square method, overcoming the deficiency of using only one copula function. In [8], the author established wind farm reliabil-ity model considering the influence of uncertain factors, then proposed a risk assessment method for the composite generation and transmission systems in-cluding wind farms based on dispersed sampling Monte Carlo algorithm. [9] es-tablish adequacy evaluation model for composite generation and transmission systems which contain wind farms based on sequential Monte Carlo simulation method. Based on vulnerability of the risk theory evaluation system, the conse-quences severity with linear function was quantified in [10], but shelter pheno-menon exists. In [11], utility function was introduced to measure severity of consequences caused by element fault for the failure probability model of the overhead line.
In this paper, the fuzzy C means clustering is applied to wind power output data firstly and copula function is modeled for each class. The probabilistic load flow of wind power is calculated by Monte Carlo simulation, so the probability of the accident was derived. The utility function and the risk theory is combined to quantify the risk indicators. Matlab simulation results show that the method can assess system risk accurately, and identify system weaknesses, which has sig-nificance for power system planning operation, differentiation operation and maintenance.
2. Wind Power Output Correlation Modeling
2.1. Copula Function Theory
Copula can joint distribution of multidimensional random variables with one- dimensional marginal. Take binary random variable as an example to introduce copula function.
H(x,y) is a two joint distribution function with the edge distribution F(x) and
G(y), Sklar Theorem points out that there exists the unique Copula function
C(U,V) which meets:
( , ) [ ( ), ( )]
H x y =C F x G y (1)
with empirical Copula distribution functions so as to select the optimal Copula. The empirical Copula function is defined as follows:
(Xi,Yi) (i = 1, 2, ···, n) is samples form bivariate population (X,Y). The
empiri-cal distribution functions of X and Yare Fn(x) and Gn(y) respectively, the sample
empirical Copula distribution function was:
[ ( ) ] [ ( ) ] 1
1
( , ) n i n i , [0,1]
n
n F x u G y v
i
C u v I I u v
n = ≤ ≤
=
∑
∈ (2)where I[ ]⋅ is an indicative function. It means when F xn( )i ≤u, I[Fn(xi)≤u]=1;
otherwise, I[Fn(xi)≤u]=0.
Through calculating and comparing square Euclidean distance of each Copula function and empirical Copula distribution function, optimal function can be obtained.
2 2
1
| ( , ) ( , ) |
n
m n m
i
d C u v C u v
=
=
∑
− (3)where m is the chosen Copula function type, Cn(u,v) is empirical Copula
distri-bution function, Cm(u,v) is the selected Copula distribution function, dm2 is the square Euclidean distance. The smaller value shows that the selected Copula function is more effective in depicting correlation. In this paper, squared Eucli-dean distance is used to quantified the correlation degree of Copula function.
2.2. Fuzzy Clustering
The final clustering results of traditional clustering algorithms such as K-means depends on the choice of initial aggregation point or the number of strict classi-fication in some degree. While fuzzy clustering aims at the optimization of the objective function, dynamically adjusts the clustering center and the member-ship degree, and then determines the class of the sample points by iterative con-vergence so as to automatically classify the sample data. In this paper, the fuzzy C means clustering is used for the wind farm output classification.
11 12 1
1
21 22 2
2
1 2
p
p
n n np
n
x x x
x x x
x x x
= = x x X x (4)
X is a given sample matrix, p is the number of random variables, n is the number of random variables. Fuzzy clustering is to divide the n observations in-to c class, the clustering center is V = {v1,v2, ···, vc}, of which vi= (vi1, vi2, ···, vip) (i =
1, 2, ···, c).
uikis the membership grade of class i membership, and 1 1 c ik i u = =
∑
, the object-tive function is defined as:
(
)
21 1
min{ || || }
n c m
ik k i
k i u
= =
=
∑∑
−U = (uik)c×n shows membership matrixdik= ||xk− vi||. The objective function
value J(U,V) is expressed as the weighted square distance and the weighted
square distance between the sample and the cluster center. The specific steps are:
1) Determine the c number of classes, power exponent m and the initial
membership matrix (0) (0)
(uik )
=
U , determine the initial membership matrix U(0)
through a series of random numbers produced by a uniform distribution in [0,1].
2) l is iteration step number. The cluster center at step l is:
( ) ( )
( )
( )( )
1 1 1 1( 1, 2, , )
n m
l
ik k
l k
i n m
l ik k i c u u − = − = = =
∑
∑
xv (6)
3) Modify membership matrix U(l), then calculate the value of the objective
function J(l).
2 ( )
( ) 1
( ) 1
|| ||
1 / ( ) ( 1, 2, , ; 1, 2, , )
|| ||
l c
l k i m
ik l
j k j
u − i c k n
=
−
= = =
−
∑
x vx v (7)
( ) ( ) ( ) ( ) ( ) 2
1 1
( , ) ( ) (|| )
n c
l l l l m l
ik k i
k i u
= =
=
∑∑
−J U V x v (8)
4) Determining membership tolerance of terminating iteration ε >u 0. When ( ) ( 1)
max{| l l |}
ik ik u
u −u − <
ε
, the iteration terminates, otherwise l = l + 1, then turnto step (2).
Through the above steps, the final cluster center V and the membership U can be obtained, and sample class can be determined according to the element value of U.
3. Power System Risk Index
Power system risk is a comprehensive measurement system of probability and the seriousness of the consequences of the accident [12], which can reflect the effects of the accident on the operation, according to the theory of risk, the risk can be expressed as a product of the accident probability and severity, expression is as follows [13],
Risk=Pro Sev⋅ (9)
where Risk is risk value, Pro is the probability of accident, Sev is the severity of accident consequence.
or-der to master the security of power system, this paper defines voltage over limit risk and branch flow overload risk index.
3.1. Voltage over Limit Risk
The voltage over limit risk describes the possibility and harm degree of the node voltage limit in the system, which reflects the risk of voltage collapse when the voltage value deviates from the normal operating level. The magnitude of the voltage determines the severity of the voltage over limit, and the severity is quantified by the deviation between the actual value and the rated value. The node voltage 1.0 pu means the severity function value is 0; with the voltage value deviates from the rated value, the severity increases. The node voltage over limit severity function is expressed as:
=e LVi 1, | 1 | i
L
V LVi i
S − L = −V (10)
1 V
i N
V Vi i V
i
R P αS
=
=
∑
⋅ (11)where SViis voltage node i over limit severity, Viis the voltage, LLViis the voltage
fluctuation deviation; RVis the system voltage over limit the total risk, PViis the
probability of node i voltage over limit, αiis the weight factor, NV is node
num-ber.
3.2. Branch Power Flow Overload Risk
Transmission line has transmission power limit, branch flow overload risk re-flects the line withstand certain transmission power possibility and harm degree. In order to avoid the occurrence of masking phenomenon, but not ignore the potential risks which line is close to limit completely, risk appears when the line load rate reach 90%. The branch power flow overload severity function is de-fined as:
1, 0.9 Oi
i
L
L Oi i i
S =e − L = −l L (13)
1 L
i N
L Li i L
i
R P
β
S=
=
∑
⋅ (14)where SLi is a branch of I power flow overload severity, li is the current trend of i
value, Liis power transmission limit of I branch, Lois power flow deviation; RL is
the total risk system of branch power flow overload, PLi is the probability of branch i overload, βi is an important weight factor, NLis the total branch number.
Carlo simulation, then the probability of the bus voltage limit and the power flow overload can be obtained. Concrete steps are:
1) Pretreat wind farm raw data and perform fuzzy clustering.
2) The edge distribution function is obtained by the kernel density estimation based on nonparametric estimation. Draw edge distribution histogram to ob-serve the input variable dependent structure.
3) Calculate the square Euclidean distance for each kind of data to select op-timal Copula function to produce the correlated output samples.
4) Model power system with wind farm integration; Calculate probabilistic power flow to obtain probability of bus voltage limit and branch flow overload.
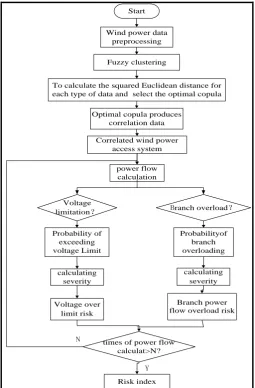
5) Calculate the node voltage over limit and branch power flow overload se-verity degree of the system, and define the comprehensive sese-verity as the arith-metic mean of the total severity of N times power flow calculation.
[image:6.595.245.501.323.712.2]6) Multiply the probability with the consequence severity to obtain the risk value.
Figure 1 is the flow chart.
Wind power data preprocessing
Fuzzy clustering
power flow calculation
To calculate the squared Euclidean distance for each type of data and select the optimal copula
Correlated wind power access system
Probability of exceeding voltage Limit
Probabilityof branch overloading
calculating severity Voltage
limitation? Branch overload?
calculating severity
Voltage over limit risk
Branch power flow overload risk
times of power flow calculat>N?
Risk index
Y N
Optimal copula produces correlation data
Start
5. Simulation Results and Analysis
5.1. Wind Power Output Correlation Modeling and Evaluation
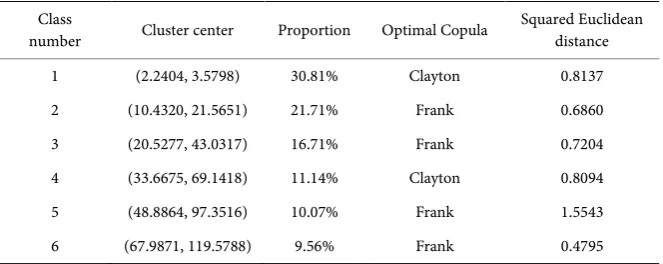
Based on the 50,000 sets of measured output data of Australian wind farms in spring, this paper uses fuzzy clustering method combined with Copula function for correlation modeling. The validity of the method is verified by comparing with the measured data.Fuzzy clustering of the sample matrix is divided into 6 classes; Table 1 shows the cluster analysis results and the selected optimal Copula function.
To eliminate the influence of sample size difference on correlation coefficient, the total size of the generated data and the measured data should be the same, and produce the output sample of corresponding proportion. Figure 2 is com-parison of the frequency histogram of the measured output and the simulated output.
In Figure 2, the left one is frequency histogram of measured output data, the right one is frequency histogram of output by clustering and Copula function. As can be seen from Figure 2, there exists correlation between the output of the two wind farms, the correlation is different in different locations, the specific performance of the lower tail has strong correlation, the upper tail is relatively weak, the weakest correlation is in the central. After fuzzy clustering analysis, the lower tail correlation of class 1 and class 4 is depicted by Clayton-Copula func-tion, The Frank-Copula function depicts the symmetry of the other classes. Clustering refines the modeling process and has better fitting effect. The Pearson linear correlation coefficient, Kendall rank correlation coefficient, Spearman rank correlation coefficient and relative error of quantitative σiare calculated to
analyses excellence of modeling.
| simu real |
i
real
P P
P
σ = − (14)
where Preal is the wind farm i measured output. Psimu is wind farm i simulation
output. N represents the total number of samples. For each clustering scheme,
[image:7.595.208.540.599.731.2]the simulated 20 times average is used to reduce the randomness error. Table 2 is the comparison result of correlation coefficient and relative error between the method and the measured data.
Table 1. Fuzzy clustering results.
Class
number Cluster center Proportion Optimal Copula Squared Euclidean distance
1 (2.2404, 3.5798) 30.81% Clayton 0.8137
2 (10.4320, 21.5651) 21.71% Frank 0.6860
3 (20.5277, 43.0317) 16.71% Frank 0.7204
4 (33.6675, 69.1418) 11.14% Clayton 0.8094
5 (48.8864, 97.3516) 10.07% Frank 1.5543
Table 2. Correlation and error comparison.
Pearson Kendall Spearman N i
i
σ
∑
Actual Data 0.9140 0.7915 0.9348 -
Copula 0.9221 0.7957 0.9441 0.1976
Figure 2. Comparison of measured and simulated output data.
From the above table, we can see that all kinds of optimal Copula functions generated by fuzzy clustering are clustered around the center of clustering, the concentration is strong and the relative error is smaller. This method can accu-rately describe the correlation of wind power output.
5.2. Risk Assessment of Wind Power Access to Power System
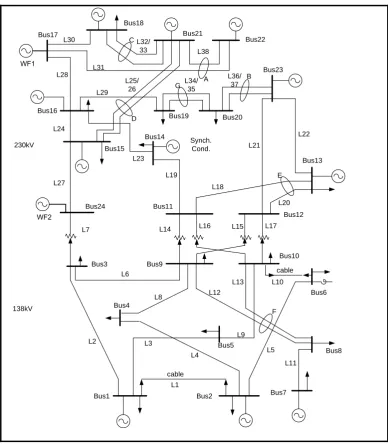
The above two wind farms are respectively integrated into IEEE-RTS79 reliabili-ty test system node 17 and 24, wind turbine takes constant power factor control method, and its power factor is cosφ = −0.95, integration node is taken as PQnode with negative power and simulation scale N = 50,000. The load fluctuation
0 0.2 0.4 0.6 0.8 1
0 0.2
0.4 0.6
0.8 1 0
0.02 0.04 0.06 0.08 0.1
WF2 WF1
F
requenc
y
0 0.2 0.4 0.6 0.8 1
0 0.2
0.4 0.6
0.8 1 0
0.02 0.04 0.06 0.08 0.1
WF2 WF1
F
requenc
is random variable which obeys normal distribution, the expectation is the given value of the standard system, and variance is 5% of the expectation, Figure 3 is the example.
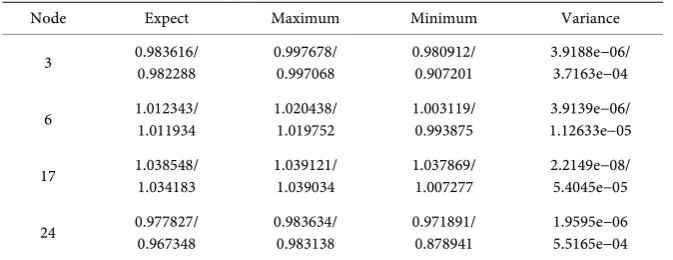
When the two correlation wind farms are integrated into node 17 and 24, the voltage fluctuation increases at the access point, the voltage shows a downward trend, and the low voltage over limit may appear. Table 3 is partial node voltage information. The voltage fluctuations before and after wind power integration are shown in Figure 4 and Figure 5.
Compared with the no integration only considering the random fluctuation of load, the volatility of node far away from the integration node (such as node 6) is slightly enhanced, but still fluctuates in the safe range; Node 17 and 24 voltage and access node nearby (such as node 3) showed larger variance, the voltage fluctuation is greatly increased, the minimum voltage is lower than the lower
Bus17
Bus18
Bus21
Bus22
Bus16
Bus19 Bus20
Bus23
Bus15
Bus14
Bus24 Bus11
Bus12 Bus13
Bus3 Bus9
Bus10
Bus6 Bus4
Bus5
Bus8
Bus1 Bus2 Bus7
cable
cable
138kV
230kV Synch.Cond.
A B
C
D
G
E
F
L1
L2 L3
L4 L5
L6 L7
L8
L9
L10
L11 L12
L13
L14 L16 L15 L17
L18 L19
L20 L21
L22
L23 L24
L25/ 26
L27 L28
L29 L30
L31
L32/ 33
L34/ 35
L36/ 37 L38
WF1
[image:9.595.149.538.275.720.2]WF2
Figure 4. Voltage without wind integration.
Figure 5. Voltage with wind integration.
Table 3. Node voltage information.
Node Expect Maximum Minimum Variance
3 0.983616/ 0.982288 0.997678/ 0.997068 0.980912/ 0.907201 3.9188e−06/ 3.7163e−04
6 1.012343/ 1.011934 1.020438/ 1.019752 1.003119/ 0.993875 1.12633e−05 3.9139e−06/
17 1.038548/ 1.034183 1.039121/ 1.039034 1.037869/ 1.007277 2.2149e−08/ 5.4045e−05
24 0.977827/ 0.967348 0.983634/ 0.983138 0.971891/ 0.878941 1.9595e−06 5.5165e−04
Notes: “*/*”in the table means “no wind integration/wind integration” data.
limit, there is a low voltage situation and a voltage over limit risk. Wind power access changes the original power flow distribution, so the branch power flow may reach the transmission limit of line, destroy the thermal stability of the line and cause overload phenomenon, which leads to the fault of relay protection
0.96 0.97 0.98 0.99 1 1.01 1.02 1.03 1.04 1.05 1.06
1 3 5 7 9 11 13 15 17 19 21 23
Expect Maximum Minimum
0.87 0.89 0.91 0.93 0.95 0.97 0.99 1.01 1.03 1.05
1 3 5 7 9 11 13 15 17 19 21 23
[image:10.595.206.543.515.645.2]operation and may cause cascading failures also if serious. According to risk theory formula, the importance factor is taken as 1, the system node voltage over limit and branch flow overload risk are calculated as shown in Table 4.
In order to quantitatively characterize the line carrying capacity when the maximum power flow occurs, the maximum load rate is defined:
max
lim m
S S
λ = (13)
where smax is the branch maximum power flow, Slim is the maximum
transmis-sion limit.
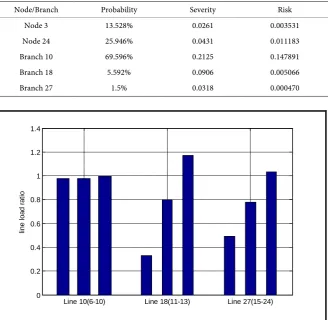
Figure 6 is the maximum load overload branch flow rate, the penetration of
wind power for η, pictures from left to right respectively shows the maximum
load ratio of without wind, permeability of 0.4η and η.
[image:11.595.209.538.394.714.2]Branch 10 has been close to full load while it is not connected to the maxi-mum load rate of wind power, therefore, the line transmission capacity should be increase to reduce risk. The power flow of branch 18 and branch 27 has changed greatly after the access of wind power. With the increase of permeabili-ty, the maximum line load rate increases gradually, and the grid risk exists. Branch 18 is the transformer branch, branch 24 is a high voltage class 230 kV, and is an important channel for the transmission of electricity to the 230 kV
Table 4. Risk value.
Node/Branch Probability Severity Risk
Node 3 13.528% 0.0261 0.003531
Node 24 25.946% 0.0431 0.011183
Branch 10 69.596% 0.2125 0.147891
Branch 18 5.592% 0.0906 0.005066
Branch 27 1.5% 0.0318 0.000470
Line 10(6-10) Line 18(11-13) Line 27(15-24) 0
0.2 0.4 0.6 0.8 1 1.2 1.4
line l
oad r
at
io
area, there should be attention to the risk.
As can be seen, in the current wind power access mode, node 3 and 24 have the risk of low voltage, 10, 18 and 27 have the branch power flow overload risk, which can be regarded as the key nodes and lines to be paid attention to. The system personnel should carry on the pertinence analysis, reasonably plan the wind power access point and the access capacity, take the corresponding meas-ure to reduce the electric network risk, and provides the safeguard for the power system safe reliable operation.
6. Conclusions
Based on the measured output data of wind farm, the fuzzy clustering and Co-pula function theory are combined to realize the correlation modeling of wind power output. The wind power probabilistic flow is calculated by Monte Carlo simulation method to obtain the probability of the node voltage over limit and branch flow overload. The severity is measured by utility function, and the risk value is calculated according to the risk theory. Results show that:
1) After the fuzzy clustering processing for the total sample, the optimal Co-pula function is modeled for each kind of data, which can accurately describe the correlation of wind power output.
2) In and near the wind power access position, the voltage fluctuation is strong and prone to have voltage over limit risk.
3) This method can evaluate the risk of branch flow overload, identify the sys-tem critical lines and provide theoretical support for differential operation and maintenance.
This method in the paper can realize the modeling of wind powers with cor-relation, quantitative risk index of limit over voltage and branch flow overload and realize the power grid risk assessment of the operation condition. It can identify the weak links and key lines when the wind power access to the power system which can provide the basis for the realization of the difference opera-tion.
References
[1] Bart, C.U. and Madeleine G, Wil L K. (2007) Impacts of windpower on thermal generation unit commitment anddispatch. IEEE Transactions on Energy Conver-sion, 22, 44-51.https://doi.org/10.1109/TEC.2006.889616
[2] Rong X.X., IE Z.H., Shi, W.H., at el. (2014) Analysis on Probabilistic Load Flow in Power Gird Integrated With Wind Farms Considering Correlativity Among Differ-ent Wind Farms. Power System Technology, 38, 2161-2167
[3] Pagaefthymiou G. (2009) Using Copulas for modeling stochastic dependence in power system uncertainty analysis. IEEE Trans on Power System, 4, 40-49.
https://doi.org/10.1109/TPWRS.2008.2004728
[4] Cai, D.F., Shi, D.Y. and Chen, J.F. (2013) Probabilistic load flow considering corre-lation between input random variables based on Copula theory. Power System Pro-tection and Control, 41, 13-19.
on Hybrid Copula. Automation of Electric Power Systems, 2014, 38, 17-22.
[6] Ji, F., Cai, X.G. and Wang, J. (2014) Wind Power Correlation Analysis Based on Hybrid Copula. Automation of Electric Power Systems, 38, 1-5+32.
[7] Wang, J., Cai, X.G., and Ji, F.(2013) A Simulation Method of Correlated Random Variables Based on Copula. Proceedings of the CSEE, 33, 75-82+13.
[8] Jiang, C., Liu, W.X., Zhang, J.H., at el. (2014) Risk Assessment of Generation and Transmission Systems Considering Wind Power Penetration. Transactions of China Electrotechnical Society, 29, 260-270.
[9] Zhang S., Li, G.Y. and Zhou, M. (2010) Reliability Assessment of Generation and Transmission Systems Integrated With Wind Farms. Proceedings of the CSEE, 30,8-14.
[10]Chen, W.H., Jiang, Q.Y., Cao, Y.J., at el. (2005) Risk-Based Vulnerability Assess-ment in Complex Power Systems. Power System Technology, 29, 12-17.
[11]Zhang, Y.M., Zhang, Z.H., Yao, F., at el. (2013) Risk assessment of power system components based on the risk theory. Power System Protection and Control, 41, 73-78.
[12](1997) GIGRE Task Force 38.03.12. Power System Security Assessment, a Position Paper, Elctra, 1997, 175: 49-77
[13]Fu, W.H. andMcCalley, J.D. (2001) Risk Based Optimal Power Flow.IEEE Power Tech Proceedings, Porto, Portugal, 2001.
[14]Dong, L., Cheng, W.D. and Yang, Y.H. (2009) Probabilistic Load Flow Calculation for Power Grid Containing Wind Farms. Power System Technology, 33, 87-91. [15]Billintonr, L.Y. (1994) Reliability Evaluation of Electric Power Systems Using Monte
Carlomethods.Plenue Press,New York.
Submit or recommend next manuscript to SCIRP and we will provide best service for you:
Accepting pre-submission inquiries through Email, Facebook, LinkedIn, Twitter, etc. A wide selection of journals (inclusive of 9 subjects, more than 200 journals)
Providing 24-hour high-quality service User-friendly online submission system Fair and swift peer-review system
Efficient typesetting and proofreading procedure
Display of the result of downloads and visits, as well as the number of cited articles Maximum dissemination of your research work
Submit your manuscript at: http://papersubmission.scirp.org/