DUTH at SemEval-2017 Task 5: Sentiment Predictability in Financial
Microblogging and News Articles
Symeon Symeonidis John Kordonis Dimitrios Effrosynidis Avi Arampatzis
Database & Information Retrieval research unit, Department of Electrical & Computer Engineering, Democritus University of Thrace, Xanthi 67100, Greece
{ssymeoni,ioankord1,dimievfr,avi}@ee.duth.gr
Abstract
We present the system developed by the team DUTH for the participation in Semeval-2017 task 5 - Fine-Grained Sen-timent Analysis on Financial Microblogs and News, in subtasks A and B. Our ap-proach to determine the sentiment of Mi-croblog Messages and News Statements & Headlines is based on linguistic pre-processing, feature engineering, and su-pervised machine learning techniques. To train our model, we used Neural Network Regression, Linear Regression, Boosted Decision Tree Regression and Decision Forrest Regression classifiers to forecast sentiment scores. At the end, we present an error measure, so as to improve the per-formance about forecasting methods of the system.
1 Introduction
Social media sentiment is an important indica-tor of public opinion. Determining sentiment can be valuable in a number of applications including brand awareness, product launches, and detecting political trends. Many microblogging platforms such as Twitter and StockTwits have become very popular and are employed by many traders and in-vestors. Recently, many studies (Pi˜neiro-Chousa et al., 2016; Van de Kauter et al., 2015; Kordo-nis et al.,2016) used sentiment from social media and financial news articles trying to analyze mar-ket movements.
This paper describes our submissions to Se-mEval 2017 task 5 (Cortis et al., 2017), which deals with sentiment analysis in microblog mes-sages for SubTask A, and sentences for news head-lines for SubTask B. In SubTask A, our model was ranked last because of a submission format
error. We perform error measures in order to ob-tain a better understanding of the strengths of these particularly new tasks and to improve the perfor-mance about forecasting methods of our model (Armstrong and Collopy, 1992). For Subtask B, our team was ranked 24th from 29 teams.
The rest of this paper is structured as follows: Section 2 provides our system’s description. Sec-tion 3 presents the experiments and some unoffi-cial results used in analyzing the system’s perfor-mance. Finally, conclusions and further directions for research are presented in Section 4.
2 System Description
In this section we present the details of our senti-ment analysis system, feature extraction and some statistics about preprocessing.
2.1 Dataset
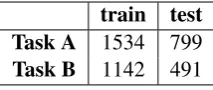
The Task 5 organizers (Cortis et al., 2017) pro-vided a training and testing set for both subtasks. For subtask A, resources of Microblog messages were Stocktwits and Twitter, which have been an-notated for fine-grained sentiment1. A collection of financially relevant news headlines which have been annotated for fine-grained sentiment, from sources such as Yahoo Finance, are given from Task Organizers for subtask B 2. Some statistics about the datasets are presented in table1.
2.2 Pre-processing and Feature Engineering
To make it suitable for reliable analysis, the data had to be pre-processed. Moreover, feature hashing was used as an approach according to (Da Silva et al., 2014), to reduce the number of features provided as input from pre-processing to 1 https://bitbucket.org/ssix-project/semeval-2017-task-5-subtask-1/
2 https://bitbucket.org/ssix-project/semeval-2017-task-5-subtask-2/
train test
Task A 1534 799
[image:2.595.245.352.62.107.2]Task B 1142 491
Table 1: Number of tweets in training (train) and testing (test) data for subtask A and B.
a learning algorithm. As first step of our approach we chose to normalize the tweet text by perform-ing the followperform-ing operations:
• Remove numbers
• Remove punctuation
• Replace all user mentions and URL ad-dresses, which were normalized to “@user” and “URL”
• Convert to lower case
Furthermore, we chose to compute the counts and cumulative frequencies of the words in the tweets. The NLTK (Bird et al.,2009) package con-tains two tools to help:
• The regexp tokenize function tokenizes the text. Tokenization is the process of dividing the text into its component tokens. In this case, the tokens are all words, since we are working with normalized text.
• The FreqDist function computes the fre-quency distribution of words in a text cor-pus. A Python Pandas data frame ( McKin-ney, 2010) is then computed from the word frequency array.
The most frequent words are in the head of the new data frame. Of these 20 most frequent words none are likely to give much information on senti-ment.
In addition, we implemented a method in order to create a bar plot of word frequency for the 60 most common words, as presented in Figure 1, to comprehend the vocabulary of microblogging messages and news headlines. Unfortunately, we saw that many of the most frequent words are stop-words, such as ‘the’, ‘and’, and ‘you’, which are not likely to be helpful in determining sentiment.
[image:2.595.310.517.160.338.2]Another tool for examining the frequency of words in a corpus of documents is the cumulative distribution frequency (CDF) plot, as presented in Figure2.
[image:2.595.311.519.356.554.2]Figure 1: Frequencies of the most common words
Figure 2: Cummulative fraction of total words vs. words
These frequent words, which are largely extra-neous, are known as stopwords and should be re-moved from the text before further analysis, unlike with few studies which take stopwords as features (Mohammad et al.,2013). So, we implemented a method to remove the stopwords from each tweet using nested list comprehensions and execute the code from previous implementation in order to vi-sualize the word frequency.
Figure 3: Frequencies of the most common words after preprocessing
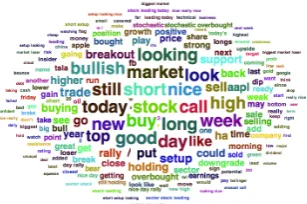
Figure 4: Wordcloud of frequent words after pre-processing
Figure 4 shows the most frequent words on dataset as a wordcloud and helps the researcher to understand if something went wrong in pre-processing.
Now, that we have cleaned the tweet text and removed stopwords, there is one last data prepa-ration step required, stemming the words. Stem-ming is a process of reducing words to their stems or roots, reduce the vocabulary size and manage the case of data sparseness (Lin and He, 2009). For example, conjugated verbs such as ‘goes’, ‘go-ing’, and ‘gone’ are stemmed to the word ”go”. Depending on suitable choice, the results can be more or less suitable for the application. In our case, we used the so popular Porter stemmer im-plemented by the PorterStemmer function in the nltk.stem.porter library.
In subsection 2.2, we described the pre-processing techniques and the features that were extracted for training our model. Section 3
presents the machine learning techniques and al-gorithms which were used for our experiments.
3 Experiments
In this section we present the main methodology implemented in our system for the SemEval 2017 Task 5. In order ti select the feature sets to use for each classifier, we have carried out a number of experiments.
3.1 Evaluation Metrics
The evaluation metric used by the task organizers was the cosine similarity, specifically, the metric ofGhosh et al.(2015). Sentiment scores had to be in scale between -1 and 1. The degree of agree-ment between predicted values and values from gold labels calculate the final result. In Section
4the error metrics about our model are presented which are the following:
• Mean Absolute Error
• Root Mean Squared Error
• Relative Absolute Error
• Relative Squared Error
• Coefficient of Determination
The selection of error measures to calibrate our model are based on other related studies (Hippert et al.,2001;Armstrong and Collopy,1992).
3.2 Machine Learning Methods
All system implementation was done using Python and the open-source machine learning toolkit scikit-learn (Pedregosa et al.,2011). In our system we implemented four classification techniques as follows:
• Linear Regression, which attemps to model the relationship between two variables by fit-ting a linear equation to the training data.
• Boosted Decision Tree Regression, which uses boosting to create an ensemble of re-gression trees. Boosting aims to learn any tree by fitting the continuing of the trees that preceded ands depends on prior trees. As a result, boosting in a decision tree ensemble contributes to small risk accruracy.
• Neural Network Regression. Although neu-ral networks are known for use in deep learn-ing problems like recognition in images, and for regression problems they are adapted too. So, where a more traditional regression model is not fitting to a solution, neural net-work regression is suited to these problems.
The above four techniques were chosen empir-ically and based on related studies (Mittal and Goel,2012;Ghiassi et al.,2013).
4 Results
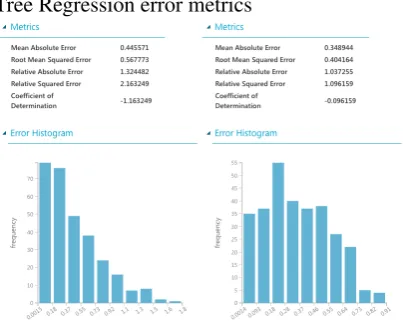
[image:4.595.311.519.101.254.2]Below, error measures of our model was done to improve our system’s performance about forecast-ing methods of the system for subtask A. Fig-ure 5 and 6 present the results for Mean Abso-lute Error, Root mean Squared Error, Relative Ab-solute Error, Relative Squared Error, and Coeffi-cient of Determination. These metrics represent the performance of our system, without consid-ering the metrics of Task. The results of error measures are promising for accuracy of our model and the prices of errors are not big to have dispro-portionate impacts for forecasting. According to Task Organizers results, our team got cosine score 0.5879725192 for Subtask B and 0.003076891426 for Subtask A (because of a submission format er-ror).
Figure 5: Linear Regression and Boosted Decision Tree Regression error metrics
5 Conclusions
[image:4.595.75.277.493.658.2]We presented a supervised regression sentiment analysis system to detect the semantic interpreta-tion of financial texts. Given the above error anal-ysis results, we conclude that our methods for sen-timent analysis on financial microblogs and news,
Figure 6: Decision Forrest Regression and Neural Network Regression error metrics
are promising. Future work will focus on feature selection and usage of some lexicons resources to achieve better results.
References
J. Scott Armstrong and Fred Collopy. 1992. Er-ror measures for generalizing about
forecast-ing methods: Empirical comparisons.
In-ternational Journal of Forecasting 8(1):69–80.
https://doi.org/10.1016/0169-2070(92)90008-W.
Steven Bird, Ewan Klein, and Edward Loper. 2009. Natural Language Processing with Python. O’Reilly Media, Inc., 1st edition.
Keith Cortis, Andr´e Freitas, Tobias Dauert, Manuela Huerlimann, Manel Zarrouk, Siegfried Handschuh, and Brian Davis. 2017. Semeval-2017 task 5: Fine-grained sentiment analysis on financial
mi-croblogs and news. In Proceedings of the 11th
International Workshop on Semantic Evaluation (SemEval-2017). Association for Computational Linguistics, Vancouver, Canada, pages 517–533.
http://www.aclweb.org/anthology/S17-2089.
Nadia FF Da Silva, Eduardo R Hruschka, and Este-vam R Hruschka. 2014. Tweet sentiment analysis with classifier ensembles. Decision Support Systems 66:170–179.
Manoochehr Ghiassi, James Skinner, and David Zim-bra. 2013. Twitter brand sentiment analysis: A hy-brid system using n-gram analysis and dynamic arti-ficial neural network. Expert Systems with applica-tions40(16):6266–6282.
470–478. http://www.aclweb.org/anthology/S15-2080.
Henrique Steinherz Hippert, Carlos Eduardo Pedreira, and Reinaldo Castro Souza. 2001. Neural net-works for short-term load forecasting: A review and evaluation. IEEE Transactions on power systems 16(1):44–55.
John Kordonis, Symeon Symeonidis, and Avi Aram-patzis. 2016. Stock price forecasting via
sen-timent analysis on twitter. In Proceedings of
the 20th Pan-Hellenic Conference on Informatics. ACM, New York, NY, USA, PCI ’16, pages 36:1– 36:6. https://doi.org/10.1145/3003733.3003787. Chenghua Lin and Yulan He. 2009. Joint
senti-ment/topic model for sentiment analysis. In Pro-ceedings of the 18th ACM conference on Informa-tion and knowledge management. ACM, pages 375– 384.
Wes McKinney. 2010. Data structures for statisti-cal computing in python. In St´efan van der Walt and Jarrod Millman, editors,Proceedings of the 9th Python in Science Conference. pages 51 – 56. Anshul Mittal and Arpit Goel. 2012. Stock Prediction
Using Twitter Sentiment Analysis. Tomx.Inf.Elte.Hu (June).
Saif M Mohammad, Svetlana Kiritchenko, and Xiao-dan Zhu. 2013. Nrc-canada: Building the state-of-the-art in sentiment analysis of tweets. arXiv preprint arXiv:1308.6242.
Fabian Pedregosa, Ga¨el Varoquaux, Alexandre Gram-fort, Vincent Michel, Bertrand Thirion, Olivier Grisel, Mathieu Blondel, Peter Prettenhofer, Ron Weiss, Vincent Dubourg, Jake Vanderplas, Alexandre Passos, David Cournapeau, Matthieu Brucher, Matthieu Perrot, and ´Edouard Duch-esnay. 2011. Scikit-learn: Machine Learning
in Python. J. Mach. Learn. Res. 12:2825–2830.
http://dl.acm.org/citation.cfm?id=1953048.2078195. Juan Ram´on Pi˜neiro-Chousa, M ´Angeles
L´opez-Cabarcos, and Ada Mar´ıa P´erez-Pico. 2016. Ex-amining the influence of stock market variables on microblogging sentiment. Journal of Business Re-search69(6):2087–2092.
Marjan Van de Kauter, Diane Breesch, and V´eronique Hoste. 2015. Fine-grained analysis of ex-plicit and imex-plicit sentiment in financial news
articles. Expert Syst. Appl. 42(11):4999–5010.