KU-MTL at SemEval-2018 Task 1:
Multi-task Identification of Affect in Tweets
Thomas Nyegaard-Signori, Casper Veistrup Helms, Johannes Bjerva, Isabelle Augenstein
Department of Computer Science University of Copenhagen
{sfq340,wqx727}@alumni.ku.dk,{bjerva,augenstein}@di.ku.dk
Abstract
We take a multi-task learning approach to the shared Task 1 at SemEval-2018. The general idea concerning the model structure is to use as little external data as possible in order to preserve the task relatedness and reduce com-plexity. We employ multi-task learning with hard parameter sharing to exploit the related-ness between sub-tasks. As a base model, we use a standard recurrent neural network for both the classification and regression subtasks. Our system ranks 32nd out of 48 participants with a Pearson score of 0.557 in the first sub-task, and 20th out of 35 in the fifth subtask with an accuracy score of 0.464.
1 Introduction
We consider the task of identifying affect in tweets, as described in Mohammad et al.(2018). Given a tweet, the task is to predict the emo-tions and their corresponding intensities which the tweet portrays. Previous approaches to this task are outlined in Mohammad and Bravo-Marquez
(2017). The winning team of the SemEval EmoInt 2017, presented in Goel et al. (2017), tackled a similar task as the regression task presented in this year’s SemEval Task 1. The winning sys-tem utilised an ensemble approach consisting of 5 sub-models and using a weighted average of these models to come up with the final result. This model is utilising most of the different approaches mentioned in the literature and combining them into one and with great success.
Our work bears resemblance to the runner up in the SemEval EmoInt 2017,K¨oper et al.(2017), who used a comparatively simple model consist-ing of a CNN-LSTM neural network. The differ-ence between the models presented in this paper and the IMS system is the utilisation of lexicons, and that we take a multi-task learning approach.
We focus on two subtasks of this shared task, namely emotion intensity regressionand emotion classification (Sub-tasks 1 and 5). These were chosen because of the overlap in tweets but differ-ing truth labels value and types. Furthermore, we only consider the English versions of the subtasks.
2 System Description
Our system is a standard RNN, with the exception that we approach the task using multi-task learning via hard parameter sharing (Caruana,1993). We will now present the details of our implementation.
2.1 Preprocessing of Text and Textual Representation
We use embedded word representations as input to our system, initialised to the weights from a large set of pre-trained embeddings which have been trained on Twitter data (∼400 million tweets).
These embeddings were obtained from Godin et al.(2015). Words which are out-of-vocabulary are replaced with UNK. Furthermore, user men-tions and numbers get mapped to a place-holder instead of their actual values.
Since the model used both word and character representations, the characters are read in sepa-rately, although the same basic principle is fol-lowed. Every character is represented by an em-bedded representation, which is initialised ran-domly prior to training.
2.2 Augmentation of Data
Since the tweets have different formats of truth labels, one is a singular value (regression) and one is a multi-label list (classification), reading in the labels has to be augmented. Since the tweets are reused in the two tasks, some of the regres-sion tweets can be augmented with their respective classification label, although, if no classification label is present, the truth labels are set to -1, which
Figure 1: The word input part of the full model.
then acts as a mask. Since there are more regres-sion tweets than classification, the augmentation is done this way around. All the tweets are padded differently based on whether or not the tweet is be-ing read as a word representation or character rep-resentation, and tweets longer than the specified padding values are cut down to size.
2.3 Word Input Model
The word input to the model is 60 · 400
dimen-sional vectors that have been passed through the preprocessing and augmentation specified in sec-tion 2.1 and2.2 ((7) in Figure 1). These vectors are then passed into two 250-dimensional, bidirec-tional GRUs which traverse the tweet front to back and vice versa, and the outputs of the two GRU layers are then concatenated ((8) and (9) in Fig-ure1). This output is then batch normalised and dropout is applied ((10) in Figure1). This output of the word submodel is then concatenated later with the character submodel.
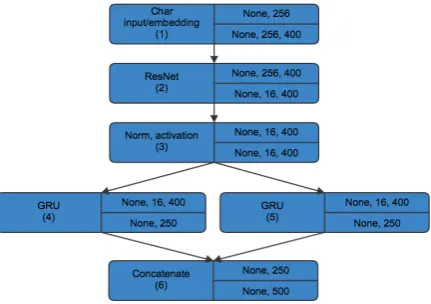
2.4 Character Input Model
The character input to the model is 256·400 di-mensional vectors that have been through the same preprocessing and augmentation as the word in-puts ((1) in Figure 2). These vectors then get passed into a residual neural network which works as a loop of batch normalisations, dropout appli-cations and one-dimensional convolutions ((2) in Figure2). Each loop ends with an addition of the values at the start of the loop and the current result and then a max pooling. These vectors are then passed into two GRU layers similar to the word input ((4) and (5) in Figure2) which are then con-catenated and passed along to be connected with the word input part ((6) in Figure2).
2.5 Full Model
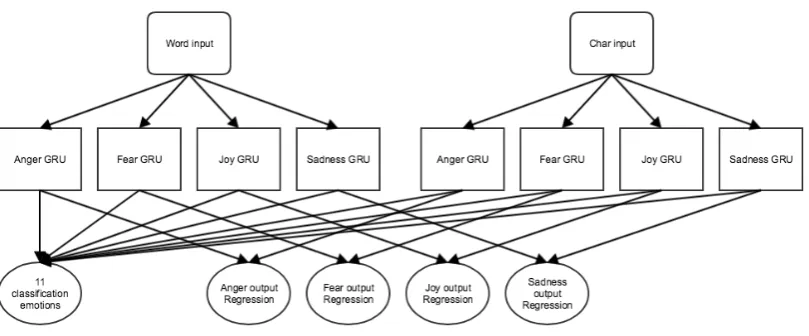
The combined model consists of four submodels, one for each regression emotion. The combined
Figure 2: The character input part of the full model.
embeddings are used to generate classification la-bels. A high level overview can be seen in Fig-ure3.
2.6 Loss Functions
Since the model is a multitask model, more than one loss function was needed. The model solves two tasks which can not share loss functions be-cause of the inherent nature of the problem, one being a regression problem and the other a classi-fication problem.
Regression loss function For the regression output of the model, mean squared error was cho-sen as a way to optimise the model with regards to Pearson-score. Since mean squared error seeks to minimise the difference between the prediction and the gold score, a low mean squared error will bring the Pearson score closer to one.
[image:2.595.75.293.65.156.2]Figure 3: The character input part of the full model.
3 Error Analysis
3.1 Regression Scores
Since there is a considerable overlap in tweets, some tweets are reused in multiple emotions from Task 1 which then in turn can be reused a single time in Task 5. The actual numbers of unique and “duplicate” tweets are hard to resolve and presented a challenge in the first iterations of the model. Gold and predicted scores for an example instance are shown in Table1and 2.
Anger score Fear score Joy score Sadness score Gold : 0.517
Pred : 0.449
Gold : 0.800 Pred : 0.953
Gold : 0.197 Pred : 0.139
Gold : 0.707 Pred : 0.756
Table 1: Good prediction for regression task with the following tweet:
“we need to do something. something must be done!!!!!’ your anxiety is amusing. nothing will be done. despair.”.
Anger score Fear score Joy score Sadness score Gold : 0.953
Pred : 0.620
Gold : 0.621 Pred : 0.346
Gold : —– Pred : 0.430
Gold : 0.680 Pred : 0.326
Table 2: Bad prediction for regression task with the following tweet:
”Don’t fucking tag me in pictures as ’family first’ when you cut me out 5 years ago. You’re no one to me.”.
It is noticeable from the scoring shown in Ta-ble1and 2that keywords such as’familiy’, ’anx-iety’and’fucking’, for example, have a very large effect on the values predicted. These keyword
cor-relations might have been better handled with the use of external data, such as emotive lexicons and the likes.
3.2 Classification Scores
Keeping in mind that the classification labels rep-resent the emotions anger, anticipation, disgust, fear, joy, love, optimism, pessimism, sadness, sur-prise and trust, exemplary classification predic-tions are presented in Table3and Table4.
Predictions Hit percentage Gold : 0 0 1 0 0 0 0 0 1 0 0
Pred : 0 1 1 0 0 0 0 0 0 0 0 82%
Table 3: Scores for classification task with the fol-lowing tweet:
“Not sure tequila shots at my family birthday meal is up there with the best ideas I’ve ever had #grim”.
Predictions Hit percentage Gold : 0 1 0 0 1 1 1 0 0 0 1
Pred : 1 0 1 0 0 0 0 0 0 0 0 36%
Table 4: Bad prediction scores for classification task with the following tweet:
”SheenKL I assume the manga is #good?”.
There are certain structures that are prevalent in the correct and incorrect predictions. When looking at the amount of labels that are set in the datasets, it is evident just from the small amount of
emotions will be harder to predict, since there are so few points of reference. Furthermore, when bothangeranddisgustlabels are present in a tweet the model predicts better. This can be explained by the fact that there are a significant amount of tweets with these two labels.
Average score Anger Fear Joy Sadness Classification 0.551 0.521 0.606 0.538 0.563 0.464
Table 5: Overall scoring of the model, both regres-sion and classification (Task 1 and 5).
Table 5 describes the overall scores from the model run on the test set in the evaluation period of the shared task.
4 Related Work
Multi-task Learning Neural networks make multi-task learning via (hard) parameter sharing particularly easy (Caruana, 1993) and has shown to be successful for a variety of NLP tasks, such as machine translation (Dong et al., 2015; Lu-ong et al., 2016), keyphrase boundary classifi-cation (Augenstein and Søgaard, 2018), tagging (Mart´ınez Alonso and Plank, 2017;Bjerva et al.,
2016), complex word identification (Bingel and Bjerva,2018), and natural language understanding (Augenstein et al.,2017). For sequence labelling, many combinations of tasks have been explored, e.g., byMart´ınez Alonso and Plank(2017);Bjerva
(2017a,b). An analysis of different task com-binations was performed by Søgaard and Gold-berg (2016); Bingel and Søgaard (2017). Ruder et al.(2017) presented a more flexible architecture, which learned what to share between the main and auxiliary tasks, and might require further investi-gation in future work. Augenstein et al. (2017) combine multi-task learning with semi-supervised learning for strongly related tasks with different output spaces. For this shared task, we opt for a simple hard parameter sharing strategy, though we would expect to see improvements with more in-volved architectures.
5 Conclusion
In this paper, we present our system for SemEval-2018 Task 1. We employed a simple multi-task architecture with hard parameter sharing to model Subtasks 1 and 5 jointly. The model achieved an average performance compared to the rest of the
participants. We argue this is due to our not using external data or performing extensive additional engineering.
Acknowledgments
Isabelle Augenstein is supported by Eurostars grant Number E10138. We further gratefully ac-knowledge the support of NVIDIA Corporation with the donation of the Titan Xp GPU used for this research.
References
Isabelle Augenstein, Sebastian Ruder, and Anders Søgaard. 2017. Multi-task learning of keyphrase boundary detection. InProceedings of ACL. Isabelle Augenstein and Anders Søgaard. 2018.
Multi-task learning of pairwise sequence classification tasks over disparate label spaces. InProceedings of NAACL, to appear.
Joachim Bingel and Johannes Bjerva. 2018. Cross-lingual complex word identification with multitask learning. InProceedings of Shared Task on CWI at BEA18.
Joachim Bingel and Anders Søgaard. 2017. Identify-ing beneficial task relations for multi-task learnIdentify-ing in deep neural networks. InEACL. pages 164–169. Johannes Bjerva. 2017a. One Model to Rule them all
– Multitask and Multilingual Modelling for Lexical Analysis. Ph.D. thesis, University of Groningen. Johannes Bjerva. 2017b. Will my auxiliary tagging
task help? Estimating Auxiliary Tasks Effectivity in Multi-Task Learning. InProceedings of NoDaLiDa. Link¨oping University Electronic Press, 131, pages 216–220.
Johannes Bjerva, Barbara Plank, and Johan Bos. 2016. Semantic tagging with deep residual networks. In Proceedings of COLING 2016. pages 3531–3541. Richard A Caruana. 1993. Multitask connectionist
learning. InIn Proceedings of the 1993 Connection-ist Models Summer School.
Daxiang Dong, Hua Wu, Wei He, Dianhai Yu, and Haifeng Wang. 2015. Multi-Task Learning for Mul-tiple Language Translation. InProceedings of ACL. Fr´ederic Godin, Baptist Vandersmissen, Wesley De Neve, and Rik Van de Walle. 2015. Multimedia Lab @ ACL W-NUT NER Shared Task: Named En-tity Recognition for Twitter Microposts using Dis-tributed Word Representations .
Maximilian K¨oper, Evgeny Kim, and Roman Klinger. 2017. Ims at emoint-2017: Emotion intensity pre-diction with affective norms, automatically extended resources and deep learning .
Minh-Thang Luong, Quoc V. Le, Ilya Sutskever, Oriol Vinyals, and Lukasz Kaiser. 2016. Multi-task Se-quence to SeSe-quence Learning. In Proceedings of ICLR.
H´ector Mart´ınez Alonso and Barbara Plank. 2017. When is multitask learning effective? Semantic se-quence prediction under varying data conditions. In EACL. pages 44–53.
Saif M. Mohammad and Felipe Bravo-Marquez. 2017. Wassa-2017 shared task on emotion intensity . Saif M. Mohammad, Felipe Bravo-Marquez,
Mo-hammad Salameh, and Svetlana Kiritchenko. 2018. Semeval-2018 Task 1: Affect in tweets. In Proceed-ings of International Workshop on Semantic Evalu-ation (SemEval-2018). New Orleans, LA, USA. Sebastian Ruder, Joachim Bingel, Isabelle Augenstein,
and Anders Søgaard. 2017. Sluice networks: Learn-ing what to share between loosely related tasks. arXiv preprint arXiv:1705.08142.