Discovery and validation of potential drug targets
based on the phylogenetic evolution of GPCRs
Jie Yang
*, Sen Li, Tongyang Zhu, Xiaoning Wang, Zhen Zhang
State Key Laboratory of Pharmaceutical Biotechnology, College of Life Sciences, Nanjing University, Nanjing, China;
*Corresponding Author:
Received 8 October 2012; revised 10 November 2012; accepted 23 November 2012
ABSTRACT
Target identification is a critical step following
the discovery of small molecules that elicit a
biological phenotype. G-protein coupled recap-
tors (GPCRs) are among the most important
drug targets for the pharmaceutical industry.
The present work seeks to provide an in silico
model of known GPCR protein fishing tech-
nologies in order to rapidly fish out potential
drug targets on the basis of amino acid se-
quences and seven transmembrane regions
(TMs) of GPCRs. Some scoring matrices were
trained on 22 groups of GPCRs in the GPCRDB
database. These models were employed to pre-
dict the GPCR proteins in two groups of test
sets. On average, the mean correct rate of each
TM of 38 GPCRs from two test sets (
and
)
was found 62% and 57.5%, respectively, using
training set 18 (
); the mean hit rate of each
TM of 38 GPCRs from
and
S
24was found
68.1% and 64.7%, respectively. Based on the
scoring matrices of PreMod, the mean correct
rate of each TM of GPCRs from
and
was found 62% and 62.04%, respectively; the
mean hit rate of each TM of GPCRs from
and
was found 67.7% and 68.0%, respec-
tively. The means of GPCRs in
based on
is close to those based on PreMod; whereas
the means of GPCRs in
24based on
S
D18is
less than those based on PreMod. Moreover, the
accuracy (“2”) and validity (“2 + 1”) rates of
prediction all seven TMs of 38 GPCRs by the
scoring matrices of PreMod are more than those
by
,
T
S
23 T TS
23 TS
23 TS
24 TS
24 TS
23 L L DS
18 TS
23S
TS
24 L DS
18 L DS
18 T L AS
14and
L A
S
3; whereas the hit rates
(94.74% and 97.37%) by PreMod are less than
those of
S
LA3but bigger than those of
S
18and
L D L
A
S
14, respectively. This is the reason that we
choose PreMod to predict some potential drug
targets. 22 GPCR proteins in the sense chain of
chromosome 19 constructing validation set were
predicted and validated by PreMod whose hit
rate is up to 90.91%. Further evaluation is under
investigation.
Keywords:
Pharmaceutical Targets for Drug
Development; G-Protein Coupled Receptors;
Scoring Matrices; Hit Rates
1. INTRODUCTION
triphosphatases) that cycle between a GDP-bound form
and a GTP-bound form [5]. The GTP-bound G protein is
an active form that interacts with downstream effectors
and transmits signals, during which the bound GTP is
often hydrolyzed to GDP and the G protein recycles
into the inactive GDP-bound form [5]. The hetero-
trimeric G protein complex comprises a G
α
subunit, of
which there are 4 main families (G
α
s, G
α
i/o, G
α
q/11,
and G
α
12/13), coupled to a combination of G
β
and G
γ
subunits, of which there exist 6 and 12 members, respect-
tively [2,4]. G
α
subunit binds to guanine nucleotides
while G
βγ
subunits cannot be dissociated under nonde-
naturing conditions. The activity of G proteins is regu-
lated mainly through three classes of regulatory proteins:
GTPase-activating proteins (GAPs), guanine nucleotide-
exchange factors (GEFs), and guanine nucleotide-disso-
ciation inhibitors (GDIs) [6]. Upon activation, the GTP-
bound G
α
subunit dissociates from G
βγ
subunits, and
serves as the major signaling messenger by interacting
with its signal acceptors (downstream effectors) [2].
Mammalian GPCRs constitute a superfamily of di-
verse proteins with hundreds of members [7,8]. GPCRs
can be grouped into 6 classes based on sequence homol-
ogy and functional similarity [9,10]: Class A (Rhodop-
sin-like receptors) [11], Class B (Secretin receptor family)
[12], Class C (Metabotropic glutamate/pheromone re-
ceptors) [13], Class D (Fungal mating pheromone recap-
tors) [14], Class E (Cyclic AMP receptors) [15], and
Class F (Frizzled/Smoothened, F/S) [16,17]. GPCRs act
as receptors for a multitude of different signals [8]. One
major group, referred to as chemosensory GPCRs (cs-
GPCRs), is receptors for sensory signals of external
ori-gin that are sensed as odors [18,19], pheromones, or
tastes [20]. Most other GPCRs respond to endogenous
signals, such as peptides, lipids, neurotransmitters, or
nucleotides [21,22]. These GPCRs are involved in nu-
merous physiological processes, including the regulation
of neuronal excitability, metabolism, reproduction, de-
velopment, hormonal homeostasis, and behavior [8]. A
characteristic feature of GPCRs differentially expressed
in many cell types in the body, together with their struc-
tural diversity, has proved important in medicinal chem-
istry. GPCRs are involved in many diseases, and are also
the target of around half of all modern medicinal drugs
[23]. Of all currently marketed drugs, >30% are modula-
tors of specific GPCRs [24]. However, only 10% of
GPCRs are targeted by these drugs, emphasizing the po-
tential of the remaining 90% of the GPCR superfamily
for the treatment of human disease [8].
Additionally, Celera’s initial analysis of the human
genome found 616 GPCRs [25] and Takeda et al. [26]
found 178 intronless nonchemosensory GPCRs, whereas
the International Human Genome Sequencing Consor-
tium reported a total of 569 “rhodopsin-like” (i.e., Class
A) GPCRs [27]. Vassilatis DK and co-worker conducted
a comprehensive analysis and reported that the repertoire
of GPCRs for endogenous ligands consists of 367 recep-
tors in humans and 392 in mice. Included here are 26
human and 83 mouse GPCRs not previously identified
[8]. Phylogenetic analyses cluster 60% of GPCRs ac-
cording to ligand preference, allowing prediction of
ligand types for dozens of orphan receptors. Expression
profiling of 100 GPCRs demonstrates that most are ex-
pressed in multiple tissues and that individual tissues
express multiple GPCRs. Over 90% of GPCRs are ex-
pressed in the brain. Strikingly, however, the profiles of
most GPCRs are unique, yielding thousands of tissue-
and cell-specific receptor combinations for the modula-
tion of physiological processes.
Moreover, diverse members of GPCR superfamily
participate in a variety of physiological functions and are
major targets of pharmaceutical drugs. GPCRs are one of
the most important target classes in pharmacology and
are the target of many blockbuster drugs [28]. The pre-
sumably
α
-helical transmembrane regions (TMs) of
GPCRs are probably arranged with similarity to bacteri-
orhodopsin (brh) [29]. Except for low-resolution electron
diffraction [30,31] and high resolution X ray-based crys-
tallography [32]
of brh, the first crystal structure of a
mammalian GPCR, bovine rhodopsin [33], was solved.
In 2007, the first structure of a human GPCR,
β
2-ad-
renergic receptor, was solved [34,35]. In particular, GPCRs
are of enormous importance for the pharmaceutical
in-dustry because 52% of all existing medicines act on a
GPCR [36]. Very well-known therapeutic drugs such as
β
-blockers and anti-histamines act on GPCRs. This
ex-plains why so many three-dimensional models of GPCRs
have been built. Early structural models, such as HIV-1
co-receptor CCR5 (chemokine receptors) [37,38], and
human thromboxane receptor [39], are based on the
atomic coordinates of the brh structure; some models, e.g.
human ADP receptor (Purinergic Receptor P2Y12) [40],
are constructed by homology modeling using bovine
rhodopsin as a template. All of these modeling studies
combined with bioinformatics and chemoinformatics
become amenable to the rational design of novel drugs
targeting GPCRs in the human genome [28].
These models would contribute to a better under-
standing of the structure and the function of GPCRs, as
well as the ligand-receptor interaction. The present study
is devoted to use bioinformatics and computational mod-
eling to build up GPCRs’ theoretical modeling and fold-
ing fashions, for prediction of unknown GPCRs in the
human genome and studying the interaction between
GPCRs ant their ligands at the molecular level.
2. MATERIALS AND METHODS
were taken from a new release of the GPCRDB v.7.6
(
http://www.gpcr.org/7tm
/
htmls/entries.html
) based on
the latest UniProtKB (Universal Protein Knowledgebase)
release of 15-May-2006 (
http://www.ebi.ac.uk/swissprot/
;
http://au.expasy.org/
), which contain approximately 764
proteins. Their GPCR family profiles are updated. Their
amino acid sequences were from Genbank (
http://www
.
ncbi.nlm.nih.gov/Genbank/index.html
) and SWISSPROT.
The secondary structure of protein residues corresponds to
the DSSP method and their seven TMs were determined
based on the GPCR superfamily.
2.1. Data Partitioning
The transmembrane domain regions of 764 known
GPCRs were each used as a query I TBLASTEN
searches of the National Center for Biotechnology In-
formation human genome database. Sequences were re-
trieved from the National Center for Biotechnology In-
formation with the accession numbers (Appendix 1).
GPCR Class A, B, and C Hidden Markov Model models
were also used as queries to search the International Pro-
tein Index proteome database [8]. Grouping of the sam-
ples was based on the phylogenetic analysis results of
Vassilatis and co-worker. Data sets were partitioned into
three sets: Training, test, and validation sets. Although
protein prediction methodology is almost always re-
ported in terms of training and test sets only, we withheld
an external validation set in order to provide an addi-
tional rigorous check on model quality. We feel this is
necessary since a high statistical correlation on the train-
ing and test sets does not necessarily indicate a highly
predictive model [41]. To properly partition our data sets
so that they each reflect the makeup of the original data
set as much as possible, we take into account the distri-
bution of both feature diversity and biological activity as
we form our training, test, and external validation sets. In
this way, we maintain the original proportions of cate-
gorical bins and structural diversity in each of the three
sets.
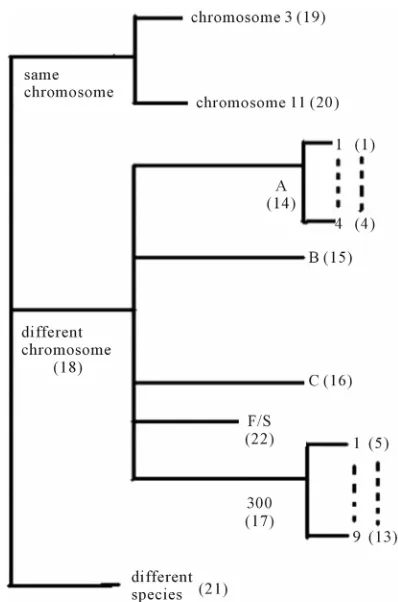
Training dataset is composed of 22 groups in three
types of GPCRs (
Figure 1
) as follows: GPCRs from
human different chromosomes (
S
DCL), from human same
chromosomes (
S
SCL) (such as chromosome 3 and 11),
and from different species, based on the phylogenetic
trees [8]. The first contains five classes: Class A (
S
AL), B
(
S
BL), C (
L C
S
), F/S (
S
FL), and other (
L OS
). Class A con-
sists of four groups: Group 1 (
1L A
S
), Group 2 (
2L A
S
),
Group 3 (
3L A
S
) and Group 4 (
4L A
S
), which is abstracted
into Group 14 (
14L
S
L AS
15
A
). Class B, C, and F/S each
contain one group (
S
BL,
16L C
S
, and
22L F
S
,
S
L). The others
fall into nine groups
O13, which forms
one group 17
,
,
5 6
L L
O O
S
S
17 L
S
L
L O
O18
[image:3.595.322.521.82.383.2]S
. The first is also extracted
into one group 18
S
D
S
DCL
. The second consists of
Figure 1.
The grouping frame of the different training
datasets.
two groups: chromosome 3 (group 19,
19L S
S
) and chro-
mosome 11 (group 20,
20L S
S
). The third only includes
one group 21 (
21L D
S
), consisting of Bovine, Danre, Drome,
Chick, Anoga, Dicla, Eisfo, Equas, Eulfu, Pantr, Halsh,
besides human, consisting of 3, 2, 3, 3, 1, 1, 1, 1, 1, 1, 1,
and 2 GPCRs, respectively. All above 22 groups make
up of the training dataset (learning dataset,
S
L).
The following test datasets
S
Tcontains two groups
of GPCRs, group 23 from human (38 GPCRs,
23) and
group 24
T
S
24 TS
from different species, consisting of 3
bovine, 3 canfa, 3 drome, 3 chick, 3 mouse, 1 Arath, 1
macmu, 1 Mesbi, and 1 Micoh GPCRs, respectively,
besides 19 human GPCRs (Appendix 1). Here,
1 2 3 4
L L L L
A A A A
S
S
S
S
,
1 2 3 4
L L L L
A A A A
S
S
S
S
S
L A,
14
L L A A
S
S
,
5 6 13,
L L L
O O O
S
S
S
17
L L O O
S
S
,
5 6 13L L L
O O O
S
S
S
S
LO
,
14 15 16 17 22
L L L L L
A B C O F
S
S
S
S
S
,
and
18 19 20 21
L L L L
D S S D
S
S
S
S
.
2.2. Sequence Analysis of GPCRs using
Bioinformatics
2.2.1. The Scoring Matrices of Training Sets
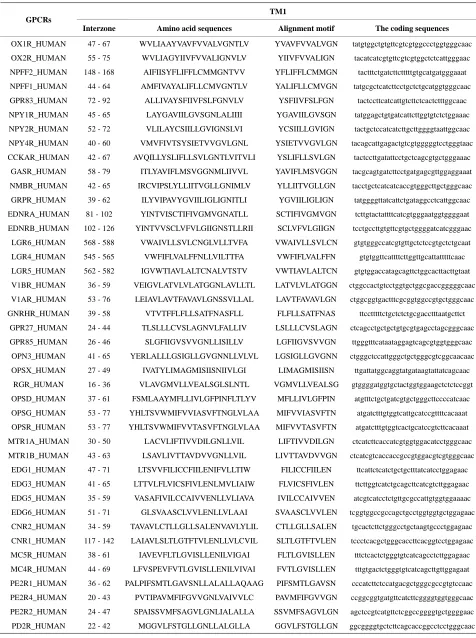
Take Group 1 of Class A for an example. In order to
represent the GPCRs’ TM patterns, a representative non-
redundant set of high resolution GPCRs’ TMs are chosen
as previously reported to build a training set (
Tables 1
and
2
). The most consistent sequences are picked up to
constitute a scoring matrix by alignment that would be
used to predict the TM regions. The amino acid se-
quences of the seven TMs of GPCRs were extracted and
aligned using ClustalW; the TM regions cluster in one
fragment (motif) which are about 12, 11, 13, 14, 10, 10,
and 12 amino acid residues for TM1-TM7 of the Group 1
(
Table 2
), respectively; and then their coding regions of
such amino acid fragments were chosen to constitute the
scoring matrix, which contains 4 types of nucleotides
(
Figure 2
).
Take TM1 of GPCRs in Group 1 of Class A for an
example. There are 42 GPCR proteins consisting of the
training set after alignment (
Table 1
).
Figure 2
means
the scoring matrix, which was generated by assigning a
value of the stimulatory potential to each of the 4 defined
nucleotides in each position of
Table 1
. Based on the
matrix, we designed a simple algorithm to evaluate the
relationship significance of any sequence to the GPCRs’
TM patterns. To each nucleotide
(A, T, G, and C)
from those 42 proteins
n
i
1, 2,
of TM1 of group 1 (
Table 2
),
the symbol
stands for how many times it takes place
in each position
, which was cal-
tij
3,
,12
j j
42
3
culated as follows:
. The score
S
of
i 1
tij
nij
ij
this nucleotide denotes the proportional (weighting) it
takes place in each position
j
, which was calculated as
follows:
4 12 3 42
1 1 1
S
t
n j i
ij
ij
nij
. Take the adenosine
(A) for example. Based on the
Table 1
, the times of
adenosine is
at the position of
respect-
tively, and the sum of four nucleotides in the training set
is 1512
. So, the scores
5,12,
,
42
1512
1, 2,
,
36
A
1, 2,
Sij
of
adenosine is
at the position of
respectively, whereas it is 0 at other position because it
does not appear (
Figure 2
). The rest (Thymine, Cytidine,
and Guanosine) may be deduced by analogy. The value
of the scoring matrix is 1.
0.003, 0.008,
,
2.2.2. Test Sets
According to the set theory of mathematics [42], the
GPCRs chosen above consist of different training sets
L A
S
,
S
BL,
S
CL,
S
FL,
S
OL, etc, which composed a union
L L LA B C
S
S
S
S
Therefore, the test set
S
T(
Table 3
) comes from the
complement of
S
Lfor GPCRs aggregate (Appendix 1).
According to our previous methods [40,43], we de-
fined the coding sequence (CDS) of GPCRs’ each TM as
TM-CDS unit composed of
nucleotides. At first, the
TM-CDS units are obtained using the sliding window
method one by one from 5’-terminal of GPCRs’ CDS to
3’-teminal:
A sequence of
l
nucleotides gives rise to
m
1
l m
TM-CDS units. For example, the coding se-
quences of TM1 of GPCRs in group 1 are 12 × 3 nucleo-
tides, namely
m
36
.
2.2.3. Validation Set
Similarly, we calculate the total scores of the coding
sequences of 22 GPCRs located at the sense chain of
chromosome 19 using the sliding window method.
2.2.4. Assessment of Model Quality
In this study, training model quality is simply the per-
cent correct classification (binning) of GPCRs’ TM seg-
ments for the test set [41]. The overall predictive power
of a given model is the percent correct classification for
the test set (%test) and for the external validation set
(%validation), where the external validation set repre-
sents native holdout data. More extensive model assess-
ment was accomplished by a “dynamic partitioning” pro-
cedure, which provides a no error rate of the test and
external validation sets.
2.2.5. Statistics
Data are expressed as mean±standard deviation (S.D.)
through this paper. Statistical analyses were performed
with F-test by one
-
way
analysis of variance (abbreviated
one
-
way ANOVA) and by t-test between the means of
two groups of the samples. Data was considered signifi-
cant for
P
0.01
at 95 confidence limit [44]. Tests for
normality were performed with Shapiro-Wilk test be-
cause of the number of samples less than 2000 [45]. The
normality of the data was tested by the Shapiro-Wilk
statistic. All statistical testing was conducted at signifi-
cance level 0.10 and all confidence intervals had confi-
dence level 0.90 unless otherwise noted. All tests and
confidence intervals were two-sided. Confidence inter-
vals for normal data were constructed from analysis of
covariance models [45]. Here,
α
= 0.10 requests 90%
confidence limits. The default value is 0.05. One way-
ANOVA, Test of Homogeneity of Variances and Multi-
ple comparisons (LSD and Tamhane’s T2), and tests for
normality were performed using SPSS version 11.5 soft-
ware.
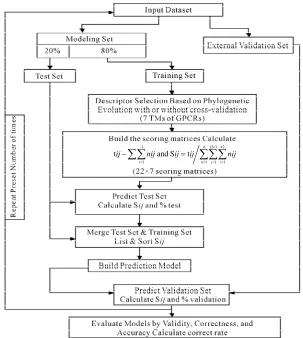
2.2.6. The Prediction Model Algorithm
In general, our prediction model (PreMod) method
employs the scoring matrices combined with descriptor
L
Table 1.
TM1 sequence alignment of GPCRs in group 1 of class A by clustal W.
TM1 GPCRs
Interzone Amino acid sequences Alignment motif The coding sequences
OX1R_HUMAN 47 - 67 WVLIAAYVAVFVVALVGNTLV YVAVFVVALVGN tatgtggctgtgttcgtcgtggccctggtgggcaac
OX2R_HUMAN 55 - 75 WVLIAGYIIVFVVALIGNVLV YIIVFVVALIGN tacatcatcgtgttcgtcgtggctctcattgggaac
NPFF2_HUMAN 148 - 168 AIFIISYFLIFFLCMMGNTVV YFLIFFLCMMGN tactttctgatcttctttttgtgcatgatgggaaat
NPFF1_HUMAN 44 - 64 AMFIVAYALIFLLCMVGNTLV YALIFLLCMVGN tatgcgctcatcttcctgctctgcatggtgggcaac
GPR83_HUMAN 72 - 92 ALLIVAYSFIIVFSLFGNVLV YSFIIVFSLFGN tactccttcatcattgtcttctcactctttggcaac
NPY1R_HUMAN 45 - 65 LAYGAVIILGVSGNLALIIII YGAVIILGVSGN tatggagctgtgatcattcttggtgtctctggaaac
NPY2R_HUMAN 52 - 72 VLILAYCSIILLGVIGNSLVI YCSIILLGVIGN tactgctccatcatcttgcttggggtaattggcaac
NPY4R_HUMAN 40 - 60 VMVFIVTSYSIETVVGVLGNL YSIETVVGVLGN tacagcattgagactgtcgtgggggtcctgggtaac
CCKAR_HUMAN 42 - 67 AVQILLYSLIFLLSVLGNTLVITVLI YSLIFLLSVLGN tactccttgatattcctgctcagcgtgctgggaaac
GASR_HUMAN 58 - 79 ITLYAVIFLMSVGGNMLIIVVL YAVIFLMSVGGN tacgcagtgatcttcctgatgagcgttggaggaaat
NMBR_HUMAN 42 - 65 IRCVIPSLYLLIITVGLLGNIMLV YLLIITVGLLGN tacctgctcatcatcaccgtgggcttgctgggcaac
GRPR_HUMAN 39 - 62 ILYVIPAVYGVIILIGLIGNITLI YGVIILIGLIGN tatggggttatcattctgataggcctcattggcaac
EDNRA_HUMAN 81 - 102 YINTVISCTIFIVGMVGNATLL SCTIFIVGMVGN tcttgtactattttcatcgtgggaatggtggggaat
EDNRB_HUMAN 102 - 126 YINTVVSCLVFVLGIIGNSTLLRII SCLVFVLGIIGN tcctgccttgtgttcgtgctggggatcatcgggaac
LGR6_HUMAN 568 - 588 VWAIVLLSVLCNGLVLLTVFA VWAIVLLSVLCN gtgtgggccatcgtgttgctctccgtgctctgcaat
LGR4_HUMAN 545 - 565 VWFIFLVALFFNLLVILTTFA VWFIFLVALFFN gtgtggttcattttcttggttgcattatttttcaac
LGR5_HUMAN 562 - 582 IGVWTIAVLALTCNALVTSTV VWTIAVLALTCN gtgtggaccatagcagttctggcacttacttgtaat
V1BR_HUMAN 36 - 59 VEIGVLATVLVLATGGNLAVLLTL LATVLVLATGGN ctggccactgtcctggtgctggcgaccgggggcaac
V1AR_HUMAN 53 - 76 LEIAVLAVTFAVAVLGNSSVLLAL LAVTFAVAVLGN ctggcggtgactttcgcggtggccgtgctgggcaac
GNRHR_HUMAN 39 - 58 VTVTFFLFLLSATFNASFLL FLFLLSATFNAS ttcctttttctgctctctgcgacctttaatgcttct
GPR27_HUMAN 24 - 44 TLSLLLCVSLAGNVLFALLIV LSLLLCVSLAGN ctcagcctgctgctgtgcgtgagcctagcgggcaac
GPR85_HUMAN 26 - 46 SLGFIIGVSVVGNLLISILLV LGFIIGVSVVGN ttgggtttcataataggagtcagcgtggtgggcaac
OPN3_HUMAN 41 - 65 YERLALLLGSIGLLGVGNNLLVLVL LGSIGLLGVGNN ctgggctccattgggctgctgggcgtcggcaacaac
OPSX_HUMAN 27 - 49 IVATYLIMAGMISIISNIIVLGI LIMAGMISIISN ttgattatggcaggtatgataagtattatcagcaac
RGR_HUMAN 16 - 36 VLAVGMVLLVEALSGLSLNTL VGMVLLVEALSG gtggggatggtgctactggtggaagctctctccggt
OPSD_HUMAN 37 - 61 FSMLAAYMFLLIVLGFPINFLTLYV MFLLIVLGFPIN atgtttctgctgatcgtgctgggcttccccatcaac
OPSG_HUMAN 53 - 77 YHLTSVWMIFVVIASVFTNGLVLAA MIFVVIASVFTN atgatctttgtggtcattgcatccgttttcacaaat
OPSR_HUMAN 53 - 77 YHLTSVWMIFVVTASVFTNGLVLAA MIFVVTASVFTN atgatctttgtggtcactgcatccgtcttcacaaat
MTR1A_HUMAN 30 - 50 LACVLIFTIVVDILGNLLVIL LIFTIVVDILGN ctcatcttcaccatcgtggtggacatcctgggcaac
MTR1B_HUMAN 43 - 63 LSAVLIVTTAVDVVGNLLVIL LIVTTAVDVVGN ctcatcgtcaccaccgccgtggacgtcgtgggcaac
EDG1_HUMAN 47 - 71 LTSVVFILICCFIILENIFVLLTIW FILICCFIILEN ttcattctcatctgctgctttatcatcctggagaac
EDG3_HUMAN 41 - 65 LTTVLFLVICSFIVLENLMVLIAIW FLVICSFIVLEN ttcttggtcatctgcagcttcatcgtcttggagaac
EDG5_HUMAN 35 - 59 VASAFIVILCCAIVVENLLVLIAVA IVILCCAIVVEN atcgtcatcctctgttgcgccattgtggtggaaaac
EDG6_HUMAN 51 - 71 GLSVAASCLVVLENLLVLAAI SVAASCLVVLEN tcggtggccgccagctgcctggtggtgctggagaac
CNR2_HUMAN 34 - 59 TAVAVLCTLLGLLSALENVAVLYLIL CTLLGLLSALEN tgcactcttctgggcctgctaagtgccctggagaac
CNR1_HUMAN 117 - 142 LAIAVLSLTLGTFTVLENLLVLCVIL SLTLGTFTVLEN tccctcacgctgggcaccttcacggtcctggagaac
MC5R_HUMAN 38 - 61 IAVEVFLTLGVISLLENILVIGAI FLTLGVISLLEN tttctcactctgggtgtcatcagcctcttggagaac
MC4R_HUMAN 44 - 69 LFVSPEVFVTLGVISLLENILVIVAI FVTLGVISLLEN tttgtgactctgggtgtcatcagcttgttggagaat
PE2R1_HUMAN 36 - 62 PALPIFSMTLGAVSNLLALALLAQAAG PIFSMTLGAVSN cccatcttctccatgacgctgggcgccgtgtccaac
PE2R4_HUMAN 20 - 43 PVTIPAVMFIFGVVGNLVAIVVLC PAVMFIFGVVGN ccggcggtgatgttcatcttcggggtggtgggcaac
PE2R2_HUMAN 24 - 47 SPAISSVMFSAGVLGNLIALALLA SSVMFSAGVLGN agctccgtcatgttctcggccggggtgctggggaac
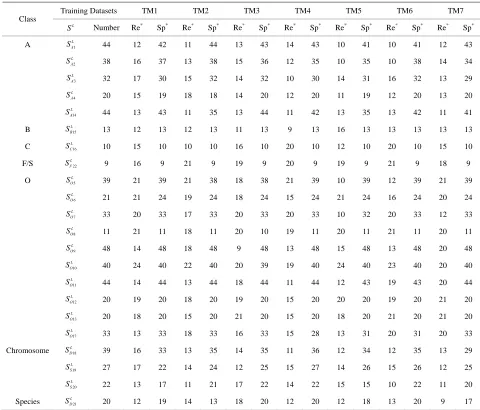
Table 2.
The amino acid sequence length and the sample number of the scoring matrix in the training datasets after sequence align-
ments.
Training Datasets TM1 TM2 TM3 TM4 TM5 TM6 TM7
Class
L
S Number Re* Sp* Re* Sp* Re* Sp* Re* Sp* Re* Sp* Re* Sp* Re* Sp*
A 1
L A
S 44 12 42 11 44 13 43 14 43 10 41 10 41 12 43
2 L A
S 38 16 37 13 38 15 36 12 35 10 35 10 38 14 34
3 L A
S 32 17 30 15 32 14 32 10 30 14 31 16 32 13 29
4 L A
S 20 15 19 18 18 14 20 12 20 11 19 12 20 13 20
14 L A
S 44 13 43 11 35 13 44 11 42 13 35 13 42 11 41
B 15
L B
S 13 12 13 12 13 11 13 9 13 16 13 13 13 13 13
C 16
L C
S 10 15 10 10 10 16 10 20 10 12 10 20 10 15 10
F/S 22
L F
S 9 16 9 21 9 19 9 20 9 19 9 21 9 18 9
O 5
L O
S 39 21 39 21 38 18 38 21 39 10 39 12 39 21 39
6 L O
S 21 21 24 19 24 18 24 15 24 21 24 16 24 20 24
7 L O
S 33 20 33 17 33 20 33 20 33 10 32 20 33 12 33
8 L O
S 11 21 11 18 11 20 10 19 11 20 11 21 11 20 11
9 L O
S 48 14 48 18 48 9 48 13 48 15 48 13 48 20 48
10 L O
S 40 24 40 22 40 20 39 19 40 24 40 23 40 20 40
11 L O
S 44 14 44 13 44 18 44 11 44 12 43 19 43 20 44
12 L O
S 20 19 20 18 20 19 20 15 20 20 20 19 20 21 20
13 L O
S 20 18 20 15 20 21 20 15 20 18 20 21 20 21 20
17 L O
S 33 13 33 18 33 16 33 15 28 13 31 20 31 20 33
Chromosome 18
L D
S 39 16 33 13 35 14 35 11 36 12 34 12 35 13 29
19 L S
S 27 17 22 14 24 12 25 15 27 14 26 15 26 12 25
20 L S
S 22 13 17 11 21 17 22 14 22 15 15 10 22 11 20
Species 21
L D
S 20 12 19 14 13 18 20 12 20 12 18 13 20 9 17
Note: “Number” means the total sample numbers of each training dataset; “Re”, the amino acid residue length of each transmembrane region; “Sp”, the actual sample numbers of each transmembrane region in each training dataset.
selection procedures (seven TMs) that seek to find the
optimal subset of the scoring matrices from the original
scoring matrix manifold. Partitioning data sets into
training, test, and external validation sets rigorously as-
sesses model quality. We extend this methodology by
implementation of the dynamic repeating assessment. A
flowchart of the prediction model algorithm is provided
in
Figure 3
, which involves the following steps. 1) Di-
vide each data set into two parts: One used to build mod-
els, the other to validate models (external validation set);
in our implementation, the external validation set is se-
lected to have a high level of diversity; 2) Further parti-
tion the 80% identified for model building to form two
more sets: Training (80%) and test (20%) sets; 3) Select
seven TMs of GPCRs as descriptors based on phyloge-
netic evolution of the training set with or without cross-
validation procedure (described above); 4) Calculate the
score
of the training set to construct an optimized
subset of the scoring matrix based on the CDS of
GPCRs’ 7 TMs; 5) Predict the test set target values using
the scoring matrix and calculate the percent correct clas-
sification of the test set (%test); 6) Merge the training
and test sets, and build a new prediction model using
statistic analyses; 7) Predict external validation set values
using the prediction model (PreMod), and calculate the
percent correct classification of the external validation
set (%validation); 8) Repeat steps 1-8 a preset number of
times (22 times); 9) Assess each model by the accuracy
described above, and generate test and external
valida-ion veracity.
Sij
1 2 3 4 5 6 7 8 9 10 11 12 13 14 15 16 17 18 19 20 21
A 0.003 0.008 0 0.007 0 0.001 0.007 0 0 0.014 0.001 0.003 0.008 0 0.002 0.007 0 0.001 0.004 0 0.003
T 0.016 0.014 0.005 0.008 0.013 0.005 0.007 0.02 0.009 0.001 0.023 0.003 0.011 0.019 0.005 0.007 0.018 0.004 0.004 0.024 0.003
C 0.005 0.004 0.014 0.003 0.006 0.012 0.005 0.008 0.012 0.006 0.004 0.011 0.003 0.002 0.018 0.005 0.005 0.011 0.009 0.004 0.009
G 0.003 0.002 0.009 0.01 0.009 0.009 0.008 0 0.007 0.007 0 0.011 0.007 0.007 0.003 0.009 0.005 0.012 0.011 0 0.013
22 23 24 25 26 27 28 29 30 31 32 33 34 35 36
A 0.009 0.002 0.003 0.005 0 0.002 0.005 0.001 0.001 0.003 0.006 0.005 0.026 0.026 0
T 0.004 0.003 0.003 0.003 0.025 0.004 0.005 0.022 0.005 0.003 0.001 0.002 0.001 0 0.007
C 0 0.008 0.016 0.005 0.003 0.013 0.009 0.003 0.005 0 0.003 0.014 0 0.001 0.021
G 0.015 0.015 0.005 0.014 0 0.009 0.008 0.002 0.017 0.021 0.017 0.007 0.001 0.001 0
1 2 3 4 5 6 7 8 9 10 11 12 13 14 15 16 17 18 19 20 21
A 0.003 0 0.003 0.003 0 0.005 0.001 0 0.002 0.008 0.001 0.007 0.003 0.03 0 0.006 0 0.004 0.003 0 0.003
T 0.005 0.03 0.004 0.005 0.002 0.009 0.006 0.024 0.004 0.005 0.001 0.01 0 0 0.006 0.005 0.028 0.003 0.006 0.024 0.001
C 0.022 0 0.004 0.001 0.025 0.01 0.008 0.003 0.012 0.001 0.021 0.01 0.001 0.001 0.024 0.018 0.001 0.006 0.015 0.004 0.008
G 0 0 0.019 0.021 0.003 0.006 0.016 0.003 0.012 0.017 0.008 0.003 0.027 0 0.001 0.002 0.002 0.018 0.007 0.002 0.019
22 23 24 25 26 27 28 29 30 31 32 33
A 0.007 0.003 0.002 0.012 0.002 0.005 0.009 0.001 0.004 0.011 0.003 0.001
T 0.001 0.017 0.003 0.003 0.004 0.005 0.004 0.025 0.004 0.01 0.017 0.009
C 0.004 0.006 0.009 0.002 0.012 0.015 0.006 0.003 0.015 0.003 0.01 0.017
G 0.019 0.005 0.016 0.014 0.012 0.004 0.011 0.002 0.007 0.006 0.001 0.003
1 2 3 4 5 6 7 8 9 10 11 12 13 14 15 16 17 18 19 20 21
A 0.007 0.002 0.002 0.007 0 0.001 0.003 0 0.002 0.004 0 0.003 0.007 0.005 0.006 0.004 0.001 0.007 0.004 0 0.003
T 0.008 0.011 0.008 0.008 0.02 0.004 0.018 0.005 0.007 0.005 0.016 0.002 0.007 0.01 0.007 0.002 0.009 0.004 0.017 0 0.007
C 0.002 0.006 0.013 0.007 0.004 0.012 0 0.016 0.014 0.003 0.002 0.007 0.004 0.007 0.005 0.001 0.013 0.011 0.001 0.023 0.013
G 0.009 0.007 0.004 0.005 0.001 0.01 0.005 0.005 0.003 0.014 0.007 0.013 0.008 0.005 0.008 0.018 0.003 0.004 0.004 0.003 0.003
22 23 24 25 26 27 28 29 30 31 32 33 34 35 36 37 38 39
A 0.01 0 0.003 0.002 0.001 0.002 0.018 0.003 0.004 0.003 0 0.004 0.009 0 0.003 0.001 0 0.002
T 0 0.018 0.005 0.015 0.018 0.002 0.004 0.008 0.005 0.004 0.025 0.001 0.004 0.014 0.006 0.004 0.011 0.003
C 0.004 0.007 0.01 0.007 0.001 0.016 0.004 0.009 0.009 0.018 0 0.011 0.006 0.008 0.008 0.004 0.012 0.017
G 0.013 0 0.007 0.002 0.006 0.005 0 0.006 0.007 0.001 0.001 0.01 0.007 0.004 0.008 0.017 0.003 0.004
1 2 3 4 5 6 7 8 9 10 11 12 13 14 15 16 17 18 19 20 21
A 0.014 0 0.001 0.004 0 0.002 0.003 0.001 0.001 0.013 0 0.001 0.001 0.001 0 0.006 0 0.003 0.006 0.002 0.002
T 0.001 0.022 0.008 0.003 0.009 0.007 0.006 0.013 0.003 0.004 0.015 0.003 0.022 0.002 0.002 0.001 0.015 0.003 0.004 0.018 0.006
C 0.004 0.002 0.011 0.004 0.009 0.01 0.004 0.006 0.015 0.001 0.006 0.016 0.001 0.001 0.002 0.006 0.008 0.012 0.009 0.002 0.007
G 0.005 0 0.004 0.012 0.006 0.006 0.011 0.004 0.004 0.006 0.003 0.004 0.001 0.02 0.02 0.012 0.001 0.006 0.005 0.002 0.009
22 23 24 25 26 27 28 29 30 31 32 33 34 35 36 37 38 39 40 41 42
A 0.002 0.001 0.002 0.004 0.001 0.002 0.005 0 0.003 0.004 0.001 0.002 0.007 0 0.004 0.005 0.001 0.002 0.002 0 0.003
T 0.011 0 0.006 0.006 0.015 0.004 0.003 0.016 0.003 0.009 0.015 0.002 0.004 0.005 0.003 0.006 0.013 0.007 0.001 0.011 0.004
C 0.001 0.02 0.013 0.007 0.006 0.004 0.004 0.007 0.011 0.006 0.004 0.009 0 0.012 0.012 0.003 0.008 0.007 0.019 0.013 0.006
G 0.011 0.003 0.003 0.008 0.002 0.014 0.011 0.001 0.007 0.004 0.004 0.011 0.013 0.007 0.005 0.009 0.003 0.008 0.002 0.001 0.011
1 2 3 4 5 6 7 8 9 10 11 12 13 14 15 16 17 18 19 20 21
A 0.002 0.008 0.001 0.01 0.001 0.001 0.013 0.002 0.002 0.004 0 0.011 0.003 0 0.002 0.007 0 0.002 0.013 0.003 0.001
T 0.024 0.022 0.004 0.011 0.023 0.005 0.002 0.02 0.005 0.002 0.008 0.004 0.004 0.028 0.006 0.01 0.013 0.009 0.007 0.024 0.004
C 0.005 0.001 0.025 0.007 0.007 0.018 0.005 0.009 0.017 0.023 0.024 0.014 0.022 0.003 0.011 0.003 0.011 0.015 0.007 0.005 0.024
G 0.002 0.002 0.003 0.006 0.003 0.01 0.013 0.002 0.009 0.004 0.002 0.005 0.004 0.002 0.015 0.013 0.009 0.007 0.007 0.001 0.004
22 23 24 25 26 27 28 29 30
A 0.024 0 0.004 0.007 0 0.002 0.009 0.004 0
T 0.002 0.03 0.004 0.007 0.024 0.007 0.011 0.025 0.01
C 0.005 0.003 0.014 0.003 0.008 0.01 0.002 0.003 0.015
1 2 3 4 5 6 7 8 9 10 11 12 13 14 15 16 17 18 19 20 21
A 0.002 0.003 0 0.008 0 0.004 0.009 0.002 0.001 0.001 0 0.002 0 0.002 0 0.005 0 0.004 0 0 0.008
T 0.028 0.029 0.014 0.005 0.019 0.004 0.005 0.028 0.004 0.029 0.002 0.004 0.031 0 0.002 0.007 0.02 0.005 0 0 0.01
C 0.002 0.001 0.017 0.009 0.012 0.019 0.007 0.003 0.023 0.002 0.003 0.027 0.002 0.004 0.003 0.008 0.007 0.011 0.031 0.033 0.011
G 0.002 0 0.002 0.011 0.002 0.007 0.012 0 0.006 0.002 0.028 0.001 0 0.028 0.028 0.014 0.006 0.013 0.002 0 0.004
22 23 24 25 26 27 28 29 30
A 0.006 0.008 0 0.007 0.008 0.001 0.012 0 0.003
T 0.013 0.024 0.01 0.013 0.016 0.007 0.007 0.02 0.004
C 0.012 0.001 0.019 0.009 0.006 0.02 0.002 0.006 0.019
G 0.002 0 0.005 0.004 0.003 0.007 0.012 0.007 0.007
1 2 3 4 5 6 7 8 9 10 11 12 13 14 15 16 17 18 19 20 21
A 0.004 0.001 0.002 0.003 0 0.006 0.01 0.01 0.007 0.008 0 0.002 0.017 0.017 0.001 0.01 0.001 0.005 0.01 0 0.001
T 0.009 0.026 0.01 0.004 0.006 0.006 0.012 0.011 0.005 0.008 0.015 0.005 0.004 0.001 0.009 0.01 0 0.006 0.012 0.01 0.006
C 0.013 0.001 0.003 0.001 0.017 0.014 0.003 0.007 0.01 0.006 0.006 0.012 0.003 0.009 0.016 0.003 0.021 0.016 0.001 0.005 0.016
G 0.002 0 0.012 0.019 0.004 0.002 0.003 0 0.006 0.006 0.006 0.008 0.003 0.001 0.002 0.005 0.006 0.002 0.005 0.014 0.004
22 23 24 25 26 27 28 29 30 31 32 33 34 35 36
A 0.006 0.005 0.002 0.023 0.027 0 0 0 0.005 0.01 0 0.001 0.018 0.001 0.004
T 0.006 0.019 0.004 0 0 0.008 0.001 0 0.005 0.008 0.023 0.007 0.001 0.025 0.008
C 0.005 0.003 0.016 0 0.001 0.019 0.025 0.028 0.017 0.005 0 0.012 0.003 0.003 0.014
[image:8.595.61.537.85.343.2]G 0.01 0.001 0.006 0.005 0 0 0.002 0 0.001 0.006 0.005 0.007 0.006 0 0.003
Figure 2.
The scoring matrices of seven transmembrane regions of GPCRs in Group 1 of the training datasets (TM1-TM7: From top
to bottom).
1 4 12 3 42 1 1 1 1
t and S t
i n j i
ij nij ij ij nij
[image:8.595.146.449.380.718.2]Table 3.
The scores and the validity of prediction each transmembrane region of GPCRs in test sets by the scoring matrices of train-
ing set 18, 14 and 3.
18 L D
S 14
L A
S 3
L A
S
Score Validity*
Score Validity*
Score Validity* GPCRs
TM1 TM2 TM3 TM4 TM5 TM6 TM7 TM1 TM2 TM3 TM4 TM5 TM6 TM7 TM1 TM2 TM3 TM4 TM5 TM6 TM7 TM1 TM2 TM3 TM4 TM5 TM6 TM7 TM1 TM2 TM3 TM4 TM5 TM6 TM7 TM1 TM2 TM3 TM4 TM5 TM6 TM7
Test set 23
Q5VTM0_HUMAN 0.473 0.494 0.386 0.424 0.424 0.437 0.458 1 2 0 2 2 2 2 0.527 0.546 0.427 0.423 0.435 0.457 0.394 1 2 2 2 0 2 2 0.531 0.495 0.462 0.429 0.456 0.435 0.475 1 2 0 0 0 2 2 NPY5R_HUMAN 0.424 0.464 0.362 0.387 0.384 0.426 0.434 2 2 0 2 0 2 2 0.436 0.538 0.371 0.395 0.385 0.467 0.371 2 2 0 2 0 2 0 0.478 0.483 0.398 0.422 0.415 0.443 0.531 1 2 0 2 0 2 2 BRS3_HUMAN 0.398 0.451 0.350 0.391 0.441 0.498 0.415 1 2 0 2 2 2 2 0.465 0.505 0.372 0.462 0.444 0.553 0.419 1 2 0 2 2 2 2 0.475 0.467 0.402 0.489 0.435 0.549 0.490 1 2 0 2 2 2 2 LGR8_HUMAN 0.392 0.418 0.390 0.422 0.405 0.425 0.454 2 0 2 0 0 2 1 0.418 0.462 0.409 0.450 0.419 0.468 0.395 2 0 2 0 2 2 0 0.426 0.423 0.411 0.479 0.437 0.420 0.473 1 0 0 0 2 2 1 GP173_HUMAN 0.391 0.406 0.378 0.406 0.411 0.454 0.454 2 2 2 2 0 2 2 0.456 0.474 0.402 0.455 0.423 0.487 0.431 2 0 0 2 0 2 0 0.427 0.444 0.422 0.470 0.427 0.495 0.506 2 0 1 2 0 2 2 OPSB_HUMAN 0.409 0.461 0.395 0.382 0.484 0.439 0.453 2 2 0 2 2 2 2 0.457 0.510 0.434 0.429 0.500 0.466 0.433 2 2 0 0 2 2 0 0.473 0.472 0.475 0.443 0.524 0.508 0.487 2 2 0 2 2 2 2 EDG8_HUMAN 0.425 0.444 0.399 0.407 0.419 0.468 0.514 0 2 0 0 2 2 2 0.472 0.499 0.451 0.460 0.433 0.491 0.425 0 2 0 2 2 2 2 0.474 0.461 0.430 0.499 0.443 0.467 0.562 0 0 0 2 2 2 2 PF2R_HUMAN 0.386 0.373 0.356 0.363 0.389 0.414 0.383 2 0 0 2 0 0 2 0.442 0.435 0.367 0.393 0.383 0.470 0.369 2 0 0 0 0 1 0 0.437 0.394 0.432 0.458 0.396 0.462 0.409 2 0 0 2 0 2 0 ADA2C_HUMAN 0.458 0.464 0.395 0.437 0.432 0.547 0.539 2 2 0 2 2 2 2 0.555 0.552 0.435 0.486 0.487 0.602 0.469 2 2 0 2 2 2 2 0.514 0.450 0.442 0.472 0.455 0.554 0.602 2 2 0 2 2 2 2 ADRB3_HUMAN 0.407 0.442 0.405 0.401 0.473 0.518 0.505 2 2 2 2 2 2 2 0.479 0.509 0.440 0.457 0.484 0.562 0.431 2 2 2 2 2 2 2 0.467 0.443 0.417 0.469 0.459 0.507 0.526 2 0 2 0 2 2 2 5HT1E_HUMAN 0.398 0.466 0.386 0.426 0.428 0.480 0.502 0 2 2 2 0 2 2 0.423 0.556 0.470 0.469 0.457 0.529 0.400 0 2 2 2 0 2 0 0.423 0.449 0.445 0.511 0.490 0.473 0.501 0 2 2 2 0 2 2 5HT6R_HUMAN 0.398 0.420 0.434 0.396 0.424 0.478 0.536 0 2 2 2 2 2 1 0.455 0.486 0.492 0.439 0.458 0.530 0.452 2 2 2 2 2 2 0 0.456 0.435 0.461 0.489 0.451 0.493 0.582 0 0 2 2 2 2 1 TAAR2_HUMAN 0.363 0.461 0.408 0.372 0.404 0.440 0.446 0 2 0 0 0 2 2 0.404 0.551 0.403 0.399 0.428 0.492 0.417 0 2 0 0 2 2 0 0.431 0.500 0.419 0.420 0.428 0.456 0.463 0 2 0 0 0 2 2 AA3R_HUMAN 0.400 0.447 0.406 0.376 0.421 0.434 0.508 2 2 2 2 0 2 2 0.504 0.510 0.446 0.416 0.455 0.473 0.451 2 2 2 2 2 2 0 0.473 0.444 0.449 0.474 0.478 0.436 0.542 2 0 0 2 2 2 2 ACM5_HUMAN 0.446 0.449 0.403 0.429 0.432 0.460 0.498 2 2 0 2 2 2 2 0.497 0.491 0.438 0.434 0.498 0.504 0.441 2 2 2 2 2 2 0 0.478 0.452 0.456 0.474 0.465 0.504 0.530 2 2 0 0 2 2 2 HRH4_HUMAN 0.420 0.468 0.385 0.449 0.402 0.450 0.471 0 2 0 2 2 2 2 0.425 0.539 0.425 0.452 0.419 0.478 0.407 0 2 0 2 0 2 0 0.429 0.506 0.434 0.487 0.435 0.460 0.479 0 2 0 2 2 2 2 CXCR6_HUMAN 0.436 0.490 0.420 0.428 0.468 0.443 0.473 2 2 2 2 2 2 2 0.496 0.575 0.477 0.491 0.467 0.506 0.388 2 2 2 2 2 2 1 0.571 0.567 0.522 0.580 0.518 0.541 0.555 2 2 2 1 2 2 2 SSR5_HUMAN 0.422 0.495 0.402 0.416 0.463 0.484 0.512 2 2 2 2 2 2 2 0.475 0.602 0.459 0.468 0.486 0.530 0.454 2 2 2 2 2 2 2 0.542 0.591 0.570 0.486 0.537 0.536 0.636 2 2 2 2 2 2 2 OPRX_HUMAN 0.448 0.490 0.433 0.429 0.496 0.484 0.571 2 2 2 2 2 2 2 0.484 0.594 0.475 0.465 0.505 0.549 0.490 2 2 2 2 2 2 2 0.566 0.583 0.544 0.471 0.520 0.565 0.685 2 2 2 2 2 2 2 FPR1_HUMAN 0.457 0.470 0.392 0.418 0.428 0.456 0.560 2 2 2 2 2 2 2 0.554 0.552 0.439 0.447 0.459 0.497 0.475 2 2 2 2 2 2 2 0.572 0.558 0.545 0.541 0.482 0.515 0.697 2 2 2 2 2 2 2 C5ARL_HUMAN 0.475 0.476 0.450 0.412 0.423 0.516 0.486 2 2 1 2 2 2 2 0.546 0.581 0.473 0.452 0.461 0.568 0.449 2 2 2 2 2 2 2 0.559 0.562 0.507 0.541 0.525 0.566 0.640 2 2 2 2 2 1 2 GALR3_HUMAN 0.461 0.502 0.429 0.404 0.400 0.466 0.538 2 2 2 2 2 0 1 0.549 0.604 0.454 0.453 0.455 0.518 0.521 2 2 2 2 2 0 1 0.561 0.583 0.490 0.478 0.488 0.525 0.656 2 2 2 2 2 2 1 P2Y12_HUMAN 0.422 0.415 0.383 0.396 0.413 0.441 0.461 1 0 0 2 0 2 2 0.441 0.455 0.388 0.429 0.425 0.486 0.407 1 0 0 2 0 1 2 0.521 0.462 0.456 0.454 0.416 0.504 0.473 1 2 2 2 0 2 2 P2RY4_HUMAN 0.410 0.442 0.400 0.380 0.397 0.494 0.508 0 2 0 0 2 2 2 0.423 0.510 0.443 0.422 0.443 0.546 0.445 0 2 2 0 0 2 2 0.438 0.531 0.536 0.428 0.455 0.522 0.606 2 2 2 0 0 2 2 PAR4_HUMAN 0.439 0.481 0.387 0.391 0.437 0.421 0.529 2 2 0 0 2 2 2 0.509 0.565 0.466 0.427 0.467 0.439 0.457 2 2 2 0 2 2 2 0.548 0.542 0.443 0.466 0.507 0.447 0.573 2 1 2 0 2 2 2 MRGRD_HUMAN 0.410 0.509 0.425 0.407 0.395 0.456 0.462 1 2 0 0 0 2 2 0.483 0.604 0.410 0.426 0.407 0.518 0.411 2 2 0 0 0 1 0 0.491 0.599 0.461 0.469 0.449 0.466 0.539 1 2 0 2 2 2 2 EMR1_HUMAN 0.392 0.401 0.402 0.402 0.417 0.430 0.444 0 0 0 0 0 0 1 0.446 0.473 0.414 0.421 0.419 0.439 0.418 0 0 0 0 0 0 0 0.442 0.435 0.429 0.461 0.472 0.429 0.447 1 0 0 0 0 0 0 GLR_HUMAN 0.418 0.444 0.410 0.407 0.443 0.438 0.472 0 0 0 2 2 0 2 0.450 0.494 0.421 0.431 0.435 0.439 0.462 0 0 0 2 2 0 0 0.436 0.466 0.446 0.479 0.456 0.430 0.477 0 0 0 0 2 0 1 MGR8_HUMAN 0.386 0.382 0.384 0.364 0.397 0.421 0.399 2 0 0 2 0 0 0 0.422 0.438 0.405 0.388 0.406 0.430 0.410 2 0 0 0 0 0 0 0.441 0.448 0.441 0.423 0.411 0.402 0.461 2 0 0 0 0 0 0 GPC5B_HUMAN 0.397 0.413 0.396 0.394 0.463 0.429 0.397 0 2 0 0 0 0 1 0.442 0.468 0.424 0.454 0.473 0.473 0.437 0 0 0 0 0 0 0 0.450 0.441 0.420 0.478 0.459 0.480 0.457 0 1 0 0 0 0 0 FZD6_HUMAN 0.387 0.368 0.361 0.376 0.394 0.402 0.408 0 0 0 0 0 0 0 0.434 0.415 0.381 0.390 0.400 0.424 0.384 0 0 0 0 0 0 0 0.415 0.415 0.437 0.416 0.401 0.411 0.437 0 0 0 2 1 0 0 CML2_HUMAN 0.437 0.494 0.427 0.377 0.484 0.517 0.516 2 2 2 2 2 2 2 0.520 0.598 0.460 0.433 0.498 0.585 0.441 2 2 2 2 1 2 2 0.514 0.524 0.616 0.480 0.531 0.600 0.635 2 2 2 2 1 2 2 NPBW2_HUMAN 0.410 0.500 0.429 0.391 0.444 0.508 0.523 2 2 2 2 2 2 1 0.437 0.605 0.456 0.427 0.481 0.590 0.462 2 2 2 2 2 2 1 0.523 0.594 0.560 0.464 0.541 0.605 0.610 2 2 2 0 2 2 1 P2Y10_HUMAN 0.376 0.448 0.435 0.402 0.407 0.460 0.460 2 2 1 0 1 2 2 0.420 0.513 0.461 0.442 0.433 0.509 0.390 2 2 1 0 1 2 0 0.453 0.475 0.551 0.439 0.471 0.507 0.474 2 2 1 0 1 2 2 GP158_HUMAN 0.389 0.390 0.364 0.364 0.393 0.406 0.412 2 0 0 1 0 0 0 0.425 0.438 0.390 0.403 0.404 0.421 0.402 1 0 0 1 0 0 0 0.441 0.430 0.402 0.447 0.422 0.451 0.491 1 0 0 0 0 0 0 T2R43_HUMAN 0.395 0.371 0.385 0.382 0.393 0.402 0.388 1 1 0 2 2 2 2 0.395 0.422 0.376 0.373 0.396 0.428 0.374 0 1 0 0 0 2 0 0.397 0.401 0.445 0.406 0.425 0.406 0.403 0 0 0 0 0 1 0 VN1R2_HUMAN 0.374 0.434 0.364 0.364 0.392 0.401 0.406 0 0 0 0 0 0 0 0.418 0.510 0.402 0.406 0.391 0.443 0.397 0 0 0 0 0 0 0 0.417 0.461 0.435 0.437 0.434 0.423 0.471 0 0 0 1 2 0 0 O52A1_HUMAN 0.408 0.378 0.405 0.369 0.420 0.409 0.405 2 0 0 2 0 2 0 0.417 0.445 0.388 0.387 0.419 0.437 0.404 2 0 0 0 0 2 0 0.456 0.418 0.430 0.427 0.409 0.406 0.453 1 0 0 2 0 1 0
Test set 24
Continued
P2Y12_HUMAN 0.422 0.415 0.383 0.396 0.413 0.441 0.461 1 0 0 2 0 2 2 0.441 0.455 0.388 0.429 0.425 0.486 0.407 1 0 0 2 0 1 2 0.521 0.462 0.456 0.454 0.416 0.504 0.473 1 2 2 2 0 2 2 PAR4_HUMAN 0.439 0.481 0.387 0.391 0.437 0.421 0.529 2 2 0 0 2 2 2 0.509 0.565 0.466 0.427 0.467 0.439 0.457 2 2 2 0 2 2 2 0.548 0.542 0.443 0.466 0.507 0.447 0.573 2 1 2 0 2 2 2 EMR1_HUMAN 0.392 0.401 0.402 0.402 0.417 0.430 0.444 0 0 0 0 0 0 1 0.446 0.473 0.414 0.421 0.419 0.439 0.418 0 0 0 0 0 0 0 0.442 0.435 0.429 0.461 0.472 0.429 0.447 1 0 0 0 0 0 0 MGR8_HUMAN 0.386 0.382 0.384 0.364 0.397 0.421 0.399 2 0 0 2 0 0 0 0.422 0.438 0.405 0.388 0.406 0.430 0.410 2 0 0 0 0 0 0 0.441 0.448 0.441 0.423 0.411 0.402 0.461 2 0 0 0 0 0 0 FZD6_HUMAN 0.387 0.368 0.361 0.376 0.394 0.402 0.408 0 0 0 0 0 0 0 0.434 0.415 0.381 0.390 0.400 0.424 0.384 0 0 0 0 0 0 0 0.415 0.415 0.437 0.416 0.401 0.411 0.437 0 0 0 2 1 0 0 NPBW2_HUMAN 0.410 0.500 0.429 0.391 0.444 0.508 0.523 2 2 2 2 2 2 1 0.437 0.605 0.456 0.427 0.481 0.590 0.462 2 2 2 2 2 2 1 0.523 0.594 0.560 0.464 0.541 0.605 0.610 2 2 2 0 2 2 1 VN1R2_HUMAN 0.374 0.434 0.364 0.364 0.392 0.401 0.406 0 0 0 0 0 0 0 0.418 0.510 0.402 0.406 0.391 0.443 0.397 0 0 0 0 0 0 0 0.417 0.461 0.435 0.437 0.434 0.423 0.471 0 0 0 1 2 0 0 OR2C1_HUMAN 0.398 0.412 0.392 0.391 0.405 0.413 0.454 0 2 0 0 2 2 2 0.448 0.468 0.396 0.416 0.423 0.440 0.407 0 0 0 0 2 2 0 0.465 0.455 0.450 0.484 0.422 0.437 0.462 0 0 0 2 0 2 2 AGTR1_BOVIN 0.453 0.418 0.388 0.373 0.435 0.474 0.479 2 2 2 0 2 2 1 0.520 0.481 0.411 0.388 0.446 0.529 0.438 2 2 2 2 2 2 1 0.557 0.515 0.501 0.484 0.493 0.549 0.549 2 2 2 2 2 2 1 Q3T181_BOVIN 0.394 0.475 0.384 0.427 0.452 0.517 0.510 0 2 0 1 0 2 2 0.429 0.541 0.456 0.502 0.486 0.553 0.466 0 2 2 2 1 2 2 0.486 0.535 0.532 0.533 0.534 0.557 0.616 2 2 2 2 1 2 2 FSHR_BOVIN 0.415 0.467 0.388 0.412 0.415 0.426 0.480 2 2 0 2 0 0 2 0.477 0.526 0.425 0.424 0.425 0.460 0.412 2 2 2 2 0 2 2 0.469 0.499 0.478 0.447 0.432 0.435 0.567 2 2 0 2 2 0 2 GNRHR_CANFA 0.374 0.437 0.409 0.386 0.451 0.429 0.434 0 2 2 1 2 1 2 0.425 0.482 0.461 0.409 0.467 0.472 0.397 0 2 2 0 2 1 0 0.412 0.440 0.467 0.437 0.444 0.475 0.474 0 2 0 1 2 1 0 EDNRA_CANFA 0.392 0.460 0.364 0.423 0.404 0.475 0.401 2 2 0 2 0 2 2 0.465 0.491 0.428 0.469 0.429 0.509 0.387 2 2 2 2 0 2 0 0.472 0.449 0.400 0.513 0.409 0.490 0.434 1 1 0 2 2 2 2 5HT1A_CANFA 0.400 0.465 0.416 0.405 0.454 0.544 0.552 2 2 2 2 2 2 2 0.455 0.560 0.452 0.440 0.479 0.610 0.473 2 2 2 2 0 2 2 0.454 0.456 0.452 0.476 0.470 0.533 0.593 2 2 0 0 0 2 2 OPS5_DROME 0.434 0.485 0.369 0.374 0.426 0.417 0.390 2 2 0 0 0 2 0 0.478 0.560 0.385 0.413 0.439 0.477 0.401 2 2 0 0 0 2 0 0.470 0.519 0.407 0.474 0.442 0.481 0.419 2 2 0 2 2 2 0 GR33A_DROME 0.410 0.396 0.371 0.385 0.403 0.414 0.445 0 0 0 0 1 0 0 0.459 0.468 0.392 0.400 0.396 0.420 0.424 0 0 0 0 1 0 0 0.433 0.435 0.424 0.411 0.412 0.441 0.500 0 0 0 0 1 1 0 MTH4_DROME 0.369 0.407 0.401 0.375 0.400 0.394 0.397 0 0 2 1 0 0 1 0.401 0.471 0.424 0.398 0.426 0.416 0.395 0 0 2 2 2 0 0 0.435 0.428 0.450 0.426 0.415 0.407 0.428 0 0 0 2 0 0 0 OLF6_CHICK 0.415 0.404 0.373 0.373 0.400 0.398 0.444 0 0 0 0 2 0 2 0.401 0.467 0.400 0.380 0.415 0.426 0.412 0 0 0 0 0 0 0 0.419 0.418 0.459 0.402 0.421 0.413 0.454 0 0 0 0 0 0 2 FZD7_CHICK 0.392 0.453 0.422 0.389 0.413 0.410 0.414 0 0 0 0 0 1 0 0.428 0.510 0.429 0.430 0.426 0.438 0.432 0 0 2 0 1 0 0 0.429 0.448 0.446 0.467 0.465 0.435 0.461 0 0 2 0 1 1 0 P2RY1_CHICK 0.453 0.514 0.437 0.407 0.448 0.493 0.551 2 2 2 0 2 2 2 0.509 0.592 0.468 0.450 0.482 0.546 0.478 2 2 2 2 2 2 2 0.562 0.592 0.569 0.473 0.451 0.559 0.646 2 2 2 2 2 1 2 TAAR6_MOUSE 0.441 0.442 0.369 0.414 0.405 0.477 0.477 1 2 1 2 2 2 1 0.458 0.473 0.432 0.451 0.442 0.526 0.401 1 2 2 2 2 1 0 0.498 0.435 0.416 0.459 0.433 0.507 0.494 1 0 2 0 1 2 1 NMBR_MOUSE 0.461 0.460 0.373 0.417 0.471 0.507 0.415 2 2 2 2 2 2 2 0.521 0.554 0.427 0.488 0.504 0.578 0.421 2 2 2 2 2 2 2 0.552 0.511 0.426 0.530 0.486 0.567 0.466 1 2 0 2 2 2 2 FFAR2_MOUSE 0.423 0.478 0.393 0.390 0.431 0.449 0.452 2 2 0 2 2 2 2 0.490 0.570 0.438 0.430 0.465 0.474 0.421 2 2 1 2 2 1 0 0.507 0.565 0.503 0.454 0.455 0.466 0.474 1 2 1 0 0 2 0 MLO10_ARATH 0.384 0.385 0.385 0.380 0.405 0.406 0.388 2 0 0 0 0 0 0 0.414 0.416 0.402 0.446 0.442 0.421 0.398 1 0 0 0 0 0 0 0.397 0.419 0.424 0.496 0.424 0.417 0.442 2 0 0 0 2 0 0 5HT2A_MACMU 0.389 0.453 0.413 0.409 0.462 0.442 0.454 2 2 2 0 2 2 2 0.437 0.519 0.464 0.395 0.484 0.485 0.390 2 2 2 0 2 2 0 0.446 0.460 0.426 0.426 0.463 0.449 0.457 0 2 0 0 2 2 2 OPSD_MESBI 0.402 0.505 0.410 0.424 0.492 0.506 0.457 2 2 0 0 2 2 2 0.453 0.597 0.421 0.468 0.514 0.543 0.438 0 2 0 2 2 2 0 0.435 0.561 0.464 0.462 0.492 0.570 0.498 2 2 0 0 2 2 2 V1AR_MICOH 0.449 0.432 0.413 0.391 0.426 0.490 0.490 2 1 2 0 1 2 2 0.509 0.474 0.470 0.417 0.452 0.574 0.453 2 2 1 0 1 2 2 0.534 0.440 0.461 0.443 0.465 0.536 0.589 2 2 1 0 1 2 2
Note: The number “0”, “1”, and “2” donate that the predicting helical regions of GPCRs by the scoring matrices of the training set 18
18 L DS are “different from”, “partial consistent with (similar to)”, and “identical with” the actual transmembrane regions of GPCRs, respectively.
3. RESULTS
In what follows, we present three primary results,
based on application of the methods described above.
[image:10.595.57.535.99.413.2]3.1. Phylogenetic Analysis and Structural
Evolution
Figure 1
displays the grouping frame of the training
datasets (learning dataset,
S
L), where 22 groups belong
to three types. Of the different chromosome type, there
are five classes: Class A (Groups 1-4 and Group 14),
Class B (Group 15), Class C (Group 16), Class F (Group
22), and Class O (Groups 5-13 and Group 17). Group 1
1L A
S
, Group 2
2, Group 3
, Group 4
LA
S
3
L A
S
4L A
S
,
and Group 14
14L A
S
of Class A are composed of 44, 38,
32, 20, and 44 GPCRs, respectively. Class B
15L B
,
S
LS
,
,
, C
, and F/S
contain 13, 10, and 9 GPCRs,
respectively. Groups
and 13
O5 O6 O13consist of 39, 24, 33, 11, 48, 40, 44, 20, and 20 GPCRs,
respectively; while Group 17
16 L CS
22L F
S
5, 6,
S
LS
L
17L O
S
includes 33 GPCRs.
Group 18
S
18
, Group 19
L
D
19L S
S
,Group 20
20 L SS
,
and Group 21
contain 39, 27, 22, and 20 GPCRs,
respectively. The following test datasets
21 L DS
S
Tare com-
posed of two groups: Group 23
from human and
Group 24
23 TS
24 TS
from different species (Appendix 1,
Table 3
). Here,
1 14L L A A
S
S
,
2 14,
L L A A
S
S
3 1
L L A A
S
S
4
, and
4 1;
L L A A
S
S
4
L5 L1 O OS
S
7
,
6 1
L L O O
S
S
7
,
7 17,
L L O O
S
S
L8 L17O O
S
S
,
9 1
L L O O
S
S
7
,
10 17,
11L L O O
S
S
L L17O O
S
S
,
12 17
L L O O
S
S
and
13 17;
L L O O
S
S
L18 LD A
S
S
14
,
18 15
L L D B
S
S
,
18 16,
L L D C
S
S
L18 L22D F
S
S
and
18 17L L D O
S
S
.
Table 1
lists the amino acid sequences of TM1 in
Group 1 GPCRs, the common 12-residue regions of TM1
by alignment, and the corresponding coding sequences
consisting of 36 nucleotides.
Table 2
displays the amino
acid sequence length and the sample number consisting
of the scoring matrix of each transmembrane region of
GPCRs in the training datasets after sequence alignments.
Different the training sets, different the amino acid
sequence length and the sample number consisting of the
scoring matrix to same TMs; the same the training sets,
different the amino acid sequence length and the sample
number consisting of the scoring matrix to different TMs.
Figure 2
illustrates the scoring matrices of seven TMs
3.2. Validation of the Models (Scoring
Matrix)
22 scoring matrices are built based on the 22 groups of
training datasets
S
Lfrom GPCR superfamily and
validated by two groups of test sets
S
TS
.
Tables 4
and
5
display the score and the prediction accuracy of the
coding sequences of GPCRs’ trans-membrane segments
in test sets by the scoring matrices of the different
training datasets. All the data can be clearly divided into
four categories:
23-“2”,
23-“1 + 2”,
24-“2” and
24
-“1 + 2”. The number “2” donates that the predicting
helical regions of GPCRs by the scoring matrices of the
training set are identical with the actual TM regions of
GPCRs, while the number “1” donates the predicting
helical regions of GPCRs are partial consistent with their
actual TMs. “1 + 2” means the combination of “2” with
“1”, namely the positive prediction results. There are 22
examinations (corresponding 22 training sets) in each
category. For instance, if we use test set
23to examine
Group 1
of training set, and then get seven “all
hit” (“2”) correctness rates (validity) (TM1 to TM7).
These 7 correctness rates as a whole can be deemed as
examination 1 in
23-“2”. Under this situation, mean of
one examination’s correctness rate is the mean of the
seven correctness rates (
Table 5
). The rest may be de-
duced by analogy.
T
S
T
S
T
S
S
TT T
S
1 L AS
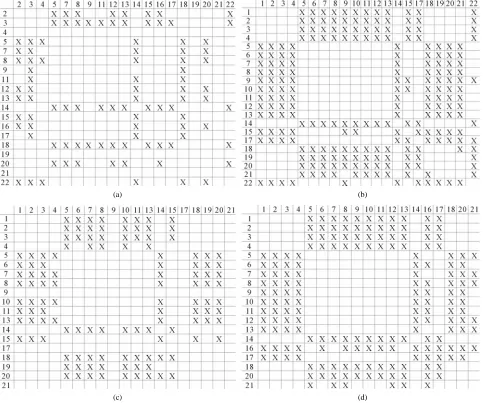
3.3. Statistics Analysis
One way-ANOVA, a powerful and common statistical
procedure, is used to figure out whether there are sig-
nificant differences among means of correctness rate of
the examinations. As one way-ANOVA requires, all data
that does not obey normal distribution are eliminated,
such as Groups 1, 6 and 10 of
-“2”, group 16 of
23
-“1 + 2”, groups 12, 16 and 22 of
24-“2”, and groups
15, 19 and 22 of
24-“1 + 2”. The four results of one
way-ANOVA, with F values of 21.931, 9.308, 22.807
and 7.488 for
23-“2”,
23-“1 + 2”,
24-“2” and
24
-“1 + 2”, respectively, indicate that there are signifi-
cant differences between means of correctness rate of
examinations at the 0.01 level in each category. Then
Test of Homogeneity of Variances is applied in order to
find a suitable method for multiple comparisons. Actu-
ally,
23-“1 + 2” and
24-“1 + 2”, with P values of
0.7673 and 0.7121, respectively, has homogenous vari-
ances at the 0.05 level, and LSD method of multiple
comparisons will be used. On the other hand, variances
of
23-“2” and
24-“2” with P values of 0.0032 and
0.0418, respectively, are not homogenous, which means
that Tamhane’s T2 should be chosen as multiple com-
parisons method. The results of multiple comparisons are
respectively visualized in
Figure 4
, where “X” shows
there are significant differences (at the significant level
of 0.05) between the two examinations indicated by cor-
responding column and line (specific value of multiple
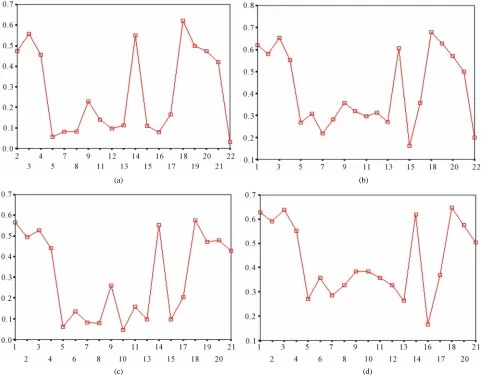
comparisons can be found in supplemental data). Finally,
the average of correctness rate of examinations of each
category are plotted respectively on
Figure 5
, from
which we can see that the training set of 18 has the high-
est mean of correctness rate when examined by test set in
each of the four groups although training set 18 and other
training sets such as 2, 3, 4, 14, etc. has not statistical
difference. ANOVA results reveal that there are three
scoring matrices significant, from three training datasets,
Group 3
23 TS
S
TS
TS
S
T TS
T TS
S
S
TT T
S
TS
TS
3 L AS
, 14
14 L AS
, and 18
, respectively
(
Figure 5
).
18 L D
S
The following t-test results reveal that the mean dif-
ference of the scores between two groups, “2”/“2 + 1”
and “0”, are statistically significant (P < 0.05) with the
exception of TM4 and TM5 (
Table 6
) based on the
scores and the validity of GPCRs in test sets (
23and
24
) by the scoring matrices of training set
18T
S
T
S
LD
S
,
14L A
S
and
3L A
S
(
Table 3
). Especially to TM2, TM3, TM6, and
TM7, the mean of two groups between “2”/“2 + 1” and
“0” is statistically significant (P < 0.01), which means
that the probability of the difference being due to chance
is less than 0.01. Of the seven TMs, there is significant
different between the scores of two groups in TM2 with
the t values from 4.494 to 6.959 (P < 0.001), where the
degrees of freedom of a set of data are more than 30 but
less than 40 (the critical value of t for the 0.001 level of
significance at 30 of df is 3.646). On the other hand,
t-values show that there are significant different between
the scores of two groups by the scoring matrix of
14L A
S
(P < 0.001) except in TM1, TM6, and TM7 of
23and
TM5 of
24(P < 0.01). But the probability that the dif-
ference between samples in TM4 of
18T
S
TS
L DS
and TM5 of
3
L A
S
is more than 0.05 due to sampling error.
Comparison of t-values in
23with those in
24re-
veals that different scoring matrices have different sta-
tistical significance. To the scoring matrix of
18T
S
S
TL D
S
and
14
L A
S
, the mean differences between the scores of two
groups in
24are more than those in
23; whereas the
mean differences in
23are more than those in
24.
The reason may be the homology of samples consisting
of training sets and test sets. The samples of
18T
S
S
TT
S
S
TL D
S
and
14
L A
S
come from different GPCR sub-families whereas
those of
3L A
S
come from the same GPCR subfamily.
Similarly, the members of
belong to human GPCR
proteins whereas those of
are GPCR proteins from
different species.
23 T 24 TS
S
Statistical graphs reveal that the mean scores of the
predicting coding sequences of GPCRs’ 7 TMs in test
sets (
23and
24) by the scoring matrices of
3T
S
S
T LA
S
is
higher than those by
14L A
S
except TM2 and TM6, while
the predicting scores by
14L A
S
are higher than those by
18
L D
Table 4.
The score of the coding sequences of GPCRs’ each trans-membrane segment in test sets by the scoring matrices of the
dif-ferent training datasets.
Test set 23 Test set 24
Training set
TM1 TM2 TM3 TM4 TM5 TM6 TM7 TM1 TM2 TM3 TM4 TM5 TM6 TM7
“2”*
1 0.445 ± 0.035 0.481 ± 0.033 0.416 ± 0.021 0.426 ± 0.030 0.457 ± 0.031 0.520 ± 0.034 0.473 ± 0.039 0.454 ± 0.034 0.490 ± 0.027 0.426 ± 0.024 0.434 ± 0.033 0.470 ± 0.031 0.531 ± 0.041 0.480 ± 0.034
2 0.461 ± 0.055 0.527 ± 0.064 0.509 ± 0.064 0.481 ± 0.038 0.494 ± 0.040 0.520 ± 0.048 0.536 ± 0.066 0.460 ± 0.049 0.538 ± 0.061 0.504 ± 0.077 0.484 ± 0.038 0.508 ± 0.044 0.534 ± 0.056 0.538 ± 0.068 3 0.503 ± 0.052 0.519 ± 0.054 0.508 ± 0.058 0.475 ± 0.033 0.478 ± 0.037 0.500 ± 0.049 0.550 ± 0.070 0.500 ± 0.056 0.508 ± 0.053 0.495 ± 0.052 0.483 ± 0.035 0.469 ± 0.038 0.509 ± 0.049 0.535 ± 0.072 4 0.469 ± 0.030 0.487 ± 0.059 0.484 ± 0.032 0.444 ± 0.021 0.436 ± 0.031 0.513 ± 0.053 0.501 ± 0.057 0.470 ± 0.035 0.482 ± 0.055 0.475 ± 0.037 0.445 ± 0.024 0.440 ± 0.024 0.515 ± 0.036 0.500 ± 0.057 5 0.417 ± 0.012 0.455 ± 0.012 N/A N/A 0.447 ± 0.052 0.431 ± 0.012 N/A 0.427 ± 0.018 N/A N/A N/A 0.424 ± 0.016 0.430 ± 0.014 N/A 6 0.518 ± 0.034 0.477 ± 0.034 N/A 0.426 ± 0.019 0.413 ± 0.009 0.420 ± 0.014 0.425 ± 0.022 0.500 ± 0.025 0.462 ± 0.029 0.488 ± 0.045 0.428 ± 0.018 0.410 ± 0.005 0.460 ± 0.097 0.444 ± 0.031 7 0.439 ± 0.017 0.460 ± 0.021 N/A N/A 0.419 ± 0.017 N/A 0.462 ± 0.017 0.457 ± 0.046 0.523 ± 0.098 N/A 0.382 ± 0.036 0.418 ± 0.013 N/A 0.501 ± 0.064 8 0.452 ± 0.022 N/A N/A 0.388 ± 0.002 0.408 ± 0.018 N/A 0.449 ± 0.018 0.459 ± 0.040 0.626 ± 0.105 N/A N/A 0.404 ± 0.012 0.501 ± 0.102 0.445 ± 0.045 9 0.461 ± 0.029 0.431 ± 0.032 0.504 ± 0.030 0.414 ± 0.015 0.447 ± 0.034 0.453 ± 0.019 0.449 ± 0.032 0.468 ± 0.030 0.453 ± 0.061 0.592 ± 0.115 0.416 ± 0.015 0.459 ± 0.034 0.478 ± 0.062 0.452 ± 0.030 10 0.422 ± 0.006 N/A N/A N/A N/A N/A 0.413 ± 0.025 0.414 ± 0.017 N/A N/A 0.408 ± 0.001 N/A N/A 0.435 ± 0.030 11 0.457 ± 0.029 0.483 ± 0.033 0.404 ± 0.041 0.400 ± 0.001 0.405 ± 0.018 N/A 0.426 ± 0.033 0.475 ± 0.038 0.537 ± 0.077 0.449 ± 0.073 0.421 ± 0.023 0.407 ± 0.023 0.600 ± 0.097 0.442 ± 0.029 12 0.432 ± 0.017 N/A 0.453 ± 0.049 0.416 ± 0.015 0.412 ± 0.002 N/A 0.421 ± 0.022 0.454 ± 0.048 0.595 ± 0.088 N/A 0.415 ± 0.022 0.402 ± 0.016 0.582 ± 0.050 0.430 ± 0.056 13 0.467 ± 0.025 0.471 ± 0.034 N/A N/A 0.385 ± 0.012 N/A 0.416 ± 0.025 0.480 ± 0.040 0.529 ± 0.051 N/A 0.447 ± 0.047 0.393 ± 0.015 0.459 ± 0.107 N/A 14 0.479 ± 0.045 0.548 ± 0.040 0.454 ± 0.021 0.447 ± 0.023 0.464 ± 0.025 0.509 ± 0.049 0.443 ± 0.027 0.488 ± 0.036 0.540 ± 0.042 0.448 ± 0.021 0.450 ± 0.029 0.466 ± 0.028 0.523 ± 0.050 0.444 ± 0.030 15 0.510 ± 0.067 0.409 ± 0.009 0.503 ± 0.086 0.512 ± 0.083 0.496 ± 0.042 0.444 ± 0.039 0.497 ± 0.079 0.482 ± 0.053 0.446 ± 0.036 0.531 ± 0.082 0.489 ± 0.038 0.415 ± 0.035 0.419 ± 0.016 0.484 ± 0.069 16 0.474 ± 0.033 N/A 0.479 ± 0.063 0.482 ± 0.066 0.477 ± 0.015 0.583 ± 0.015 0.467 ± 0.089 0.448 ± 0.051 N/A 0.451 ± 0.032 N/A 0.472 ± 0.030 0.597 ± 0.129 N/A 17 0.458 ± 0.032 0.432 ± 0.019 0.442 ± 0.049 0.412 ± 0.020 0.420 ± 0.022 N/A 0.420 ± 0.028 0.465 ± 0.029 0.527 ± 0.106 0.471 ± 0.058 0.406 ± 0.019 0.427 ± 0.018 N/A 0.430 ± 0.027
18 0.421 ± 0.029 0.465 ± 0.027 0.410 ± 0.020 0.402 ± 0.024 0.438 ± 0.030 0.464 ± 0.036 0.481 ± 0.046 0.426 ± 0.029 0.465 ± 0.027 0.407 ± 0.021 0.411 ± 0.019 0.441 ± 0.026 0.474 ± 0.037 0.478 ± 0.045 19 0.437 ± 0.029 0.463 ± 0.031 0.417 ± 0.014 0.410 ± 0.026 0.443 ± 0.031 0.460 ± 0.031 0.458 ± 0.041 0.437 ± 0.031 0.460 ± 0.035 0.424 ± 0.02 0.414 ± 0.02 0.440 ± 0.032 0.467 ± 0.038 0.456 ± 0.040 20 0.464 ± 0.042 0.521 ± 0.039 0.394 ± 0.010 0.392 ± 0.021 0.435 ± 0.027 0.403 ± 0.016 0.447 ± 0.025 0.466 ± 0.040 0.518 ± 0.031 0.405 ± 0.014 0.392 ± 0.018 0.428 ± 0.027 0.408 ± 0.021 0.457 ± 0.033 21 0.410 ± 0.020 0.444 ± 0.020 0.381 ± 0.014 0.387 ± 0.018 0.425 ± 0.021 0.436 ± 0.028 0.415 ± 0.024 0.418 ± 0.023 0.446 ± 0.023 0.385 ± 0.022 0.390 ± 0.020 0.435 ± 0.026 0.439 ± 0.028 0.421 ± 0.029 22 0.469 ± 0.023 N/A 0.565 ± 0.151 N/A N/A N/A N/A 0.508 ± 0.083 N/A 0.580 ± 0.129 0.638 ± 0.177 0.622 ± 0.168 N/A N/A PreMod 0.421 ± 0.029 0.465 ± 0.027 0.454 ± 0.021 0.447 ± 0.023 0.438 ± 0.030 0.464 ± 0.036 0.481 ± 0.046 0.426 ± 0.029 0.465 ± 0.027 0.448 ± 0.021 0.450 ± 0.029 0.441 ± 0.026 0.474 ± 0.037 0.478 ± 0.045 “1 + 2”*
1 0.442 ± 0.034 0.477 ± 0.037 0.413 ± 0.023 0.427 ± 0.030 0.457 ± 0.030 0.515 ± 0.036 0.473 ± 0.041 0.454 ± 0.033 0.489 ± 0.027 0.423 ± 0.026 0.434 ± 0.034 0.470 ± 0.031 0.524 ± 0.041 0.475 ± 0.036
2 0.454 ± 0.049 0.523 ± 0.066 0.495 ± 0.062 0.479 ± 0.038 0.495 ± 0.039 0.516 ± 0.048 0.537 ± 0.069 0.456 ± 0.046 0.525 ± 0.064 0.493 ± 0.077 0.480 ± 0.037 0.508 ± 0.044 0.525 ± 0.057 0.542 ± 0.066 3 0.494 ± 0.049 0.517 ± 0.054 0.505 ± 0.059 0.478 ± 0.039 0.477 ± 0.040 0.496 ± 0.053 0.552 ± 0.071 0.500 ± 0.049 0.507 ± 0.053 0.488 ± 0.050 0.483 ± 0.041 0.465 ± 0.041 0.507 ± 0.050 0.537 ± 0.069 4 0.468 ± 0.029 0.485 ± 0.057 0.470 ± 0.043 0.448 ± 0.025 0.436 ± 0.031 0.506 ± 0.055 0.499 ± 0.055 0.464 ± 0.036 0.477 ± 0.053 0.467 ± 0.042 0.449 ± 0.027 0.440 ± 0.022 0.508 ± 0.040 0.499 ± 0.055 5 0.418 ± 0.052 0.461 ± 0.045 0.449 ± 0.065 0.376 ± 0.026 0.437 ± 0.043 0.440 ± 0.029 0.425 ± 0.049 0.418 ± 0.017 0.469 ± 0.041 0.439 ± 0.026 0.369 ± 0.012 0.422 ± 0.020 0.430 ± 0.014 0.422 ± 0.037 6 0.470 ± 0.035 0.464 ± 0.030 0.448 ± 0.035 0.425 ± 0.018 0.400 ± 0.017 0.420 ± 0.012 0.438 ± 0.027 0.469 ± 0.021 0.459 ± 0.040 0.475 ± 0.047 0.426 ± 0.019 0.401 ± 0.021 0.473 ± 0.081 0.465 ± 0.075 7 0.443 ± 0.018 0.469 ± 0.031 0.448 ± 0.034 0.367 ± 0.002 0.425 ± 0.020 0.446 ± 0.045 0.454 ± 0.019 0.449 ± 0.032 0.472 ± 0.056 0.472 ± 0.078 0.382 ± 0.026 0.423 ± 0.014 0.466 ± 0.085 0.476 ± 0.053
8 0.430 ± 0.025 0.486 ± 0.029 0.443 ± 0.030 0.399 ± 0.029 0.405 ± 0.014 0.438 ± 0.026 0.447 ± 0.022 0.443 ± 0.033 0.494 ± 0.067 0.503 ± 0.066 0.401 ± 0.025 0.406 ± 0.009 0.470 ± 0.082 0.466 ± 0.075 9 0.455 ± 0.029 0.439 ± 0.029 0.500 ± 0.024 0.412 ± 0.014 0.443 ± 0.033 0.451 ± 0.020 0.451 ± 0.028 0.463 ± 0.031 0.450 ± 0.052 0.563 ± 0.110 0.418 ± 0.021 0.455 ± 0.032 0.458 ± 0.053 0.470 ± 0.069 10 0.414 ± 0.022 0.429 ± 0.025 0.428 ± 0.033 0.388 ± 0.015 0.388 ± 0.018 0.421 ± 0.033 0.423 ± 0.027 0.422 ± 0.025 0.437 ± 0.054 0.445 ± 0.056 0.396 ± 0.029 0.393 ± 0.020 0.473 ± 0.096 0.448 ± 0.062 11 0.453 ± 0.031 0.480 ± 0.031 0.398 ± 0.018 0.402 ± 0.018 0.405 ± 0.018 0.429 ± 0.011 0.436 ± 0.026 0.457 ± 0.039 0.494 ± 0.052 0.420 ± 0.053 0.413 ± 0.021 0.410 ± 0.020 0.508 ± 0.118 0.459 ± 0.071 12 0.422 ± 0.018 0.445 ± 0.026 0.426 ± 0.027 0.418 ± 0.014 0.404 ± 0.018 0.442 ± 0.044 0.418 ± 0.025 0.435 ± 0.039 0.457 ± 0.064 0.452 ± 0.073 0.410 ± 0.023 0.401 ± 0.019 0.526 ± 0.102 0.442 ± 0.054 13 0.465 ± 0.022 0.473 ± 0.031 0.418 ± 0.021 0.398 ± 0.009 0.392 ± 0.022 0.398 ± 0.020 0.430 ± 0.026 0.474 ± 0.035 0.502 ± 0.052 0.465 ± 0.074 0.419 ± 0.038 0.404 ± 0.030 0.446 ± 0.088 0.474 ± 0.085 14 0.477 ± 0.045 0.543 ± 0.046 0.455 ± 0.020 0.446 ± 0.024 0.464 ± 0.026 0.507 ± 0.047 0.445 ± 0.035 0.482 ± 0.038 0.540 ± 0.042 0.449 ± 0.021 0.450 ± 0.029 0.462 ± 0.031 0.518 ± 0.048 0.441 ± 0.031
15 0.510 ± 0.067 0.446 ± 0.045 0.497 ± 0.080 0.497 ± 0.074 0.448 ± 0.050 0.442 ± 0.037 0.489 ± 0.075 0.482 ± 0.053 0.442 ± 0.033 0.513 ± 0.080 0.490 ± 0.038 0.424 ± 0.029 0.438 ± 0.032 0.484 ± 0.054 16 0.450 ± 0.034 0.474 ± 0.017 0.479 ± 0.073 0.415 ± 0.070 0.496 ± 0.049 0.475 ± 0.095 0.455 ± 0.060 0.439 ± 0.033 0.472 ± 0.024 0.461 ± 0.063 0.432 ± 0.085 0.490 ± 0.052 0.474 ± 0.102 0.473 ± 0.069 17 0.453 ± 0.030 0.440 ± 0.031 0.413 ± 0.027 0.405 ± 0.022 0.413 ± 0.023 0.419 ± 0.027 0.422 ± 0.032 0.462 ± 0.030 0.451 ± 0.056 0.431 ± 0.051 0.403 ± 0.023 0.424 ± 0.022 0.456 ± 0.082 0.440 ± 0.061 18 0.421 ± 0.029 0.461 ± 0.032 0.414 ± 0.022 0.401 ± 0.024 0.437 ± 0.030 0.464 ± 0.036 0.481 ± 0.048 0.427 ± 0.029 0.463 ± 0.027 0.408 ± 0.025 0.409 ± 0.020 0.439 ± 0.026 0.470 ± 0.038 0.476 ± 0.045 19 0.429 ± 0.030 0.463 ± 0.031 0.416 ± 0.015 0.412 ± 0.027 0.439 ± 0.030 0.458 ± 0.036 0.459 ± 0.042 0.436 ± 0.029 0.459 ± 0.035 0.419 ± 0.022 0.418 ± 0.025 0.443 ± 0.030 0.467 ± 0.038 0.454 ± 0.039 20 0.462 ± 0.04 0.512 ± 0.047 0.393 ± 0.016 0.387 ± 0.020 0.437 ± 0.029 0.400 ± 0.016 0.445 ± 0.025 0.464 ± 0.041 0.516 ± 0.032 0.401 ± 0.018 0.391 ± 0.019 0.428 ± 0.025 0.408 ± 0.021 0.451 ± 0.032
21 0.412 ± 0.022 0.437 ± 0.028 0.378 ± 0.014 0.395 ± 0.020 0.423 ± 0.021 0.433 ± 0.030 0.414 ± 0.023 0.417 ± 0.024 0.446 ± 0.023 0.384 ± 0.022 0.396 ± 0.020 0.431 ± 0.027 0.438 ± 0.027 0.419 ± 0.030 22 0.472 ± 0.031 0.423 ± 0.045 0.501 ± 0.073 0.467 ± 0.047 0.487 ± 0.026 0.462 ± 0.033 0.49