© 2019, IRJET | Impact Factor value: 7.34 | ISO 9001:2008 Certified Journal | Page 1423
Optimal Placement and Sizing of STATCOM using PSO
Muzafar Ahmad Khanday
1, Rahul Malviya
21
Researh Scholar of Power System IES College of Technology, Bhopal MP.
2Assistant Professor IES College of Technology, Bhopal MP, India.
---***---Abstract -
Generation and transmission of the power is
complex process, as it requires working of different power system components in tandem to maximize output. Voltage collapse is usually occurs when reactive power demand on load side is not being met in electric power transmission. Reactive power compensation is important for maintaining voltage to deliver real power through power lines. The flexible AC transmission system (FACTS) are now recognized as a viable solution for controlling transmission voltage, power flow ,etc. and represent a new era for transmission systems. STATCOM is a member of FACTS family and is connected in shunt with system. However, owing to the considerable cost of the FACTS device involved, it is important to find the optimal location and sizing (rating) of the device in a power system to obtain maximum benefits of the devices. The main purpose of this research is to implement the Optimum Reactive Power Delivery (ORPD) to "optimally" set the values of control variables. This research work proposes an effective heuristic optimization technique known as the Particle Swarm Optimization (PSO). The objective function is formulated to minimize total power loss (TPL) and to enhance the Voltage stability. For load demand levels location and sizing (rating) of the device is determined. The whole work is simulated in MATLAB.
Key Words:Power system,ORPD, FACTS, STATCOM, PSO, Voltage Stability etc.
1. INTRODUCTION
At present power systems, transmission networks are progressively becoming more stressed because demand is increasing and limitations on adding new lines. Many reasons such as growing demand for electric energy, deregulation, and eco-nomical as well as environmental restrictions on expanding the power networks have forced the existing systems to operate very close to their stability limits. One of the impacts of such stressed system is risk of losing stability after a disturbance the techniques of reactive power compensation are found to be efficient in a stressed transmission network for the better utilization of existing facilities of the network without sacrificing desired stability margin. The VAR compensation improves the stability of ac system by increasing the maximum active power that can be transmitted Voltage magnitude is important factor that affect power supply quality. Voltage sag or swell prove problematic to customer as it leads to production downtime. Reactive power compensation improves the performance of ac
system. It is important for maintaining voltage to deliver real power through power lines. By reactive power compensation we can control the power factor and reduce the consumption of electricity. Reactive power compensation have two aspects. Voltage support means voltage fluctuation reduction at the given terminal of transmission line. Load compensation involves power factor improvement, balance of active power drawn from supply, improvement in voltage regulation and elimination of current harmonics etc. There are mainly two types of compensation in use:-Series compensation and shunt compensation. System parameters are modified by these to enhance VAR compensation. This results in improvement of stability of the ac system by raising maximum active power to be transmitted. The flexible AC transmission system (FACTS) are now recognized as a viable solution for controlling transmission voltage, power flow, dynamic response ,etc. and represent a new era for transmission systems. These adjust parameters like governing the power system like voltage, current, phase angle, impedance and frequency. Although primary purpose of the shunt FACTS devices is supporting bus voltage by injection (or absorption ) of reactive power, they also have capability of improving transient stability by increasing (or decreasing) power transfer capability as machine angle increases (or decreases), that is achieved by operation of shunt FACTS devices in the capacitive (or inductive) mode. STATCOM is a member of FACTS family and is connected in shunt with system. It is capable of enhancing voltage security. However, owing to the considerable cost of the FACTS device involved, it is important to find the optimal location and sizing (rating) of the device in a power system to obtain maximum benefits of the devices
1.1 LITERATURE REVIEW
Nitish Rawat et al [3] In his research discussed about facts devices that are used in the power system. The facts devices are used to maintain and enhance different parameters such as, transmission losses, generation cost, voltage stability and system security in the power system. The facts devices are being optimized with the aid of different techniques.
A. Karami and Galougahi [4] Discussed in their paper, an auxiliary controller is employed for the STATCOM (static synchronous compensator) to improve transient stability limit of the multi machine power systems.
© 2019, IRJET | Impact Factor value: 7.34 | ISO 9001:2008 Certified Journal | Page 1424
overloaded lines, resulting in enhanced power system loadability lower transmission line losses, enhanced stability and safety, and ultimately, transmission system with more energy-efficiency. To make it easier and more flexible to locate appropriate FACTS locations, they introduced graphical user interface (GUI) based on a genetic algorithm (GA) in their paper
Rahul Dubey et al[10] Has presented in their paper literature survey on shunt connected applications of FACTS (Flexible Alternating Current Transmission Systems ) applica tions such as Static VAR Compensator (SVC), Static Synchrono us Compensator (STATCOM) for enhancing power reactive po wer, minimizing real power losses, improving voltage stabilit y, and also providing flexible operation & improved controlla bility
E Ghahremani, I Kamwa [11] discussed in his paper that power production costs have developed a need to find reliable, inexpensive and available power generation sources the optimization method is intended to minimize the losses of the transmission line and maximize power
K.Karthikeyana, P.K. Dhal [12] in this paper authors have thoroughly investigated transient stability enhancement through optimal location of STATCOM and its tuning. They have executed performance analysis of the STATCOM for the Western Science Coordinated Council (WSCC) nine bus system for enhancement of the transient stability using the Power System Analysis (PSAT) tool box software
Majid Moazzami et al [14] discussed that by restructuring power systems, power plant companies improve power quality and the reliability of our distribution systems after using modern instruments. Also, using these distributed generation sources (DGs) and distribution static synchronized compensator (D-STATCOM) in the distribution systems are increased. The reduction of losses in the distribution systems and system energy losses costs is compared. In this article, to determine the optimal position of installation of instruments, used an objective function which consists of equipment's installation.
Bushra Weqar et al [15] Used technique based on analytical approach in their work for finding optimized size and the location of distributed generations (DG) and the Distribution Static Compensator (D-STATCOM) in distribution network.
Garima Choudhary et al [13] investigated optimal placement of the Static Synchronous Compensators (STATCOMs) in order to enhance voltage stability limits and reduce the transmission losses. Continuous expansion of the power demands and the lack of supply have led to study on the Flexible Alternating Current Transmission System (FACTS) devices, as fascinated area for the research. Considering the benefits and applications of FACTS devices.
1.2
REACTIVE POWER COMPENSATION
In the purely reactive load, the voltage and current are out of phase by 90 degrees. For half cycle, the product of the voltage and current is + ive, but for the another half cycle,
this product is negative, which indicates that on average, as much energy exactly flows into load as flows out back. Power which returns to source in each cycle having movement in both directions in electric circuit or it reacts upon itself is called as Reactive Power. Reactive power supplies stored energy in reactive elements. As per design, power system equipment operate within ±5% of nominal voltages. Voltage levels fluctuations results in malfunctioning of various appliances. Generation and transmission of the power is complex process, as it requires working of different power system components in tandem to maximize output. Main component among these is reactive power . It is important for maintaining voltage to deliver real power through power lines. Inductive loads like motor transformer require reactive power for operating. For improving A.C power system performance management of reactive power in efficient way called as reactive power compensation is needed.
2. PARTICLE SWARM OPTIMIZATION
In general, PSO algorithm is inspired by the activity of the animal in order to resolve optimization problems. In the same species foraging behavior is cooperative. The PSO technology is a parallel search technique using multi-agent (particle swarm) methods. Every agent in the swarm is a solution. Swarm of particles is employed in PSO which seek out optima by traversing a multidimensional search space. All agents are searching and updating their position and speed, on the basis of their own experience and experience of all other agents.
3. IMPLEMENTATION OF PSO FOR ORPD
Objective Function
© 2019, IRJET | Impact Factor value: 7.34 | ISO 9001:2008 Certified Journal | Page 1425
function, I used basic Particle Swarm Optimization (PSO).Themain objective function is:
BB k N
ij j i j i k N k
kloss
g
v
v
v
v
cos
P
min
2 22
……..1
Where, NB = Total Number of Buses
NB k
kloss
P
= Total Active Power Losses in Transmission Line
k
g
= Conductance of Branch k (pu)vi,vj = Voltage magnitude (pu) of bus I and
j respectively
ij = Load Angle difference of bus I and j
(rad)
Equality Constant
So that Active power flow balance equations at all buses excluding slack bus is:
i N j ij ij ij ij j i digi
P
v
v
g
cos
B
sin
P
0
…..2 Reactive power flow balance equations at all PQ buses (load
buses)
i N j ij ij ij ij j i digi
Q
v
v
g
B
Q
cos
sin
0
….3 Inequality constraints:
Reactive Power Generation limit for each generator bus is:
max gi gi min
gi
Q
Q
Q
i
N
g
…...4 Voltage Magnitude limit for each bus
max gi gi min
gi
v
v
v
B
N
i
……..5 Power flow limit constraint of each transmission line
max l
l
s
s
……… 6 Static penalty function is used to deal with the limitations of inequality. The increased objective (fitness) function would
therefore be like
Function
Penalty
NB k kloss P
P
F
…..7
g B NLm lm N i i N i i
Ri
k
f
v
k
f
s
Q
f
k
1 3 1 2 2Function
Penalty
……… 84
.
APPLICATION
OF
PARTICLE
SWARM
OPTIMIZATION FOR ORPD
PSO was proposed by Eberhart and Kennedy, a quick, simple and efficient population-based optimization method. Each particle updates its position based on its own best position, best globally between the particles and its former speed vector in the following equations
k
i best k i best k i k
i
w
v
c
r
p
x
c
r
g
x
v
1
1
1
2
………..9
1
1
k i k i ki
x
v
x
..…..10 Where, 1 k iv : The velocity of th
i particle at (k1)thiteration
w : Inertia weight of the particle
k i
v : The velocity of th
i particle at kth iteration
1, 2
c c : Positive constants having values between [0, 2.5]
1, 2
r r : Randomly generated numbers between [0, 1]
i
best
p
: The best position of the ithparticle obtained based
upon its own experience
best
g : Global best position of the particle in the population
k i
x : The position of th
i particle at th
k iteration
: Constriction factor. It may help insure convergence.Appropriate weight selection provides a good balance between global and local exploration.
iter
iter
w
w
w
w
max min max max
…….11Where,
w
max = Value of inertia weight at the beginning of iterations,min
© 2019, IRJET | Impact Factor value: 7.34 | ISO 9001:2008 Certified Journal | Page 1426
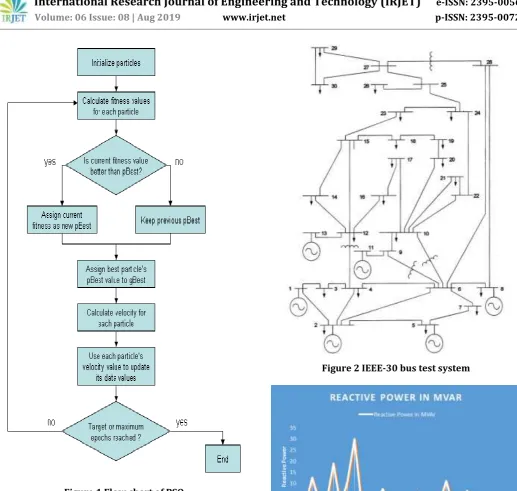
Figure 1 Flow chart of PSO5. RESULTS OF SIMULATION
The whole code of the PSO is implemented on IEEE 30 bus test system in MATLAB. For running the simulation here we use MATPOWER 3.2 version. The results will be saved in the "diary" file. Because PSO is a stochastic optimization method, each simulation produces different optimized results. Figure 2 shows the IEEE-30 bus test system which is used in this work
[image:4.595.309.547.58.414.2]Figure 2 IEEE-30 bus test system
[image:4.595.308.559.441.589.2]© 2019, IRJET | Impact Factor value: 7.34 | ISO 9001:2008 Certified Journal | Page 1427
Figure 4 Voltage Profile of IEEE-30 Bus system afteroptimization
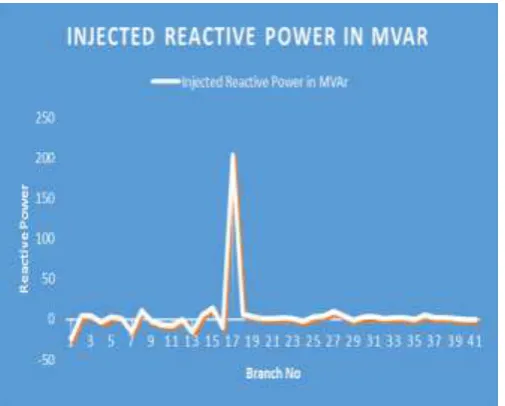
From the table 5 shows that the requirement of reactive power compensator should be at bus no 14, connected to branch 17. The estimated size of the compensator is also found that 204 MVAR.
Figure5: Injected Reactive Power Profile of IEEE-30 Bus System after Optimization
From the figure 6 it is clearly seen that the total active power losses get decreases with increasing the iteration
[image:5.595.37.290.401.604.2]
Figure 6: Convergence characteristic of PSO
6. CONCLUSION
Generally transmission system has various nodes where STATCOM can be placed. However, owing to the considerable cost of the FACTS device involved, it is important to find the optimal location and sizing (rating) of the device in a power system to obtain maximum benefits of the devicesWe calculated reactive power, real power and voltage for each branch for making objective function. Implementation of PSO on objective function to get optimal placement and size of reactive power compensating device on IEEE-30 bus system. The results will be saved in the "diary" file. Because PSO is a stochastic optimization method, each simulation produces different optimized results The Whole work is simulated in MATLAB software with the help of MATPOWER.PSO is implemented on IEEE 30 bus test system in MATLAB. For running the simulation here we use MATPOWER 3.2 version.
REFERENCES
[1] P. Kundur, “Power System Stability and Control’, Tata
McGraw Hill, 1994.
[2] Hingorani N.G. and Gyugyi L. Understanding FACTS:
concepts and technology of flexible ac transmission systems, New York: IEEE Press, 2000.
[3] Nitish Rawat Ashutosh Bhatt ; Pankaj Aswal IEEE 2013
International Conference on Power, Energy and Control (ICPEC)
[4] A. Karami · K. Mahmoodi Galougahi Improvement in
power system by using STATCOM and neural network
[5] Aysen Demiroren , Merve Guleryuz IEEE PSO
algorithm-based optimal tuning of STATCOM for voltage control in a wind farm integrated system 2011, 7th International Conference on Electrical and Electronics Engineering (ELECO)
[6] S. Varshney ; L. Srivastava 1 ; M. Pandit IET ,
© 2019, IRJET | Impact Factor value: 7.34 | ISO 9001:2008 Certified Journal | Page 1428
sizing of STATCOM , Conference: InternationalConference on Sustainable Energy and Intelligent Systems (SEISCON 2011)
[7] Sarika Varshney Manjaree Pandit ; Laxmi Srivastava
IEEE Optimal location and sizing of STATCOM for voltage security enhancement using PSO-TVAC 2011 International Conference on Power and Energy Systems
[8] Esmaeil Ghahremani ;Innocent Kamwa IEEE Optimal
placement of multiple-type FACTS devices to maximize power system loadability using a generic graphical user interface IEEE Transactions on Power Systems (Volume: 28, Issue: 2 , May 2013 )
[9] Masoud Farhoodnea Azah Mohamed Hadi
Zayandehroodi ieee Optimum D-STATCOM placement using firefly algorithm for power quality enhancement in 2013 IEEE 7th International Power Engineering and Optimization Conference (PEOCO
[10] Rahul Dubey ; Shishir Dixit Ganga Agnihotri Optimal
Placement of Shunt Facts Devices Using Heuristic Optimization Techniques IEEE 2014 Fourth International Conference on Communication Systems and Network Technologies
[11] E Ghahremani, I Kamwa Optimal allocation of
STATCOM with energy storage to improve power system performance -2014 IEEE PES T&D Conference and Exposition
[12] K.Karthikeyana, ,P.K.Dhal Transient Stability
Enhancement by Optimal Location and Tuning of STATCOM Using PSO ,ELSEVIER Procedia Technology Volume 21, 2015
[13] Garima Choudhary ; Niraj Singhal ; K. S. Sajan IEEE
Optimal placement of STATCOM for improving voltage profile and reducing losses using crow search algorithm
[14] 2016 International Conference on Control, Computing,
Communication and Materials (ICCCCM)
[15] Majid Moazzami ; Gevork B. Gharehpetian ; Hossein
Shahinzadeh ; Seyed Hossein Hosseinian IEEE Optimal locating and sizing of DG and D-STATCOM using Modified Shuffled Frog Leaping Algorithm 2017 2nd Conference on Swarm Intelligence and Evolutionary Computation (CSIEC)
[16] Bushra Weqar,Mohd Tauseef Khan &Anwar Shahzad
Siddiqui Optimal Placement of Distributed Generation and D-STATCOM in Radial Distribution Network TAYLOR FRANCIS Smart Science Volume 6, 2018 – Issue Pages 125-133 | Received 08 Aug 2017, Accepted 13 Nov 2017, Published online: 01 Dec 2017
[17] . . Kotha i, I. J. Norah Modern Power System Analysis [18] Pakize Erdogmus - 2018 Particle Swarm Optimization
with Application
[19] Matlab users guide, The Math Works, Inc., Natick, Ma,
USA, 2007
[20] Kennedy, J., “Small Wo lds and Mega-Minds: Effects of
Neighbourhood Topology on Particle Swarm e fo mance”, oceedings of the IEEE Cong ess on
Evolutionary Computation, vol. 3, pp. 1931-1938, Jul. 1999
[21] Kundur P, Paserba J, ‘Definition and Classification of
Power System Stability’, IEEE Transactions on Power Systems, vol. 19, no.2. May 2004, pp. 1387-1401.
[22] T. H. Chen, M. S. Chen, K. J. Hwang, P. Kotas, and E. A.
Chebli, “ ist ibution System owe Flow Analysis- A Rigid App oach”, IEEE T ansactions on owe elive y, Vol.6, no.3, pp.1146-1153, July1991
[23] Supanus K, Thansiphraserth W, Rugthaicharoencheep N,
Phayomhom A, External grounding design to reduce effects of lightning damage in distribution system, 7th IET International Conference on Power Electronics, Machines and Drives (PEMD 2014), Manchester, United Kingdom, 2014
[24] Thanasaksiri T, Improving the lightning performance of