Misleading Betas: An Educational Example
James Chong, California State University-Northridge, USADennis Halcoussis, California State University-Northridge, USA G. Michael Phillips, California State University-Northridge, USA
ABSTRACT
The dual-beta model is a generalization of the CAPM model. In the dual-beta model, separate beta estimates are provided for up-market and down-market days. This paper uses the historical “Anscombe quartet” results which illustrated how very different datasets can produce the same regression coefficients to motivate a discussion of the dual-beta model. Using data from 39 mutual funds, it is shown how very different dual-beta models can lead to the same CAPM beta estimates, much like the Anscombe quartet scenarios.
Keywords: CAPM; Beta; Dual-Beta; Anscombe
INTRODUCTION
he use of the standard Capital Asset Pricing Model (CAPM) beta to measure risk is well known and widely discussed in the finance literature (see, for example, Scholes and Williams, 1977; Todorov and Bollerslev, 2010). Lesser known is the concept of using asymmetric betas―estimating one value for an upswing in the market and another different value for downswings in the market (Chong, Pfeiffer, and Phillips, 2011). In fact, there is no reason to believe that one value for beta will accurately capture market risk for both an up- and down-market. The prevalent use of one estimate of a beta per stock or mutual fund for both up- and downturns in the market can lead investors to oversimplify the risk characteristics of the investment.
The misleading impression given to investors by the use of a single beta estimate for both up- and down-markets is analogous to Anscombe’s quartet, four very different data sets that produce the same set of regression results (Anscombe, 1973). In fact, the comparison of the two problems is more than analogous. The concept of dual-betas exploits the fact that data used to estimate a single overall beta can be divided into two separate, distinct subsets. One subset is from the up-market and another from the down-market, giving two different beta estimates that capture different levels of market risk for the stock or fund. Ignoring these differences in the data by estimating a single beta gives a misleading portrait of asset risk in the same way that different data sets can lead to the same regression results (as demonstrated by Anscombe’s quartet).
STANDARD CAPM MODEL
Beta has been shown by Fama and French (1992) to be an imperfect measure of investment risk. However, the standard CAPM model, which originally developed the idea of beta, is still popular among investment professionals and can be expressed as:
, (1) where is the risk-free rate (the overnight U.S. Federal funds rate is used as proxy), is the return on asset j,
is the observed excess return on asset j, is the estimated regression intercept, called alpha, is the estimated excess return on the market index (here, the S&P 500 Index), and is the unexplained portion of the model.
618 http://www.cluteinstitute.com/ © 2012 The Clute Institute DUAL-BETA MODEL
As an extension of the standard CAPM model, the dual-beta model estimates separately the parameters for up-market when the daily return for the market index is non-negative and down-market when the daily return for the market index is negative. The dual-beta model can thus be expressed as:
, (2) where , , , and are the estimated parameters for up-market and down-market days, respectively;
on days the market index did not decline and on days it did; D is a dummy variable, which takes the value of 1 when the market index daily return is non-negative and zero otherwise. If there is no asymmetry in beta, then the dual-beta model is identical to the standard CAPM model. In this study, the standard CAPM beta, up-market beta, and down-up-market beta are estimated using one-year daily returns as of September 16, 2011.
Chong, Pfeiffer, and Phillips (2011) had explored the dual-beta model’s efficacy in containing risk during stock market downturns and found it superior to the standard CAPM beta, while Chong and Phillips (2011) provided the theoretical basis for the relevance of the dual-beta model.
ANSCOMBE’S QUARTET
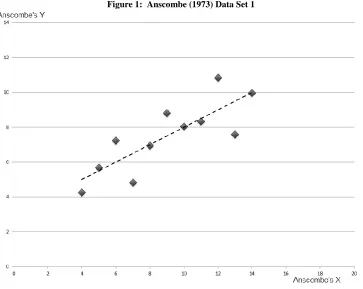
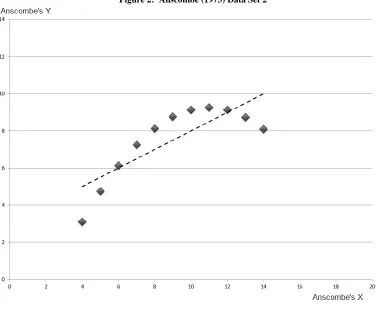
Anscombe (1973) gives four different data sets which all produce the same regression results. Figures 1 through 4 show the four different data sets for Anscombe’s quartet. All four data sets give the following results:
(3)
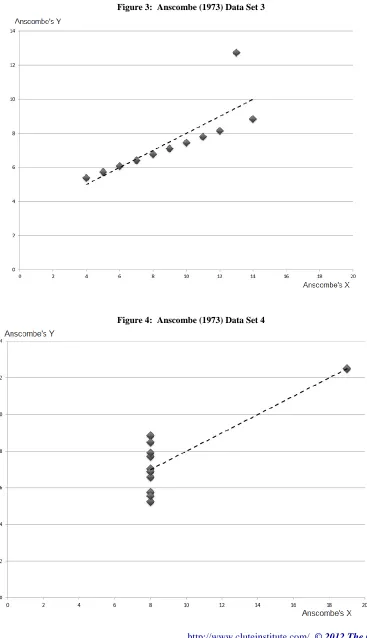
Clearly, Equation (3) does not adequately describe the data displayed in Figures 2 to 4, even though the results are accurate for all four figures. The data in Figure 2 would be better described by a non-linear equation than a simple linear regression model. If you take away the outlier in Figure 3, it looks like the intercept would be higher than 3 and the slope lower than 0.5. In Figure 4, most of the data points have the same X value and form a vertical line. Like Figure 3, only one point or outlier forces the regression to have the same outcome as the others. Only Figure 1 displays data that one would typically imagine after seeing Equation (3). Anscombe’s point is that just looking at regression results without a data plot or more information can mislead the reader.
620 http://www.cluteinstitute.com/ © 2012 The Clute Institute Figure 3: Anscombe (1973) Data Set 3
Figure 5 shows the up-market and down-market betas for 39 mutual funds. All 39 funds have an overall standard CAPM beta of 1.1. Figure 5 shows the great variety of up- and down-market betas that can result in a traditional beta with the same value. As discussed above, similar to Anscombe’s quartet, investors considering a stock or mutual fund can be misled by examining one value for beta for both up- and downturns in the economy. Consider two mutual funds - MCVIX (MFS Mid Cap Value Fund) and SSMAX (SEI Institutional Investment Trust-Small/Mid Cap Equity Fund). MCVIX and SSMAX are observations 8 and 9 in Figure 5, respectively. Both these mutual funds have an estimated beta of 1.1. Both funds have the same alphas - 0.02. MCVIX has both an up-market beta and down-up-market beta of 1.1, so, in this case, the overall beta estimate of 1.1 gives an accurate picture for both up- and down-markets. SSMAX has an up-market beta of 1.28 and a down-market beta of 0.086. An investor who just looked at the typical beta estimate for each fund would think they are the same in terms of risk. MCVIX exhibits the same risk whether it is an up- or down-market with a beta of 1.1, but SSMAX is a very different investment, even though it also has a standard CAPM beta of 1.1. Note that the differences in betas here are relatively conservative since mutual funds rather than stocks are being used.
CONCLUSION
In finance, the use of beta as a measure of risk is well-known. Not as well-known is the use of separate beta estimates for up- and down-markets. Using one beta estimate to measure risk, rather than looking at both an up-market beta estimate and a down-market beta estimate, can mislead investors. We provide mutual fund examples showing how the possible confusion arises and how this problem is analogous to the problem explored in Anscombe (1973) that very different data sets can lead to the exact same regression results.
622 http://www.cluteinstitute.com/ © 2012 The Clute Institute AUTHOR INFORMATION
James Chong, Ph.D., is a Professor and Associate Director of the Center for Financial Planning and Investment at California State University, Northridge. He also serves as a Research Economist at MacroRisk Analytics. He received his Ph.D. in Finance from the ICMA Centre, The University of Reading. E-mail: [email protected]
Dennis Halcoussis, Ph.D., is Professor of Economics at California State University, Northridge, where he teaches courses in econometrics and data analysis. He is the author of the popular textbook “Understanding Econometrics”
and is the author of numerous papers applying econometric methods to diverse economic topics. He received his Ph.D. from the University of Pennsylvania in 1992. E-mail: [email protected]
G. Michael Phillips, Ph.D., is the Director of the Center for Financial Planning and Investment and a Professor of Finance, Real Estate, and Insurance at California State University, Northridge. He also serves as Chief Scientist for MacroRisk Analytics. He received his Ph.D. from the University of California, San Diego, with specializations in econometrics and applied economics. E-mail: [email protected] (Corresponding author)
REFERENCES
1. Anscombe, Francis J. 1973. “Graphs in Statistical Analysis”, The American Statistician 27(1), 17-21. 2. Chong, James, Shawn Pfeiffer, and G. Michael Phillips. 2011. “Can Dual Beta Filtering Improve Investor
Performance?” Journal of Personal Finance 10 (1), 63-86.
3. Chong, James, and G. Michael Phillips. 2011. “Beta Measures Market Risk Except When It Doesn’t: Regime-Switching Alpha and Errors in Beta”, Journal of Wealth Management 14(3), 67-72.
4. Fama, Eugene F., and Kenneth French. 1992. “The Cross-Section of Expected Stock Returns”, Journal of Finance 47(2), 427-465.
5. Scholes, Myron, and Joseph Williams. 1977. “Estimating Betas from Nonsynchronous Data”, Journal of Financial Economics 5(3), 309-327.