Published online September 16, 2014 (http://www.sciencepublishinggroup.com/j/cmr) doi: 10.11648/j.cmr.s.2015040201.11
ISSN: 2326-9049 (Print); ISSN: 2326-9057 (Online)
Retinal structural changes in patients with mild cognitive
impairment
Demirtzoglou Iordanis
1, *, Tsolaki Magda
2, Gougoulias Kyriakos
3, Oikonomidis Panagiotis
4,
Karampatakis Vasileios
51
Fellow of European Board of Ophthalmology, Laboratory of Experimental Ophthalmology, Aristotle University of Thessaloniki, Thessaloniki, Greece
2
Department of Neurology, Aristotle University of Thessaloniki, Thessaloniki, Greece 3
Department of Psychiatry, Aristotle University of Thessaloniki, Thessaloniki, Greece 4
Department of Ophthalmology, Aristotle University of Thessaloniki, Thessaloniki, Greece 5
Director of Laboratory of Experimental Ophthalmology, Aristotle University of Thessaloniki, Thessaloniki, Greece
Email address:
[email protected] (D. Iordanis)
To cite this article:
Demirtzoglou Iordanis, Tsolaki Magda, Gougoulias Kyriakos, Oikonomidis Panagiotis, Karampatakis Vasileios. Retinal Structural Changes in Patients with Mild Cognitive Impairment. Clinical Medicine Research. Special Issue: Recent Research in Dementia.
Vol. 4, No. 2-1, 2015, pp. 1-7. doi: 10.11648/j.cmr.s.2015040201.11
Abstract:
Purpose: To assess retinal structural changes in persons with mild cognitive impairment (MCI) and to correlate these changes with the level of cognitive function. Material-methods: Using high-resolution spectral domain optical coherence tomography (SD-OCT) in MCI and control subjects we assess peripapillary Retinal Nerve Fiber Layer (RNFL) thickness loss, macular volume and macular thickness loss in all nine EDTRS (early treatment diabetic retinopathy study) areas, and macular Ganglion Cell Complex (GCC) (inner plexiform + ganglion cell layer + retinal nerve fiber) thickness loss. We assessed cognitive function using Mini Mental State Examination (MMSE) score. Results: In the study group there was found a statistically significant decrease in RNFL overall (Mann-Whitney test, p: 0.009) and temporal thickness (T-test, p: 0.013) and increased macular GCC Focal Volume Loss (FVL%) (Mann-Whitney test, p: 0.001) compared to the control group. In control group was also found a statistically significant positive correlation between retinal structural parameters and MMSE score. Conclusion: Our preliminary study results suggest that RNFL overall and temporal thickness in patients with MCI is significantly decreased compared to normal controls. GCC FVL% is significantly increased in patients with MCI compared to normal controls suggesting that there is macular focal loss of ganglion cells in MCI patients.Keywords:
Mild Cognitive Impairment, Mini Mental State Examination, Optical Coherence Tomography1. Purpose
To assess retinal structural changes in patients with mild cognitive impairment using high-resolution spectral domain optical coherence tomography (SD-OCT).
2. Introduction
Mild cognitive impairment (MCI) is a pre-clinical stage of Alzheimer’s disease. Visual symptoms are often among the earliest complaints of patients with AD [1], [2]. Testing of visual function in AD patients has revealed abnormalities in contrast sensitivity [3], [4] depth [5], motion [6], [7] and color perception [8]. In the past, visual impairments
It still remains unknown whether visual field defects in AD patients are related solely to the cortical disease or whether the disease extends to the optic nerve and retina [14]. Several studies [15], [16], [17] have noted abnormalities in pattern electroretinogram (PERG) consistent with retinal ganglion cell dysfunction in AD patients.
A depletion of retinal ganglion cells and their axons has been histologically observed in AD patients by Hinton et al [18]. Hinton et al observed no retinal neurofibrillary degeneration or amyloid angiopathy, which are typically seen in the brains of patients with Alzheimer's disease. The absence of these pathologic changes were confirmed later by various other studies [19], [20], [21], [22]. Morphometric analysis suggested that in many cases of Alzheimer's disease, the optic nerve showed predominant loss of the largest class of retinal ganglion cells (M-cells) that contribute large caliber fibers to the optic nerve [20]. Blanks et al [21] showed after detailed analyses of ganglion cell layer neurons at various eccentricities from the foveola that the greatest decrease in neuronal density (43% decrease) occurred in the central 0-0.5 mm (foveal region), while at 0.5-1 mm and at 1-1.5 mm eccentricities, neuronal loss amounted to 24 and 26%, respectively. The temporal region of the central retina appeared most severely affected, with up to 52% decrease in neuronal density near the foveola (central 0-0.5 mm eccentricity. Other pathologic studies did not confirm these results [23], [24]. Curcio et al [23] found no evidence for loss of ganglion cells within the central 43 degrees of vision in patients with AD. Curcio et al [23] found that the density of ganglion cells subserving the central 11 degrees of vision was reduced by one-fourth in both AD and control eyes compared with retinas from young adults, as was ganglion cell density in a wedge of nasal retina. Davies et al [24] found that there was no significant difference in the mean cross sectional neural area of AD compared with control optic nerves. Neither were there any significant differences between myelinated axon surface density, total axon number, or mean cross sectional axon area in AD compared with control optic nerves.
Fundus photographic methods have suggested that RNFL defects occurs in AD patients [25], [26].
A reduction of peripapillary RNFL thickness was observed using optical coherence tomography (OCT) in AD patients [27], [17], [28], [14], [29], [30], [44], [45], [46]. A correlation between total macular volume loss and level of cognitive impairment was observed in AD patients by Iseri et al [28].
Reduction of peripapillary RNFL thickness was observed using confocal scanning laser ophthalmoscopy but these results were not consistent with those of Kergoat et al [31] using the same method.
Iseri et al [28]concluded that the loss of retinal ganglion cell may be a primary process or a consequence of retrograde neurodegeneration occurring in AD patients. Berisha et al [14] studied retinal vein haemodynamic parameters and they observed statistically significant reduction of retinal vein blood column diameter and reduction of retinal blood flow
rate in early and moderate AD patients compared with age-matched controls. Berisha et al [14] speculate that the reduction of retinal blood flow has the same pathophysiology with the reduction of blood flow observed in AD.
AD is characterized by β-amyloid deposition in the wall of cerebral arteries and arterioles [32], [33], [34]. In AD patients has been demonstrated deposition of collagen in the walls of capillaries [35], [36] and veins [37], [38] resulting in narrowed lamina and even vessel occlusion. Deposition and accumulation of collagen type XVIII in the walls of cerebral arteries, arterioles, capillaries, venules and veins in AD patients was reported by Van Horssen et al [39]. They speculated that deposition of collagen type XVIII is associated with amyloid deposition in blood vessel walls. Berisha et al [14] suggested that the mechanisms leading to the reduced blood flow found in the retina in AD patients may be related to the mechanisms producing decreased cerebral blood flow in AD patients. Berisha et al [14] noted no correlation between peripapillary RNFL thickness and retinal vein flow rate in AD patients. Cerebral blood flow is also reduced in MCI patients [40], [41]. Whether reduced cerebral blood flow in MCI patients is accompanied or not by reduced retinal blood flow must be clarified [14]. In addition Berisha et al [14] observed that venous centerline speed was not significantly decreased in comparison to this of control group.
3. Methods and Material
Using high resolution SD-OCT (RTVue-100, Optovue) we sought to assess peripapillary Retinal Nerve Fiber Layer (RNFL) thickness loss, volume and thickness loss in all nine EDTRS (early treatment diabetic retinopathy study) macular areas, and macular Ganglion Cell Complex (inner plexiform + ganglion cell layer + retinal nerve fiber - GCC) thickness loss, and to correlate these findings with the level of cognitive impairment. We also sought to characterize a specific pattern of peripapillary RNFL thickness loss and macular EDTRS volume and thickness loss in order, if possible, to facilitate early diagnosis and follow up in MCI patients using high resolution SD-OCT.
thickness, MM5 macular scan parameters and GCC scan parameters were reported.
Cognitive impairment level is assessed by MMSE (Mini Mental State Examination) [42], FRSSD (Functional Rating Scale for Symptoms of Dementia), and GDS (Geriatric Depression Scale).
Patients with MCI, according to the criteria described in the Diagnostic and Statistical Manual of Mental Disorders (DSM - III) (American Psychiatric Association), were included in the study.
In the study were enrolled 59 eyes of 31 MCI patients (mean age 64.08 +- 8.8 years) and 20 eyes of 10 age-matched controls (mean age 60.1 +- 4 years). The general inclusion criteria for MCI patients and controls were no evidence of vascular dementia, no dismetabolic diseases, no psychiatric disorders, no psychotropic therapy, no other neurological diseases, no arterial hypertension, no history of alcohol abuse and no heart disease or other serious chronic conditions.
A complete ophthalmic examination including
best-corrected distance visual acuity, intraocular pressure (IOP) measured by Goldmann applanation tonometer, and pupil-dilated slit-lamp fundus biomicroscopy was performed in both eyes. Ocular inclusion criteria were best corrected visual acuity >8/10 with refractive error between +/- 3sph, intraocular pressure <18mmHg, absence of glaucoma, retinal detachment, absence or previous history of optic media opacity, cataract or early lens opacity, retinal vascular diseases, early age-related macular degeneration or other maculopathies and optic neuropathy.
4. Results
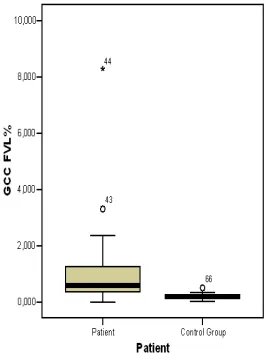
In the study group there was found a statistically significant decrease in overall RNFL thickness (Mann-Whitney test, p: 0.009) and temporal RNFL thickness (T-test, p: 0.013) and increased macular Ganglion Cell Complex Focal Volume Loss (FVL%) (Mann-Whitney test, p: 0.001) compared to the control group (Table 1, Fig 1-4).
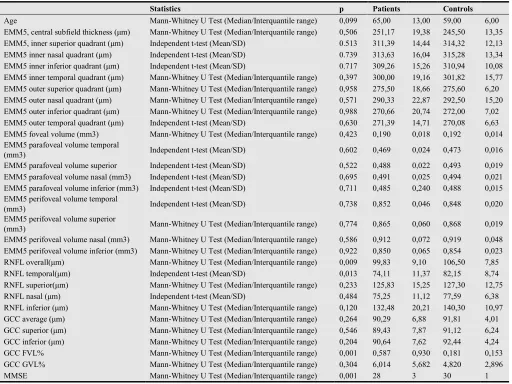
Table 1. RNFL overall thickness, RNFL temporal thickness, and MMSE (bold letters) were found significantly decreased in study group compared to control group. GCC FVL% (bold letters) was found significantly increased in patients compared to control group.
Statistics p Patients Controls
Age Mann-Whitney U Test (Median/Interquantile range) 0,099 65,00 13,00 59,00 6,00
EMM5, central subfield thickness (µm) Mann-Whitney U Test (Median/Interquantile range) 0,506 251,17 19,38 245,50 13,35
EMM5, inner superior quadrant (µm) Independent t-test (Mean/SD) 0.513 311,39 14,44 314,32 12,13
EMM5 inner nasal quadrant (µm) Independent t-test (Mean/SD) 0.739 313,63 16,04 315,28 13,34
EMM5 inner inferior quadrant (µm) Independent t-test (Mean/SD) 0.717 309,26 15,26 310,94 10,08
EMM5 inner temporal quadrant (µm) Mann-Whitney U Test (Median/Interquantile range) 0,397 300,00 19,16 301,82 15,77
EMM5 outer superior quadrant (µm) Mann-Whitney U Test (Median/Interquantile range) 0,958 275,50 18,66 275,60 6,20
EMM5 outer nasal quadrant (µm) Mann-Whitney U Test (Median/Interquantile range) 0,571 290,33 22,87 292,50 15,20
EMM5 outer inferior quadrant (µm) Mann-Whitney U Test (Median/Interquantile range) 0,988 270,66 20,74 272,00 7,02
EMM5 outer temporal quadrant (µm) Independent t-test (Mean/SD) 0,630 271,39 14,71 270,08 6,63
EMM5 foveal volume (mm3) Mann-Whitney U Test (Median/Interquantile range) 0,423 0,190 0,018 0,192 0,014
EMM5 parafoveal volume temporal
(mm3) Independent t-test (Mean/SD) 0,602 0,469 0,024 0,473 0,016
EMM5 parafoveal volume superior Independent t-test (Mean/SD) 0,522 0,488 0,022 0,493 0,019
EMM5 parafoveal volume nasal (mm3) Independent t-test (Mean/SD) 0,695 0,491 0,025 0,494 0,021
EMM5 parafoveal volume inferior (mm3) Independent t-test (Mean/SD) 0,711 0,485 0,240 0,488 0,015
EMM5 perifoveal volume temporal
(mm3) Independent t-test (Mean/SD) 0,738 0,852 0,046 0,848 0,020
EMM5 perifoveal volume superior
(mm3) Mann-Whitney U Test (Median/Interquantile range) 0,774 0,865 0,060 0,868 0,019
EMM5 perifoveal volume nasal (mm3) Mann-Whitney U Test (Median/Interquantile range) 0,586 0,912 0,072 0,919 0,048
EMM5 perifoveal volume inferior (mm3) Mann-Whitney U Test (Median/Interquantile range) 0,922 0,850 0,065 0,854 0,023
RNFL overall(µm) Mann-Whitney U Test (Median/Interquantile range) 0,009 99,83 9,10 106,50 7,85
RNFL temporal(µm) Independent t-test (Mean/SD) 0,013 74,11 11,37 82,15 8,74
RNFL superior(µm) Mann-Whitney U Test (Median/Interquantile range) 0,233 125,83 15,25 127,30 12,75
RNFL nasal (µm) Independent t-test (Mean/SD) 0,484 75,25 11,12 77,59 6,38
RNFL inferior (µm) Mann-Whitney U Test (Median/Interquantile range) 0,120 132,48 20,21 140,30 10,97
GCC average (µm) Mann-Whitney U Test (Median/Interquantile range) 0,264 90,29 6,88 91,81 4,01
GCC superior (µm) Mann-Whitney U Test (Median/Interquantile range) 0,546 89,43 7,87 91,12 6,24
GCC inferior (µm) Mann-Whitney U Test (Median/Interquantile range) 0,204 90,64 7,62 92,44 4,24
GCC FVL% Mann-Whitney U Test (Median/Interquantile range) 0,001 0,587 0,930 0,181 0,153
GCC GVL% Mann-Whitney U Test (Median/Interquantile range) 0,304 6,014 5,682 4,820 2,896
Figure 1. RNFL overall thickness box-plot graphic of patients group compared to control group (patients present decreased median compared to controls, p: 0.009)
Figure 2. RNFL temporal thickness box-plot graphic of patients group compared to control group (patients present decreased median compared to controls, p: 0.013)
Figure 3. GCC FVL% box-plot graphic of patient group compared to control group (patients present increased Ganglion Cell Complex Focal Volume Loss compared to controls, p: 0.001)
Figure 4. MMSE box-plot graphic of patient group compared to control group (patients present decreased MMSE score compared to controls p: 0.001)
There was also found a positive correlation between inner superior, inner nasal, inner inferior and inner temporal quadrant thickness, outer superior and outer temporal quadrant thickness, parafoveal volume of temporal, superior, nasal and inferior quadrant, perifoveal volume of temporal and superior quadrant, RNFL temporal quadrant thickness, GCC average thickness, GCC superior thickness and GCC Global Volume Loss (GVL%) and level of MMSE score in control group (Spearman’s rho). In MCI patients there was not found a positive correlation between those retinal structural parameters and level of MMSE score (Spearman’s rho).
5. Statistical Analysis
A database was created with the use of the Statistical Program for Social Sciences (SPSS® ver12). Descriptive Statistics were utilized to find means, medians, standard deviations and interquantile ranges. Statistical significance was set to 95%. Independent t-tests were used to compare means between patients and control group when variables reached normal distribution. Mann-Whitney U test was used to compare medians between patients and control group when variables did not reach normal distribution.
6. Discussion
ETDRS macular areas of AD patients was decreased compared to control subjects. They observed that decreased thickness was prominent in the nasal, temporal and inferior macular quadrants. Iseri et al [28] correlated the reduction of retinal volume in the ETDRS macular regions with the severity of AD. In AD patients macular volume was decreased compared to control subjects in all macular regions except the foveal minimum [28]. The reduction in macular volume of AD patients was statistically significant except in the nasal and inferior inner quadrants and temporal and superior outer quadrants of the macula and mean total macular volume was significantly reduced compared to control subjects [28].
Berisha et al [14] studying RNFL thickness loss with SD-OCT in patients with early and moderate AD observed that a statistically significant RNFL thinning was noted in the superior quadrant compared to the control subjects. They also observed that there were no significant differences in the inferior, temporal and nasal quadrants compared to control subjects and the correlation between superior RNFL thickness loss and retinal blood flow was not statistically significant. Berisha et al [14] speculate that the different pattern of RNFL thickness loss that they described is different from Parisi et al and Iseri et al because the two latter studies concluded patients with more advanced stage disease rather than early and moderate AD patients. In addition, Berisha et al [14] pretend that these differences suggest that the earliest retinal damage due to AD may be localized to the superior RNFL quadrant. They also pretend that their results are consistent with the inferior hemifield visual field defects detected by Trick et al [12]in AD patients. Berisha et al [14] refer that superior RNFL thinning suggests that field defects in AD patients may also be related to neuronal degeneration in the retina.
Yan Lu et al [29] using SD-OCT in early and moderate AD patients observed that RNFL thickness was significantly decreased in the superior and inferior RNFL quadrant compared to control subjects. RNFL thickness in the nasal and temporal quadrant was found decreased, but not significantly compared to control subjects [29]. Chi Y et al [30] using SD-OCT in AD patients observed statistically significant RNFL thickness loss in the superior quadrant, as Berisha et al [14]. They also noted that RNFL thickness loss is correlated positively to the severity of dementia in counter to Parisi et al [17] who noticed no correlation between RNFL thickness loss and severity of dementia.
Paquet et al [27] studying MCI and AD of early, moderate and advanced stage patients observed with the use of SD-OCT that RNFL thickness is significantly reduced in all stages of AD patients and also they did not observe statistically significant difference in RNFL thickness between MCI patients and early AD patients.
Kesler et al [44] studying retinal thickness in MCI and AD patients with SD –OCT found a decrease in RNFL thickness in MCI and AD patients compared to controls. In MCI cases significant RNFL decrease was observed in the inferior quadrant while the superior quadrant were significantly
thinner only in AD.
Moschos et al [45] studying structural and functional impairment of the retina and optic nerve in AD with the use of SD-OCT found a decrease in macular thickness and a decrease in superior and inferior RNFL thickness, as well as a decrease of the electrical activity of the macula, compared to controls.
Kirbas et al [46] studying retinal nerve fiber layer thickness in early untreated patients with AD using SD-OCT found a decrease in superior quadrant RNFL thickness, compared to controls.
Our preliminary study results suggest that overall and temporal RNFL thickness in patients with MCI is significantly decreased compared to normal controls. GCC FVL% is significantly increased in patients with MCI compared to normal controls suggesting that there is focal loss of ganglion cells in MCI patients. The pattern of RNFL thickness loss from our preliminary results is not consistent with any of the variety of patterns described from earlier studies probably because in this preliminary study we studied exclusively MCI and no early AD patients.
To our knowledge there is no other published study describing GCC layer changes in MCI and AD patients.
References
[1] Sadun AA, Borchert M, De Vita E, Hinton DR, Bassi CJ. Assessment of visual impairment in patients with Alzheimer’s disease. Am J Ophthalmol. 1987;104:113–120.
[2] Katz B, Rimmer S. Ophthalmic manifestations of Alzheimer’s disease. Surv Ophthalmol. 1989;34:31–43.
[3] Cronin-Golomb A, Corkin S, Rizzo JF, Cohen J, Growdon JH, Banks KS. Visual dysfunction in Alzheimer’s disease: relation to normal aging. Ann Neurol. 1991;29:41–52.
[4] Gilmore GC, Whitehouse PJ. Contrast sensitivity in Alzheimer’s disease: a 1-year longitudinal analysis. Optom Vis Sci. 1995;72:83–91.
[5] Mendez MF, Cherrier MM, Meadows RS. Depth perception in Alzheimer’s disease. Percept Mot Skills. 1996;83:987–995.
[6] Trick GL, Silverman SE. Visual sensitivity to motion: age-related changes and deficits in senile dementia of the Alzheimer type. Neurology. 1991;41:1437–1440.
[7] Gilmore GC, Wenk HE, Naylor LA, Koss E. Motion perception and Alzheimer’s disease. J Gerontol. 1994;49:52– 57.
[8] Cronin-Colomb A. Vision I Alzheimer’s disease. Gerontologist,1995; 35:370-376
[9] Lewis DA, Campbell MJ, Terry RD, Morrison JH. Laminar and regional distributions of neurofibrillary tangles and neuritic plaques in Alzheimer’s disease: a quantitative study of visual andauditory cortices. J Neurosc. 1987;7:1799–1808.
[11] Rizzo JF 3rd, Cronin-Golomb A, Growdon JH, et al. Retinocalcarine function in Alzheimer’s disease: a clinical and electrophysiological study. Arch Neurol. 1992;49:93–101.
[12] Trick GL, Trick LR, Morris P, Wolf M. Visual field loss in senile dementia of the Alzheimer’s type. Neurology. 1995;45:68 –74.
[13] Armstrong RA. Visual field defects in Alzheimer’s disease patients may reflect differential pathology in the primary visual cortex. Optom Vis Sci. 1996;73:677–682.
[14] F.Berisha,G.T. Feke, C.L. Trempe, J.W. Mcmeel, C.L. Schepens, Retinal abnormalities in early Alzheimer’s disease, Invst. Ophthalmol. Vis Sci 48 (2007) 2285-2289
[15] Trick GL, Barris MC, Bickler M. Abnormal pattern electroretinograms in patients with senile dementia of the Alzheimer type. Ann Neurol. 1989;26:226–231.
[16] Katz B, Rimmer S, Iragui V, Katzman R. Abnormal pattern electroretinogram in Alzheimer’s disease: evidence for retinal ganglion cell degeneration? Ann Neurol. 1989;26:221–225.
[17] Parisi V, Restuccia R, Fattapposta F, Mina C, Bucci MG, Pierelli F. Morphological and functional retinal impairment in Alzheimer’s disease patients. Clin Neurophysiol. 2001;112:1860–1867.
[18] Hinton DR, Sadun AA, Blanks JC, Miller CA. Optic-nerve degeneration in Alzheimer’s disease. N Engl J Med. 1986;315:485–487.
[19] Blanks JC, Hinton DR, Sadun AA, Miller CA. Retinal ganglion cell degeneration in Alzheimer’s disease. Brain Res. 1989;501:364–372.
[20] Sadun AA, Bassi CJ. Optic nerve damage in Alzheimer’s disease. Ophthalmology. 1990;97:9 –17.
[21] Blanks JC, Torigoe Y, Hinton DR, Blanks RH. Retinal pathology in Alzheimer’s disease. I. Ganglion cell loss in foveal/parafoveal retina. Neurobiol Aging. 1996;17:377–384.
[22] Blanks JC, Schmidt SY, Torigoe Y, Porrello KV, Hinton DR, Blanks RH. Retinal pathology in Alzheimer’s disease. II. Regional neuron loss and glial changes in GCL. Neurobiol Aging. 1996;17:385–395.
[23] Curcio CA, Drucker DN. Retinal ganglion cells in Alzheimer’s disease and aging. Ann Neurol. 1993;33:248–257.
[24] Davies DC, McCoubrie P, McDonald B, Jobst KA. Myelinated axon number in the optic nerve is unaffected by Alzheimer’s disease. Br J Ophthalmol. 1995;79:596–600.
[25] Tsai CS, Ritch R, Schwartz B, et al. Optic nerve head and nerve fiber layer in Alzheimer’s disease. Arch Ophthalmol. 1991;109: 199–204.
[26] Hedges TR 3rd, Perez Galves R, Speigelman D, Barbas NR, Peli E, Yardley CJ. Retinal nerve fiber layer abnormalities in Alzheimer’s disease. Acta Ophthalmol Scand. 1996;74:271– 275.
[27] Paquet C, Boissonnot M, Roger F, Dighiero P, Gil R, Hugon J. Abnormal retinal thickness in patients with mild cognitive impairment and Alzheimer’s disease. Neuroscience Letters. 2007;420(2):97–99.
[28] Iseri PK, Altinas T, Yuksel N. Relationship between cognitive impairment and retinal morphological and visual functional
abnormalities in Alzheimer disease. J Neuroophthalmol. 2006;26:18 –24.
[29] Lu Y, Li Z, Zhang X, Ming B, Jia J, Wang R, Ma D. Retinal nerve fiber layer abnormalities in early Alzheimer’s disease: Evidence in optical coherence tomography. Neurosci Lett. 2010 Aug 9;480(1):69-72.
[30] Chi Y, Wang YH, Yang L. The investigation of retinal fiber loss in Alzheimer’s disease. Zhonghua Yan Ke Za Zhi. 2010 Feb;46(2):134-9.
[31] Kergoat H, Kergoat MJ, Justino L, Chertkow H, Robillard A, Bergman H. An evaluation of the retinal nerve fiber layer thickness by scanning laser polarimetry in individuals with dementia of the Alzheimer type. Acta Ophthalmol Scand. 2001;79:187–191.
[32] Ellis RJ, Olichney JM, Thal LJ, et al. Cerebral amyloid angiopathy in the brains of patients with Alzheimer’s disease: the CERAD experience, Part XV. Neurology. 1996;46:1592– 1596.
[33] Vinters HV, Wang ZZ, Secor DL. Brain parenchymal and microvascular amyloid in Alzheimer’s disease. Brain Pathol. 1996;6:179–195.
[34] Jellinger KA. Alzheimer disease and cerebrovascular pathology: an update. J Neural Transm. 2002;109:813–836.
[35] Kalaria RN, Pax AB. Increased collagen content of cerebral microvessels in Alzheimer’s disease. Brain Res. 1995;705:349–352.
[36] De Jong GI, De Vos RA, Steur EN, Luiten PG. Cerebrovascular hypoperfusion: a risk factor for Alzheimer’s disease?—animal model and postmortem human studies. Ann NY Acad Sci. 1997; 826:56–74.
[37] Brown WR, Moody DM, Thore CR, Challa WR. Cerebrovascular pathology in Alzheimer’s disease and leukokraurosis. Ann NY Acad Sci. 2000;903:39–45.
[38] Brown WR, Moody DM, Challa VR, Thore CR, Anstrom JA. Venous collagenosis and arteriolar tortuosity in leukokraurosis. J Neurol Sci. 2002;203–204:159–163.
[39] Van Horssen J, Wilhelmus MM, Heljasvaara R, et al. Collagen XVIII: a novel heparan sulfate proteoglycan associated with vascular amyloid depositions and senile plaques in Alzheimer’s disease brains. Brain Pathol. 2002;12:456–462.
[40] Johnson KA, Jones K, Holman BL, et al. Preclinical prediction of Alzheimer’s disease using SPECT. Neurology. 1998;50:1563–1571.
[41] Maalikjy Akkawi N, Borroni B, Agosti C, et al. Volume cerebral blood flow reduction in pre-clinical stage of Alzheimer disease: evidence from an ultrasonographic study. J Neurol. 2005;252:559-563 Zhonghua Yan Ke Za Zhi. 2010 Feb;46(2):134-9. Chinese.
[42] Folstein MF, Folstein SE, McHugh PR. “Mini-Mental State”: a practical method for grading the cognitive state of patients for the clinician. J Psychiatr Res. 1975;12:189–198.
[44] Kesler A, Vakhapova V, Korczyn AD, Naftaliev E, Neudorfer M Retinal thickness in patients with mild cognitive impairment and Alzheimer's disease. Clin Neurol Neurosurg. 2011 Sep;113(7):523-6.
[45] Moschos MM, Markopoulos I, Chatziralli I, Rouvas A, Papageorgiou SG, Ladas I, Vassilopoulos D. Structural and functional impairment of the retina and optic nerve in
Alzheimer's disease. Curr Alzheimer Res. 2012 Sep;9(7):782-8.