R E S E A R C H
Open Access
In-silico interaction-resolution pathway
activity quantification and application
to identifying cancer subtypes
Sungwon Jung
From
The ACM Ninth International Workshop on Data and Text Mining in Biomedical Informatics
Melbourne, Australia. 23 October 2015
Abstract
Background:Identifying subtypes of complex diseases such as cancer is the very first step toward developing highly customized therapeutics on such diseases, as their origins significantly vary even with similar physiological characteristics. There have been many studies to recognize subtypes of various cancer based on genomic signatures, and most of them rely on approaches based on the signatures or features developed from individual genes. However, the idea of network-driven activities of biological functions has gained a lot of interests, as more evidence is found that biological systems can show highly diverse activity patterns because genes can interact differentially across specific molecular contexts.
Methods:In this study, we proposed an in-silico method to quantify pathway activities with a resolution of genetic interactions for individual samples, and developed a method to compute the discrepancy between samples based on the quantified pathway activities.
Results:By using the proposed discrepancy measure between sample pathway activities in clustering melanoma gene expression data, we identified two potential subtypes of melanoma with distinguished pathway activities, where the two groups of patients showed significantly different survival patterns. We also investigated selected pathways with distinguished activity patterns between the two groups, and the result suggests hypotheses on the mechanisms driving the two potential subtypes.
Conclusions:By using the proposed approach of modeling pathway activities with a resolution of genetic interactions, potential novel subtypes of disease were proposed with accompanying hypotheses on subtype-specific genetic interaction information.
Background
Since the emergence of high throughput genomic profil-ing techniques, genomic profile data became a primary source of information in recognizing the various statuses of complex diseases. Cancer is one of such complex dis-eases, where even tumors from the same tissue locations can have strikingly diverse molecular mechanisms for their origins. Such high heterogeneity in cancer is one of the main obstacles in treatment, as different driving
mechanisms may require different therapeutic approaches to repair their abnormality. For this reason, identifying subtypes of cancer with different functional mechanisms is very important for improving their successful diagnosis and treatment.
One of the popular approaches to recognizing the subtypes of cancer is clustering the gene expression data of patient samples (for example, [1–7]), as expression data can give a comprehensive snapshot of transcription activ-ities for whole genes. Many clustering studies consider each gene as a feature for clustering, assuming the expres-sion levels of individual genes are factors that discriminate
Correspondence:[email protected]
Department of Genome Medicine and Science, Gachon University School of Medicine, Incheon 21565, Republic of Korea
the different subtypes of cancer. However, the main draw-back of such approaches is that they focus on individual genes, while a set of interacting genes constitutes a functional module in many real biological systems. For this reason, using individual genes as features often suffer with the issue of low reproducibility, which indicates the expression levels of genes reflect only some part of discrepancy residing between different subtypes.
In order to overcome such limitation, utilizing known pathway information together with the expression data can be a promising approach. Considering that a joint prob-ability distribution of a set of variables can give a compre-hensive picture of its pattern, an ideal approach is modeling the joint probability distribution that describes the combinatorial gene expression levels within a pathway. However, this approach is not practical due to the complexity of the model to represent the joint probability distribution, and the lack of available data to infer such complex models with sufficient reliability. Hence, most of the methods to utilize pathway information focus on specific features of pathways rather than considering the complete joint probability distributions. Characterizing individual samples with pathway information and applying it to clustering achieved limited success, while there is a recent study that proposed a method called PARADIGM [8], which infers patient-specific gene activities from multi-dimensional genomic data using known genetic interactions from pathways. PARADIGM can convert multiple genomic data of a gene from a sample into a single aggregated value called IPA, which represents the summarized activity level of the gene for the sample and it is evaluated in consideration of genetic interactions from pathway information. The computed IPA values of genes can be used for clustering instead of their raw expression values, but it still represents the activity levels of individual genes rather than the activity levels of pathways.
In this study, a method was proposed to compute the dissimilarity between two gene expression samples based on features that represent pathway activity patterns. Unlike conventional methods, our proposed method converts a gene-level matrix (for example, gene expres-sion matrix) to a pathway-level matrix, where each cell in the matrix represents a pathway activity pattern for a sample. We applied the proposed sample dissimilarity measure to clustering of cancer samples, where the RNA-Seq data of 267 melanoma patients from The Cancer Genome Atlas (TCGA) was clustered based on their pathway activities. Two patient groups of potential subtypes were identified with clear difference in their survival patterns, where they were associated with different stages of melanoma. Investigation on selected pathway activity patterns across two patient groups suggested hypotheses on different functional mecha-nisms driving two potential subtypes.
Methods
Our approach is based on an assumption that the activity pattern of a pathway for a sample can be represented with the probability distribution of the genetic network likeli-hoods from the pathway, which is computed from the given gene expression data. A sample pathway activity vector (PAV), which represents the comprehensive picture of all pathway activities of a single sample, is represented as a collection of pathway activities for all pathways for the sample. A pathway activity vector distance (PAVd) is proposed as a discrepancy measure between two sample pathway activity vectors, which represents the dissimilarity between the two samples from the perspective of path-ways. AsPAVdis a distance metric (this will be discussed in the following subsections), arbitrary clustering methods and cluster validation indexes can be used for clustering and quality evaluation. Details of this formulation will be given in the following subsections.
Pathway activity distribution
We compute the activity of a pathway for a sample by approximating the probability distribution of genetic networks from the pathway. Specifically, the pathway activity distribution Pr(PAi,sj) of a pathway PAi for a
samplesjis computed from the following steps:
Step 1)ConsiderPAias a discrete random variable that
has a finite set ofNgenetic network structures
g1,g2,…,gNas its possible values.
Step 2) Compute the likelihood Lk=P(gk|sj) for each
genetic network gk for sample sj. The
collec-tion of likelihoods [L1, L2… LN-1, LN] for N
genetic network structures constitutes the pathway activity distribution Pr(PAi, sj) of
pathwayPAifor a samplesj.
Compared to the idea of computing a single scalar-valued activity for a pathway, our approach of computing the pathway activity as a probability distribution is a generalized version of such idea. From this generalization of considering multiple genetic networks, it is expected to achieve more reliable measurement of pathway activities than the idea of computing a single scalar-valued activity.
In computing the pathway activity distribution Pr(PAi,sj),
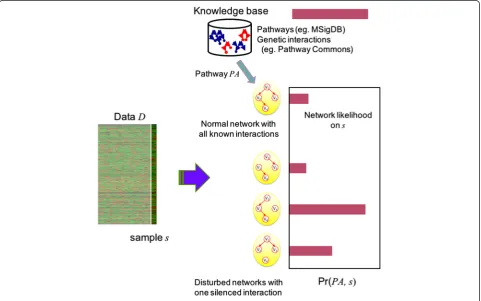
we utilize existing knowledge base on pathways and gene regulatory interactions. Instead of enumerating all possible genetic network structures forPAi, a selected list of
candi-date genetic networks are considered in reference with a knowledge base of choice, to compute Pr(PAi, sj). The list
based on an idea that disruption of a pathway by external variables (for example, regulation by miRNA, epigenetic changes, gene copy number variation) can be repre-sented withsilencingcertain genetic interactions within the pathway. As a result, a normal network and disturbed networks with one silenced interaction are considered as possible values of PAi. The schematic
outline of this approach is illustrated in Fig. 1.
To compute the likelihoodLk=P(gk|sj) for each genetic
networkgkfor samplesj, we model a genetic network with
a Bayesian network structure assuming discrete random variables as its nodes. The computation of likelihood is done using the Bayesian Dirichlet equivalence uniform (BDeu) scoring method [9]. However, the direct computa-tion of likelihoods with only single sample yields uniform likelihoods for all samples as the BDeu scoring method considers each instance (sample) of variables with the same preference, especially with the uniform prior assumption. For this reason, we take an indirect approach to compute likelihoods, with the following formulation:
P gkjsj
¼ BDeu gkjD
BDeu gkjD− sj
ð1Þ
where D represents the collection of all samples. Even though we use the Bayesian network model assuming
discrete random variables, our formulation is independent of model choices. Thus other network and random variable models can be also used as long as the likelihood of a network structure can be computed based on the model of preference.
Sample pathway activity vector
The sample pathway activity vector PAV(sj, PA) of
sample sj for a set of A pathways PAis defined with a
vector of pathway activity distributions as follows:
PAV sði;PAÞ ¼< PrðPA1;siÞ;PrðPA2;siÞ;…;PrðPAA;siÞ> ð2Þ
For A pathways and S samples, the pathway activity distribution matrixRis defined as aA×Smatrix, where a cell R(i, j) corresponds to a pathway activity distribu-tion Pr(PAi,sj) of a pathwayPAifor a samplesj. In other
words, R is a collection of column vectors PAV(sj, PA)
forSsamples.
Discrepancy measure between two sample pathway activity vectors
If a column vector in a pathway activity distribution matrix
R is a scalar-valued vector with each pathway activity represented with a scalar value, conventional distance
measures (such as Euclidean distance) assuming ordinary scalar-valued vectors can be used to evaluate the discrepancy between two samples. In our approach of representing the pathway activity with a discrete prob-ability distribution Pr(PAi, sj), the representation of
sample pathway activityPAV(sj, PA) of a samplesjfor a
set ofApathways is a vector of probability distributions as shown in Eq. (2). As each element of a pathway activity vector PAV(sj, PA) is a probability distribution
rather than a scalar value, a new method is necessary to compute the distance between two vectors of probability distributions PAV(sl, PA) and PAV(sm, PA) from two
samplesslandsm.
We designed a new distance measure pathway activity vector distance (PAVd) to compute the distance between two vectors of discrete probability distributionsPAV(sl,PA)
andPAV(sm,PA), which is defined as follows:
PAVd PAV sð ðl;PAÞjjPAV sðm;PAÞÞ
¼XAi¼1 ffiffiffiffiffiffiffiffiffiffiffiffiffiffiffiffiffiffiffiffiffiffiffiffiffiffiffiffiffiffiffiffiffiffiffiffiffiffiffiffiffiffiffiffiffiffiffiffiffiffiffiffiffiffiJSðPrðPAijslÞÞjjPrðPAijsmÞ
p ð3Þ
where JS is the Jensen-Shannon divergence. The Jensen-Shannon divergence is a symmetrized version of the Kullback-Leibler divergence, and a popular method of measuring the similarity between two prob-ability distributions. Note that PAVd is a metric, as it satisfies the four required properties – non-negativity, identity of indiscernibles, symmetry and triangle inequality.
Corollary 1.PAVdsatisfies a property, the non-negativity.
Proof. The Jensen-Shannon divergence JS of two probability distributions is a non-negative value.
∴PAVd PAV sð ðl;PAÞjjPAV sðm;PAÞÞ
¼XAi¼1 ffiffiffiffiffiffiffiffiffiffiffiffiffiffiffiffiffiffiffiffiffiffiffiffiffiffiffiffiffiffiffiffiffiffiffiffiffiffiffiffiffiffiffiffiffiffiffiffiffiffiffiffiffiffiJ SðPrðPAijslÞjjPrðPAijsmÞÞ p
≥0 ð4Þ
Corollary 2. PAVd satisfies a property, the identify of indiscernibles.
Proof. PAVd(PAV(sl, PA) || PAV(sm, PA)) is a sum of
non-negative values from Eq. (3). Thus, PAVd(PAV(sl,
PA) ||PAV(sm,PA)) = 0 requiresJS(Pr(PAi|sl) || Pr(PAi
|sm)) to be 0 for alli. As the square root of the
Jensen-Shannon divergence is a metric [10, 11], JS(Pr(PAi |sl)
|| Pr(PAi | sm)) = 0 if and only if Pr(PAi | sl) = Pr(PAi |
sm). If Pr(PAi | sl) = Pr(PAi | sm) for all i, then PAV(sl,
PA) =PAV(sm,PA).
∴PAVd PAV sð ðl;PAÞjjPAV sðm;PAÞÞ
¼0 if and only ifPAV sðl;PAÞ ¼PAV sðm;PAÞ: ð5Þ
Corollary 3.PAVdsatisfies a property, symmetry.
Proof.The Jensen-Shannon divergence JS is a symme-trized version of the Kullback-Leibler divergence.
∴PAVd PAV sð ðl;PAÞjjPAV sðm;PAÞÞ
¼PAVd PAV sð ðm;PAÞjjPAV sðl;PAÞÞ ð6Þ
Corollary 4.PAVdsatisfies a property, triangle inequality.
Proof. Consider three sample pathway activity vector
PAV(sl,PA),PAV(sm,PA) andPAV(sn,PA). As the square
root of the Jensen-Shannon divergenceJSis a metric, the following is true for alli:
ffiffiffiffiffiffiffiffiffiffiffiffiffiffiffiffiffiffiffiffiffiffiffiffiffiffiffiffiffiffiffiffiffiffiffiffiffiffiffiffiffiffiffiffiffiffiffiffiffiffiffiffiffi J SðPrðPAijslÞjjPrðPAijsnÞÞ p
≤ JSffiffiffiffiffiffiffiffiffiffiffiffiffiffiffiffiffiffiffiffiffiffiffiffiffiffiffiffiffiffiffiffiffiffiffiffiffiffiffiffiffiffiffiffiffiffiffiffiffiffiffiffiffiffiffiðPrðPAijSlÞjjPrðPAljsmÞÞ
p
þ J SffiffiffiffiffiffiffiffiffiffiffiffiffiffiffiffiffiffiffiffiffiffiffiffiffiffiffiffiffiffiffiffiffiffiffiffiffiffiffiffiffiffiffiffiffiffiffiffiffiffiffiffiffiffiffiðPrðPAijsmÞjjPrðPAijsnÞÞ
p
ð7Þ
Thus, the following is also true: XA
i¼1
ffiffiffiffiffiffiffiffiffiffiffiffiffiffiffiffiffiffiffiffiffiffiffiffiffiffiffiffiffiffiffiffiffiffiffiffiffiffiffiffiffiffiffiffiffiffiffiffiffiffiffiffiffiffi J SðPrðPAijSlÞjjPrðPAijsnÞÞ p
≤XAi¼1 ffiffiffiffiffiffiffiffiffiffiffiffiffiffiffiffiffiffiffiffiffiffiffiffiffiffiffiffiffiffiffiffiffiffiffiffiffiffiffiffiffiffiffiffiffiffiffiffiffiffiffiffiffiffiffiJSðPrðPAijSlÞjjPrðPAijsmÞÞ p
þXAi¼1 ffiffiffiffiffiffiffiffiffiffiffiffiffiffiffiffiffiffiffiffiffiffiffiffiffiffiffiffiffiffiffiffiffiffiffiffiffiffiffiffiffiffiffiffiffiffiffiffiffiffiffiffiffiffiffiJ SðPrðPAijSmÞjjPrðPAijsnÞÞ p
ð8Þ
∴PAVd PAV sð ðl;PAÞjjPAV sðn;PAÞÞ
≤PAVd PAV sð ðl;PAÞjjPAV sðm;PAÞÞ þPAVd PAV sð ðm;PAÞjjPAV sðn;PAÞÞ
ð9Þ
Theorem 1.PAVdis a distance metric.
Proof. From Corollary 1 to 4, PAVd satisfies the four properties of metric.
By using this distance metric PAVd with conventional clustering algorithms, we can group samples based on the sample pathway activities.
Utilizing pathway information
We collected 1932 filtered gene sets of canonical path-ways, Gene Ontology (GO) biological process and mo-lecular functions from MSigDB [12], where each gene set has up to 50 genes, and used them as pathways in our study. The gene sets from MSigDB do not include genetic interaction information. For genetic interaction information, 854,464 human genetic interactions were obtained from Pathway Commons [13], and genes in each pathway were interconnected based on the ob-tained genetic interactions.
Analysis of TCGA melanoma RNA-Seq data
and 1 (expressed) using SIBER [14]. A sample path-way activity vector has been computed for each of the 267 patient samples, and a pathway activity distri-bution matrix R was built as a result. Using PAVd as a distance measure between sample pathway activity vectors that correspond to the columns of R, hier-archical clustering with complete linkage was applied to Rto find groups of patients.
Results
Identification of two patient groups from the clustering result
Figure 2 shows the dendrogram from the result of applying hierarchical clustering to the pathway activity distribution matrixRof the TCGA melanoma RNA-seq data. After vis-ual inspection, we identified two groups of patients, Group I and II. Based on the sample annotations regarding the stage of melanoma, we also computed what stages of melanoma cases are significantly enriched in each group of patients. Table 1 lists the number of patients in each group as well as the number of associated stage I-IV cases. From the entire 267 patients, 40 patients were classified as Stage I, and 18 of them were included in Group I (p-value =0.0362). In Stage I of melanoma, cancer has formed on skin, but tumor is not present in deep skin. Thus it represents relatively early stage of melanoma prognosis. Regarding Group II, there were 52 patients classified as Stage II among the 267 patients, and 24 of them were included in this group of patients (p-value =0.0049). When melanoma is in Stage II, it indicates that the tumor is in deeper skin than Stage I, with possible ulceration. Thus this stage indicates a more progressed status of melanoma. The absolute numbers of Stage I patients and II patients in these two groups may not be high, but Group I represents patients with earlier stage of (or less aggressive) melanoma while Group II represents patients with relatively later stage of (or more aggressive) melanoma. This observation can be confirmed in the following subsection.
Survival analysis of identified patient groups
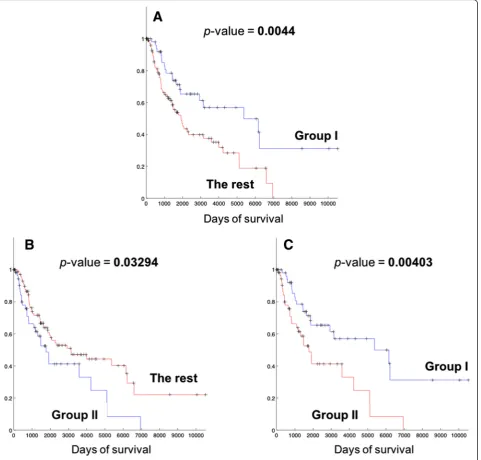
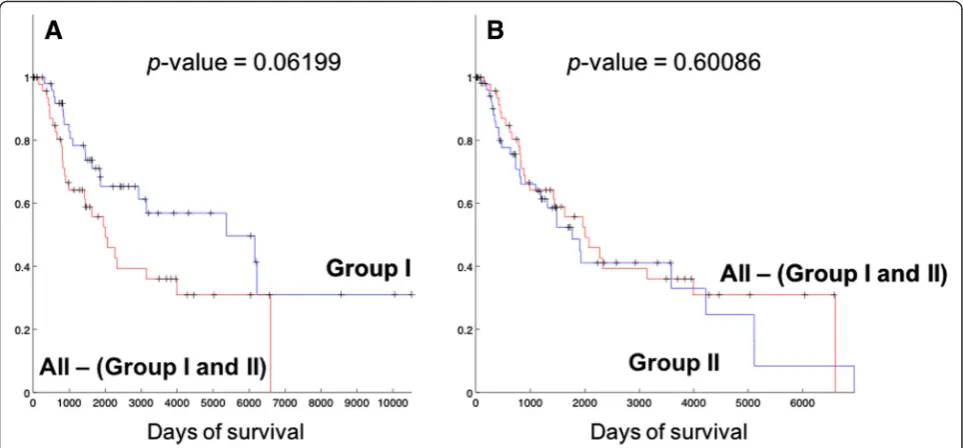
We compared the survival lengths of patients in each group, and Kaplan-Meier (KM) curves from the com-parison are shown in Fig. 3. Table 2 also lists the survival statistics on patient groups including Group I and II. From Fig. 3(a) and Table 2, it is clear that patients in Group I show better prognosis than the rest of the patients (statistical significance p-value =0.0044), with much longer median survival length (4254 days) than the rest of the patients. Patients in Group II have relatively shorter survival (median survival length of 1625.5 days) than the rest of the patients, but the main difference is with the patients in Group I (Fig. 3(c)) ra-ther than with the patients ora-ther than Group I and II (All patients – (Group I and II patients), Fig. 4(b)). In comparison, the patients of Group I still show longer survival patterns than the patients that do not belong to the two groups (Fig. 4(a)). This suggests that Group I is a distinguished patient group compared to other pa-tients, with clearly longer survival lengths, while Group II may have different biological mechanisms of melan-oma compared to other patients while they do not show clearly different survival patterns.
Discussion
We compared the pathway activity patterns between Group I and II, and two pathways with distinguished ac-tivity patterns were selected for further investigation. The first pathway was a GO gene setRegulation of
Cell-Fig. 2The result of applying hierarchical clustering to the 267 melanoma patient samples, using their computed sample pathway activities.
Two groups of patients (Group I and II) were visually identified
Table 1Identified two groups of patients and their melanoma stages
Group I Group II
Number of patients 90 85
Stage I 18 (p=0.0362) 7 (p= 0.9764)
Stage II 11 (p= 0.9779) 24 (p=0.0049)
Stage III 16 (p= 0.4976) 18 (p= 0.1623)
Stage IV 2 (p= 0.3258) 2 (p= 0.2889)
Fig. 3Kaplan-Meier (KM) plots of comparing survival patterns of Group I, II and the rest of the patients other than each group. Censored cases are indicated with marks.P-values were computed from the log-rank test of two survival patterns.aComparison between Group I (90 patients) and the rest of the patients (177 patients).bComparison between Group II (85 patients) and the rest of the patients (182 patients).cComparison between Group I and II
Table 2Survival statistics of identified patient groups
Patient group Number of patients Median survival (days) Comparison versus the rest of the patients
Hazard ratio p-value (log-rank test)
Group I 90 4,254 0.6298 0.0044
Group II 85 1,625.5 2.3281 0.03294
All–(Group I∪Group II) 92 1,982 0.7150 0.46775
Cell Adhesionwith one genetic interaction from Pathway
Commons, and the second pathway was a DNA
Fragmentationpathway with eight genetic interactions. Difference between Group I and II, based on regulation of cell-cell adhesion
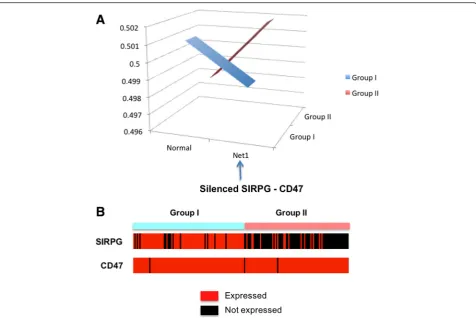
From each group, we computed the average pathway ac-tivity distribution Pr(Regulation of Cell-Cell adhesion, Group) by averaging the likelihoods of considered genetic networks across the samples within the group. Figure 5(a) shows the average activity pattern of the Regulation of Cell-Cell adhesionpathway, where Group I patients have higher likelihood of “Normal” genetic network while Group II patients have higher likelihood for a network with a missing SIRPG–CD47 interaction. TheRegulation of Cell-Cell adhesion pathway is involved in cell-cell adhesion biology, which is a mechanism to bind a cell to a surface, such as an extracellular matrix or another cell. CD47 is a ligand for the SIRP protein family, and SIRP-gamma can bind to CD47. As mentioned earlier, the tumors from the Group II patients are more advanced (or aggressive) melanoma, where cancer cells show more break-in through skin tissues. As can be seen in Fig. 5(b), the ligand CD47 shows consistent expression across two groups of patients while SIRPG is not expressed in Group II patients. This suggests that the regulation of cell-cell adhesion might have been dis-turbed with silencing of the SIRPG –CD47 interaction through inhibited SIRPG, and it can be one of the mechanisms that cause tumor cells on the surface of
skin to break-in toward deeper placements in the later stage melanoma.
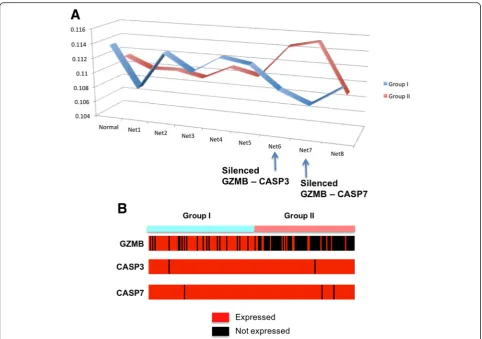
Difference between Group I and II, based on DNA Fragmentation
We also compared the average pathway activity patterns of theDNA Fragmentpathway between Group I and II. Figure 6(a) shows the average activity distribution of the
DNA Fragmentation pathway, where Group I patients have higher likelihood of “Normal” genetic network. This suggests that the genetic interactions in the DNA Fragmentation pathway are better preserved in Group I patient tumors than the case of Group II, indicating Group II patients may have more abnormal activities of the DNA fragmentation mechanism. The DNA fragmenta-tion pathway is one of the mechanisms that can be utilized during the immune response process, where immune cells send signals into target cells and cause apoptosis through the fragmentation of DNA in the target cells. From the pathway activity patterns in Fig. 6(a), two genetic network cases with two silenced genetic interactions (Net6 with a missing GZMB – CASP3 interaction, and Net7 with a missing GZMB – CASP7 interaction) are assigned with higher likelihoods from Group II than Group I. GZMB is expressed by cytotoxic T lymphocytes (CTL) and natural killer (NK) cells, and it is crucial for the rapid induction of target cell apoptosis. CASP3 and CASP7 are caspases, and their sequential activation plays a central role in the execution-phase of cell apoptosis. From Fig. 6(b), CASP3 and CASP7 are expressed from both of Group I and II
Fig. 4KM plots of comparing survival patterns of Group I and II with the other patients that do not belong to either Group I or II
patients, but GZMB is generally being inhibited in Group II patient tumors. These silenced interactions between GZMB and caspases genes suggest that the DNA fragmen-tation mechanism of immune cells has been restricted in Group II patients, resulting suppressed immune response. This hypothesis is consistent with the comparison of Group I and II, where Group II is enriched with later stage of melanoma cases and show worse survival patterns.
Conclusions
We proposed a method to represent the complete pathway activity patterns of individual gene expression samples based on collected pathway information. By using each pathway activity as a feature rather than using individual genes, we formulated a distance meas-ure PAVd that can compute the discrepancy between two gene expression samples in the scope of activity patterns of entire pathways. The proposed method of sample pathway activity quantification and computing distances based on the quantified activities has several potential benefits, as active biological mechanisms from individual samples can be more easily interpreted than
using individual gene-based approaches. Compared to previous pathway evaluation methods such as GSEA [12] or PARADIGM, the proposed method of computingPAV
provides unique functional benefit of analyzing single-sample pathway activities with a resolution of genetic in-teractions (Table 3), whilePAVstill needs to be extended to incorporate multiple types of genomic data. By applying the proposed method to cluster gene expression data of melanoma patients, we identified two potential subtypes of melanoma with distinguished pathway activity patterns. The two identified groups of patients showed distinctive survival patterns, and we suggested two hypotheses on biological mechanisms that can distinguish and potentially drive the two subtypes. This was possible because of our novel formulation on pathway activity considering genetic interactions, and we believe that there are much more potential applications of this approach as all components of the analysis–pathways, genetic interactions and etc.– are defined based on probabilistic models and can be eas-ily extended with additional features. The two identified patient groups from this study correlate with stages of the disease, but each group still includes patients with
Fig. 5TheRegulation of Cell-Cell adhesionpathway showing distinguished activity patterns between Group I and II.aAveraged pathway activity
multiple different stages. This implies that disease-driving biological mechanisms can reside across different stages of disease progression, and the proposed method contributes to identify such mechanisms.
We are considering several directions for future studies. From our current study, we modeled the pathway activity patterns with a genetic network of normal status and genetic networks with only one missing interactions. Even though we showed a successful application of our formu-lation in this study, it will be definitely beneficial to con-sider genetic networks with more than one missing
interactions, which leads to the generalization of the formulation with up to K missing interactions. We can also develop methods to quantitatively evaluate the abilities of pathways in discerning different clusters. As our formulation of the distance measure satisfies the properties of metric, we can incorporate the ideas of many conventional cluster validation indexes to evaluate the quality of clusters based on individual pathways. Lastly, we considered only gene expression data in our study, but integrating multiple types of genomic data in evaluation of pathway activity patterns and computing the effect of latent environment variables on pathways can be a promising direction to extend our current models.
Ethics approval and consent to participate Not applicable.
Consent for publication Not applicable. Table 3Functional difference of the proposedPAVcompared
to previous pathway evaluation methods
Interaction-resolution
Multi-type data integration
Single sample evaluation
GSEA No No No
PARADIGM No Yes Yes
PAV Yes No Yes
Fig. 6TheDNA Fragmentationpathway showing distinguished activity patterns between Group I and II.aAveraged pathway activity patterns
for each Group I and II.“Normal”indicates the average likelihood of a genetic network with all interactions, across the samples of each group.
Availability of data and materials
All the data used in this article were obtained from public sources as cited.
Competing interests
The author declares that he has no competing interests.
Authors’contributions
SJ designed the theoretical formulation, and implemented the algorithm. SJ conducted the analysis, summarized results and wrote the manuscript.
Declarations
The publication cost of this article was supported by a grant of the Korea Health Technology R&D Project through the Korea Health Industry Development Institute (KHIDI), funded by the Ministry of Health & Welfare, Republic of Korea (grant number : HI15C1593).
This article has been published as part of BMC Medical Informatics and Decision Making Volume 16 Supplement 1, 2016: Proceedings of the ACM Ninth International Workshop on Data and Text Mining in Biomedical Informatics. The full contents of the supplement are available online at https://bmcmedinformdecismak.biomedcentral.com/articles/supplements/ volume-16-supplement-1.
Published: 18 July 2016
References
1. de Souto MC, Costa IG, de Araujo DS, Ludermir TB, Schliep A. Clustering cancer gene expression data: a comparative study. BMC Bioinformatics. 2008;9:497.
2. Getz G, Gal H, Kela I, Notterman DA, Domany E. Coupled two-way clustering analysis of breast cancer and colon cancer gene expression data. Bioinformatics. 2003;19(9):1079–89.
3. Liu W, Yuan K, Ye D. On alpha-divergence based nonnegative matrix factorization for clustering cancer gene expression data. Artif Intell Med. 2008;44(1):1–5.
4. Mukhopadhyay A, Bandyopadhyay S, Maulik U. Multi-class clustering of cancer subtypes through SVM based ensemble of pareto-optimal solutions for gene marker identification. PLoS One. 2010;5(11):e13803.
5. Pal NR, Aguan K, Sharma A, Amari S. Discovering biomarkers from gene expression data for predicting cancer subgroups using neural networks and relational fuzzy clustering. BMC Bioinformatics. 2007;8:5.
6. Sorlie T, Tibshirani R, Parker J, Hastie T, Marron JS, Nobel A, Deng S, Johnsen H, Pesich R, Geisler S, et al. Repeated observation of breast tumor subtypes in independent gene expression data sets. Proc Natl Acad Sci U S A. 2003;100(14):8418–23.
7. Zhiwen Y, Le L, Jane Y, Hau-San W, Guoqiang H. SC(3): triple spectral clustering-based consensus clustering framework for class discovery from cancer gene expression profiles. IEEE/ACM Trans Comput Biol Bioinform. 2012;9(6):1751–65.
8. Vaske CJ, Benz SC, Sanborn JZ, Earl D, Szeto C, Zhu J, Haussler D, Stuart JM. Inference of patient-specific pathway activities from multi-dimensional cancer genomics data using PARADIGM. Bioinformatics. 2010;26(12):i237–45. 9. Buntine W. Theory refinement on bayesian networks. In: The 7th
Conference on Uncertainty in Artificial Intelligence. Burlington: Morgan Kaufmann Publishers; 1991. p. 52–60.
10. Endres DM, Schindelin JE. A new metric for probability distributions. IEEE Trans Inf Theory. 2003;49(7):1858–60.
11. Osterreicher FVI. A new class of metric divergences on probability spaces and its applicability in statistics. Ann Inst Stat Math. 2003;55(3):639–53. 12. Subramanian A, Tamayo P, Mootha VK, Mukherjee S, Ebert BL, Gillette MA,
Paulovich A, Pomeroy SL, Golub TR, Lander ES, et al. Gene set enrichment analysis: a knowledge-based approach for interpreting genome-wide expression profiles. Proc Natl Acad Sci U S A. 2005;102(43):15545–50. 13. Cerami EG, Gross BE, Demir E, Rodchenkov I, Babur O, Anwar N, Schultz N,
Bader GD, Sander C . Pathway Commons, a web resource for biological pathway data. Nucleic Acids Res. 2011;39(Database issue):D685–90. 14. Tong P, Chen Y, Su X, Coombes KR. SIBER: systematic identification of
bimodally expressed genes using RNAseq data. Bioinformatics. 2013;29(5):605–13.
• We accept pre-submission inquiries
• Our selector tool helps you to find the most relevant journal • We provide round the clock customer support
• Convenient online submission • Thorough peer review
• Inclusion in PubMed and all major indexing services • Maximum visibility for your research
Submit your manuscript at www.biomedcentral.com/submit