Functional single nucleotide
polymorphism-based association studies
Victoria E.H. Carlton, James S. Ireland, Francisco Useche and Malek Faham*
ParAllele BioScience (Now Affymetrix, Inc), 7300 Shoreline Boulevard, South San Francisco, CA 94080, USA
*
Correspondence to: Tel:
þ
1 650 228 7405; Fax:
þ
1 650 228 7437; E-mail: [email protected]
Date received (in revised form): 23rd March 2006
Abstract
Association studies hold great promise for the elucidation of the genetic basis of diseases. Studies based on functional single nucleotide
polymorphisms (SNPs) or on linkage disequilibrium (LD) represent two main types of designs. LD-based association studies can be
comprehensive for common causative variants, but they perform poorly for rare alleles. Conversely, functional SNP-based studies are
efficient because they focus on the SNPs with the highest
a priori
chance of being associated. Our poor ability to predict the functional effect
of SNPs, however, hampers attempts to make these studies comprehensive. Recent progress in comparative genomics, and evidence
that functional elements tend to lie in conserved regions, promises to change the landscape, permitting functional SNP association studies
to be carried out that comprehensively assess common and rare alleles. SNP genotyping technologies are already sufficient for such studies,
but studies will require continued genomic sequencing of multiple species, research on the functional role of conserved sequences and
additional SNP discovery and validation efforts (including targeted SNP discovery to identify the rare alleles in functional regions). With
these resources, we expect that comprehensive functional SNP association studies will soon be possible.
Keywords:
functional SNPs, association studies, human disease
Introduction
Association studies of common, complexly inherited human
diseases have the potential to provide us with insights into
causes of enormous human suffering.
1While thousands of
such studies have been published (typically using single
nucleotide polymorphisms [SNPs]), only a handful of these
finding have been clearly and consistently replicated. While
some findings are doubtless real,
2debate continues over most.
There are only a small number of genetic variants that have
been clearly and consistently associated with a common
disease, many of which are listed in Table 1.
Types of association studies
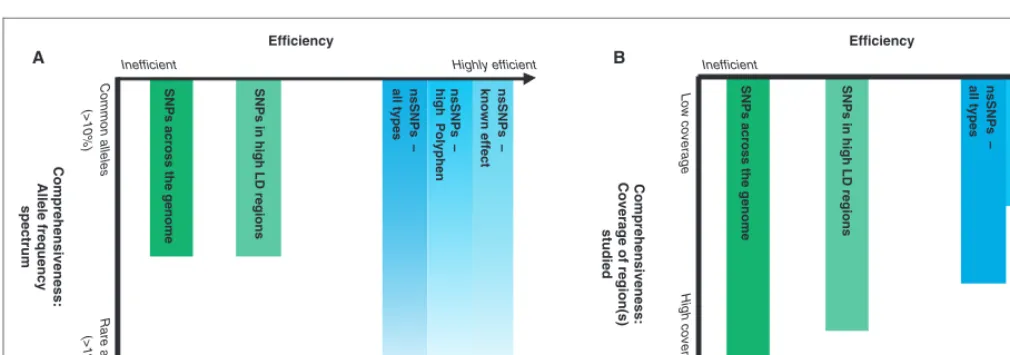
Researchers, typically, carefully weigh comprehensiveness
and efficiency in designing an association study. A highly
comprehensive study would assess every variant in the
region(s) under study, regardless of type, location and allele
frequency. A highly efficient study would be designed to
reduce costs, including genotyping and/or multiple testing
costs. Genotyping costs can be saved by determining which
SNPs are in linkage disequilibrium (LD). For example, if you
knew that two SNPs were in complete LD in the specific
population of interest, you would only need to genotype one
to assess them both. Multiple testing costs can be reduced by
only looking at SNPs with a high
a priori
chance of being
associated. Note that as multiple testing correction should
account for the effective number of independent tests
performed, genotyping only one of two SNPs in complete LD
does not reduce multiple testing costs; if the SNPs are in
complete LD, only one effective independent test is being
performed, regardless of whether one or two SNPs are
genotyped (Bonferroni correction is overly conservative).
As ‘per SNP’ genotyping costs continue to fall, it seems likely
that multiple testing costs will become the predominant
concern in efficiency. Therefore, we discuss efficiency in terms
of the
a priori
likelihood for an SNP to be associated with the
phenotype studied.
Different types of large-scale association studies and the
balance they strike are shown in Figure 1, although, obviously,
many studies are hybrids of these types. These approaches,
which have been applied to candidate genes, regions and
recently to the whole genome,
21,76are discussed in detail below,
Ta
ble
1.
Some
clear
,c
onsistent
common
disease
associations.
Gene
Disease
Pr
esumed
causati
ve
variant
Functional
effect
Appr
ox
imate
fr
equency
(in
ethnic
population
of
first
positiv
es
tudy)
Fre
quency
information
for
other
populations
aPTPN22
Rheumatoid
arthritis
3–1 3R620W
nsSNP
9–1
0%
(Caucasi
an)
3– 130%
in
n
¼
1,600
Japanese;
0%
in
n
¼
60
Africans
3,14–T
ype
1
diabetes
7,9,15 –2 0––
––
CFH
(factor
H)
Macular
degeneration
21 –2 6Y402H
nsSNP
30
–4
0%
(Caucasians)
21 –2 6Unknown
FV
(factor
5)
Deep
ve
nous
thr
ombosis
27 –3 4R506W
nsSNP
3–7
%(
Caucasians)
350%
in
n
¼
800
from
Africa,
South-East
Asia,
Australasia
and
the
Americas
(Nativ
e)
35,36F2
(pr
othr
Re-sequencing
When there is strong
a priori
evidence that a gene may be
involved in a disease, it is possible to sequence that gene in
cases and controls.
43,80,81This requires no prior knowledge of
variants in the region and allows researchers comprehensively
to evaluate all variants in a gene, regardless of their allele
frequency. Usually, it is necessary to group the very rare
variants (
,
1 per cent) for power considerations.
43,80,81While
this approach is now possible for one or a few candidate genes,
it is by no means comprehensive across the genome and
dramatic reductions in sequencing costs are necessary for its
implementation on a large scale.
82 – 84LD
Given the high rate of LD in the genome, many variants do
not need to be directly genotyped in order to be assessed.
They may instead be assessed by genotyping another SNP in
high LD. The goal of LD-based (‘tagging’) approaches is to test
a sufficient number of common SNPs so that SNPs that are
not directly tested are assessed through their high correlation
with the genotyped SNPs. This can create efficiency in
genotyping but does not reduce multiple testing costs
(as discussed previously, multiple testing corrections should
account for the effective number of independent tests, rather
than the number of SNPs genotyped). Additionally, the
efficiency of the approach is modest, since there is a low
a
priori
chance that a specific assessed SNP is associated with
disease. By focusing only on regions with high LD (in which a
single SNP is likely to tag several other SNPs), one improves
the efficiency because there is an increased likelihood for
any assessed SNP (ie for one test) to be tagging a functional
SNP that is associated with the phenotype of interest.
75Tagging allows most common SNPs to be comprehensively
assessed in linkage regions,
85candidate genes
86or the whole
genome.
87Tagging, however, is not comprehensive in terms
nsSNPs
–
high
Polyphen
nsSNPs
–
known
effect
nsSNPs
–
all
types
SNPs
in
high
LD
regions
SNPs
across
the
genome
nsSNPs
–
high
Polyphen
nsSNPs
–
all
types
SNPs
in
high
LD
regions
Highly efficient Inefficient
Efficiency
Highly efficient Inefficient
Comprehensiveness:
Allele
frequency
spectrum
Common
alleles
(>10%)
A B
Rare
alleles
(>1%)
Low
coverage
High
coverage
Comprehensiveness:
Coverage
of
region(s)
studied
SNPs
across
the
genome
nsSNPs
–
known
effect
Efficiency
Figure 1.
Association study approaches: Efficiency versus comprehensiveness. Studies vary in their efficiency (the
a priori
likelihood of
of allele frequencies because it tends to work poorly on rare
polymorphisms.
88 – 92Given the clear importance of rare
polymorphisms (Box 1), this presents a substantial drawback.
While some analytical work suggests that long haplotypes may
be used to achieve a degree of ‘tagging’ of the rare allele, this
comes with a dramatic multiple testing cost.
106The adequate
assessment of rare alleles requires direct interrogation.
Functional SNPs
Functional variants are the most likely to be associated with
diseases (in fact, non-functional variants should only be
associated secondary to LD); therefore, genotyping studies
using only functional SNPs are relatively efficient. Since these
variants are directly assessed, these studies are comprehensive
in terms of allele frequency, covering rare and common
variants present in the databases or discovered during focused
SNP discovery. Our poor ability to predict functional SNPs,
however, means that this approach is generally far from
comprehensive in terms of coverage of the region under study.
Nevertheless, by focusing on the most obvious classes of
potentially functional SNPs, such as those causing
non-synonymous changes in proteins, researchers have had
notable successes with association studies in candidate genes
107or linkage regions.
3,22It is now possible to apply this method
on a genome-wide scale,
75,108which increases
comprehen-siveness with some reduction in efficiency.
Extending the (potentially)
functional SNP approach
There are many attractive features of the functional SNP
approach, including its efficiency and ability to assess rare and
common alleles. Additionally, a positive association
automatically provides a candidate causative polymorphism.
A major criticism of the functional approach is its lack of
comprehensiveness,
96and extending the coverage has been
difficult, given our poor ability to predict functional SNPs.
We can, however, broadly define functional SNPs as SNPs in
any class predicted to have an above-average chance of having
a functional effect. Recent progress in comparative genomics
is likely to dramatically increase the comprehensiveness of this
approach.
Box 1. Common variant/common disease versus rare variant/common disease
For the purposes of this review, we use the standard definition of a polymorphism as a variant whose minor allele frequency (MAF) is
above 1 per cent, and define common alleles/polymorphisms as those with MAF
.
10 per cent, rare alleles/polymorphisms as those
with MAF 1–10 per cent and very rare alleles/variants as those with MAF
,
1 per cent. In the past decade, there has been substantial
debate over the importance of common alleles versus rare alleles (or even very rare variants) in common, complex human diseases.
Theoretical work has been used to argue all points of view: that causative common disease alleles are most likely common alleles, or
rare alleles, or very rare alleles.
93 – 95One key argument for common alleles relies on the perceived greater practical difficulties in studying rare alleles rather than
common alleles. First, analysis methods are particularly sensitive to genotyping errors of rare alleles and rare alleles have been
particularly prone to genotyping errors.
96,97Recent improvements in genotyping technologies, however, dramatically lessen these
concerns.
98,99Secondly, rare alleles are more likely to be population specific and therefore are more likely to generate spurious
associations due to population substructure. Again, improvements, this time to analytical methods, allow us to detect and adjust for
these artifacts.
100,101Thirdly, it has been argued that the power to detect associations with rare alleles appears low when compared
with that to detect common alleles. While this is certainly true if one assumes the same genotypic relative risk, this assumption is
arbitrary, and if one instead uses another arbitrary assumption of equal population attributable risk, then the power to detect rare
alleles would be significantly better than that for common alleles. Probably, a more reasonable approach is to consider a specific genetic
effect size (eg defined by likelihood of the odds (LOD) score in sibling-pair analysis) of a locus and assume that causative alleles
gener-ate this specific effect size.
102Given this assumption, the power to detect common and rare alleles is fairly similar (data not shown).
Finally, rare alleles are difficult to ‘tag’ and therefore need to be assessed directly, creating two problems: alleles must be in databases
in order to be assessed and genotyping all of the rare alleles in the genome would be at least an order of magnitude larger than
con-templated for the linkage disequilibrium (LD)-based approach for common alleles. These concerns, while substantial, may be addressed
by single nucleotide polymorphism (SNP) discovery and focusing genotyping efforts on rare SNPs that are also potentially functional.
One theoretical argument for rare alleles is that purifying selection should keep the frequency of deleterious functional alleles low.
Indeed, in a study of approximately 30,000 non-synonymous SNPs, we confirmed previous observations that SNPs predicted by
PolyPhen
103,104to be damaging have significantly lower allele frequencies than SNPs predicted to be benign. This effect is largely due to
an enrichment of damaging SNPs in the MAF
,
10 per cent category.
105Below, we address some traditional functional elements
(non-synonymous, splicing and promoter SNPs), as well as
functional sequences emerging from the study of genome
conservation.
Non-synonymous
The most obvious class of potentially functional SNPs is those
causing non-synonymous changes in proteins (nsSNPs). Over
60 per cent of known Mendelian disease mutations and almost
all the consistent, common disease mutations in Table 1
involve nsSNPs.
109While there is a clear ascertainment bias
for studying and confirming associations with nsSNPs, they
are inarguably important in disease.
Additional evidence that many nsSNPs are functional and
subject to selection comes from candidate gene sequencing
studies, which find that 60 per cent of the expected number of
nsSNPs are missing.
110,111Furthermore, nsSNPs have lower
minor allele frequencies than do synonymous SNPs.
110,111When we examined all coding SNPs currently in the SNP
database (dbSNP), we also found a dearth of nsSNPs; these
are expected to comprise two-thirds of coding SNPs
111but
instead comprised less than one-half (20,463 nsSNP out of
42,387 coding SNPs). The deficiency of nsSNPs was even
more notable when the analysis was limited to conserved
coding regions in which only one-third of SNPs were
non-synonymous (8,828 of 23,397). (SNP definitions were
derived from the Ensembl database, and conserved regions
were as defined previously.
112)
Large-scale studies of nsSNPs maintain high efficiency
while allowing reasonable coverage.
75One could choose to
further increase efficiency (and decrease comprehensiveness)
by limiting a study only to nsSNPs with a high predicted
likelihood of being damaging. A substantial proportion of such
SNPs have already been implicated in human disease.
103,113Splicing
Perhaps the next most obvious class of potentially functional
variants is SNPs around splice junctions. Mutations that affect
splicing underlie 15 per cent of mutations in Mendelian
diseases and hence are likely to play some role in common
diseases.
114Splicing is catalysed by weakly conserved 5
0and 3
0splice
sites and a branch site, as well as exonic and intronic enhancers
and silencers. Sites far from splice junctions can affect splicing,
and a few mutations in these distant sites have been shown to
cause human disease.
115 – 120It appears, however, that most
control of splicing lies in the 20 base pairs (bp) flanking each
side of exon–intron boundaries.
120These regions contain a
high density of splicing enhancers (SEs),
120have fewer SNPs
than sequences further from splice junctions
120and contain
most of the known splicing mutations.
114We find that these
sequences are significantly conserved and have a relative dearth
of SNPs (Table 2).
Rather than testing all SNPs within the vicinity of a
splice junction, one could increase efficiency by limiting the
analysis to SNPs specifically predicted by computational
models to affect splicing.
121,122Conversely, one can increase
comprehensiveness by assessing SEs beyond 20 bp of splice
junctions. SEs are most prevalent in exons.
123,124Some
synonymous SNPs have also been shown to alter splicing.
122Several programs are now available to predict SEs.
125,126In addition to SNPs within 20 bp of the junction, the
interrogation of synonymous SNPs predicted to disrupt SE
activity
126increases study comprehensiveness.
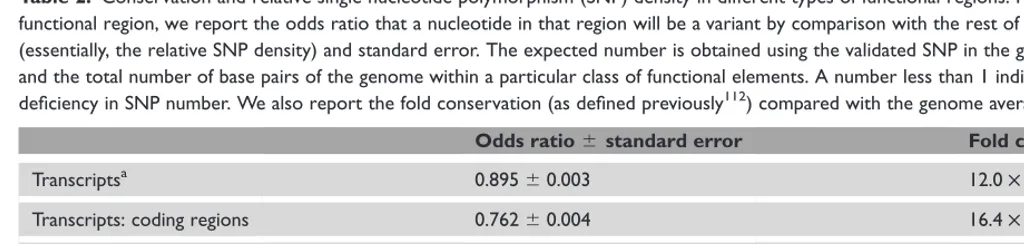
Table 2.
Conservation and relative single nucleotide polymorphism (SNP) density in different types of functional regions. For each
functional region, we report the odds ratio that a nucleotide in that region will be a variant by comparison with the rest of the genome
(essentially, the relative SNP density) and standard error. The expected number is obtained using the validated SNP in the genome (4.9 M)
and the total number of base pairs of the genome within a particular class of functional elements. A number less than 1 indicates a
deficiency in SNP number. We also report the fold conservation (as defined previously
112) compared with the genome average.
Odds ratio
^
standard error
Fold conservation
Transcripts
a0.895
^
0.003
12.0
£
Transcripts: coding regions
0.762
^
0.004
16.4
£
Transcripts: non-coding
1.072
^
0.004
6.2
£
Conserved elements
b0.748
^
0.002
23.5
£
Promoter
c0.995
^
0.005
3.5
£
Splice junctions
d0.780
^
0.007
10.3
£
aIncludes coding regions and untranslated regions (including RNA genes). All SNPs and the definitions of gene elements were obtained from the Ensembl database (http://www.ensembl.org/).
bDefined previously112and obtained from the University of California, Santa Cruz website (http://genome.ucsc.edu/). cWithin 500 base pairs (bp) upstream of the transcription start site.
Promoters
Promoters are
cis-elements that lie upstream of transcription
start sites and are responsible for transcription initiation.
127The existence of regulatory variants affecting transcription
has long been established
128,129and that have been shown to
play a role in human disease.
130,131Even though the exact promoter sequence may not be
easily discerned, recent work has shown that the 500 bp
upstream from the transcription start site is almost always able
to function as a promoter.
132Defining the promoter, however,
requires determining the 5
0end of transcripts, which is
typically done experimentally and hence is laborious.
133 – 135As shown in Table 2, conservation in the promoter sequences
is threefold higher than expected.
In addition to promoters, numerous other
cis-acting
elements (for example enhancers) contribute to gene
regulation. These elements have been more difficult to identify
because they can lie within coding sequences, introns or as
far as 1 megabase away.
120,136,137Defining these elements is
a main goal of the ENCODE project.
138Genomic work
aimed at identifying transcription factor binding sites and
other regulatory sequences experimentally and informatically
is ongoing,
87,139,140and study of conserved sequences holds
promise for the identification of these regions.
Conserved sequences
Computational efforts have consistently found that
approxi-mately 5 per cent of the human genome shows conservation
with other species.
112,141 – 148Although some regions may be
conserved due to low mutation rates, clearly many, and
perhaps most, of these regions are functionally important.
149Indeed, most coding exons and many untranslated regions
show interspecies conservation, although these only account
for a minority of conserved regions. Conserved elements have
been show to affect gene transcription levels,
150 – 156RNA
editing
112and genome stability.
157Additionally, conserved
regions are enriched in intronic stretches surrounding
alternatively spliced exons and have an excess of predicted
secondary structure
112,143,158and matrix-scaffold attachment
regions.
159Furthermore, they are enriched in stable gene
deserts, which have been postulated to contain long range
cis-regulatory regions.
112Two lines of evidence suggest that
many SNPs in conserved regions are subject to selection and,
hence, are presumably functional: these regions contain a
relative dearth of SNPs (Table 2), and the SNPs present
there show a shift in allele frequency distribution towards
rarer alleles.
160,161The identification of conserved non-coding elements has
generated a paradigm shift for the definition of functional
elements. Without knowing the exact function of each
element, sequences conserved across species define a map of
likely functional regions in the genome and SNPs in the
regions are candidates for functional SNP association studies.
The study of conserved regions is a vibrant field, with
diverse methods of defining conservation and views on the
correct number and types of species to compare. Some groups
have focused on very large regions while others have examined
conservation of regions as small as 4 bp.
112,143,144Analyses can
be performed using very closely related species (such as
primates) or very distant species (such as a range of
eukaryotes).
112,143,144The study of species that are moderately
distant (
,
75 million years) has yielded many of the conserved
elements,
162while study of primates has provided insight on
primate-specific regulatory elements.
146In addition to
identifying conserved elements subject to purifying selection,
comparative genomics has identified genes with evidence of
positive selection.
163,164Similar analyses may eventually be
able to identify non-coding elements subjected to positive
selection.
The proportion of functional elements that can be
identified by comparative genomics is not yet clear. In a study
using sequences from multiple yeast species, essentially all the
known non-coding regulatory regions were identified as
conserved.
157Another study in yeast could identify conserved
elements at the resolution of 6 bp transcription factor binding
sites.
165In mammals, using the currently available genomic
sequences, most of the coding sequences and known
regulatory sequences are conserved.
166The analysis of more
mammalian genome sequences will undoubtedly refine the
current picture of conserved elements, although it is not clear
that it will reach the same resolution achieved in yeast.
162Nevertheless, it is likely that some functional sequences may
not be identified through comparative genomics. If these
SNPs do not fall into another obvious class of functional
elements (like promoter regions), they may be missed by
function-based association studies.
Generating a whole genome set of
functional SNPs
The current feasibility of genome-wide function association
studies depends upon the total number of functional SNPs and
the extent to which such SNPs are represented in the
databases. In the following discussion, we define functional
SNPs as SNPs that fall into any of the above classes
(ie non-synonymous, splicing, promoter, conserved
112).
Ongoing improvements in the definition of conserved
regions may slightly change these estimates.
in sequencing, were then genotyped in the full 270 HapMap
samples.
We first determined the total number of functional SNPs
currently in dbSNP (using the above definitions). We
then used the ENCODE regions to determine the allele
frequency distribution (ie percentage rare and common) of
conserved-region SNPs already in the dbSNP (ignoring those
newly discovered by the ENCODE re-sequencing effort). We
subsequently used information on the newly discovered
ENCODE SNPs and our internal SNP discovery efforts to
infer the percentage of SNPs missing from the dbSNP. This
allowed us finally to estimate the total number of such SNPs.
Implicit in this estimation is that the distribution of the allele
frequency of functional SNPs is the same as the distribution
of the subset of these SNPs that are in conserved elements
(which account for over 75 per cent of the functional SNPs).
There are approximately 380,000 functional SNPs in
dbSNP build 124. We infer from the ENCODE data that
approximately 190,000 of these are common and 85,000 are
rare (the remaining SNPs are very rare or database errors).
Results were similar using data from both the CEPH and
Yoruban samples. These results differ markedly from the
expectations under the standard neutral model that there
should be similar numbers of rare and common SNPs,
suggesting that rare SNPs are missing in the dbSNP
database.
167Of the conserved region SNPs detected in the
ENCODE Yoruban samples, the dbSNP database contained
23 per cent of the rare and 55 per cent of the common SNPs.
Coverage was higher for conserved-region SNPs detected in
the ENCODE CEPH samples, as the dbSNP database
contained 35 per cent of the rare as well as 71 per cent of the
common SNPs. Given that limited numbers of chromosomes
typically are used for SNP discovery, both the dbSNP database
and ENCODE are biased to miss rare SNPs
a. The extent of
this bias estimated using our internal SNP discovery efforts
suggests that dbSNP coverage of rare SNPs is between
approximately 25 per cent (in Caucasian) and approximately
15 per cent (in African).
From the above data, we estimate that there are
approximately 350,000 common and 570,000 rare functional
SNPs in the Yoruban samples and 270,000 common and
340,000 rare functional SNPs in the CEPH samples. Hence,
a study that assayed only common functional SNPs would
require a similar number of SNPs as an LD tagging
study.
161,168Even greater genotyping efficiency could be
found by combining the approaches. Additionally, the number
of rare functional SNPs is within the ability of new genotyping
technologies.
98,99,169Discussion
Association studies based on functional SNPs are highly
efficient as they study the set of SNPs most likely to cause
disease. In the past, these studies have been criticised as not
being comprehensive due to our incomplete knowledge of the
functional elements of the human genome. Research into
conserved sequences and the continuing influx of genomic
sequences into the public domain promises to delineate many
of these elements and increase the comprehensiveness of
functional SNP association studies. The use of
functional-based association studies can, in principle, adequately assess
rare alleles, poor coverage of which is a major drawback for
LD-based association studies.
It may be possible to improve the balance between the
comprehensiveness and efficiency (defined in terms of
multiple testing costs) of a functional SNP-based study by
incorporating the
a priori
probability that an SNP is functional
into the statistical tests used for analysis. For instance, one
might set a less stringent
p-value threshold for a nonsense SNP
than for one in a putative promoter. Additionally, one might
set a lower
p-value threshold for an SNP that was in two
functional categories rather than in a single functional
category. For example, Table 3 indicates that SNP density
(which over the whole genome probably reflects selection and,
hence, functionality) is particularly low in coding regions that
are also conserved or flank splice junctions.
For comprehensive functional-based association studies to
become practical, several goals need to be accomplished. First,
the definition of functional elements needs to be refined
through the availability of more genomic sequences. Secondly,
SNP discovery efforts must be continued and expanded.
Targeted re-sequencing in the functional regions may be
necessary in order to compensate for bias against rare alleles in
the databases, especially those that are population-specific and
hence more likely to be functional.
105The availability of
extra sequencing capacity and efficient SNP discovery
technologies can help to achieve this goal.
170Thirdly, SNPs
must be genotyped in the major ethnic populations to
determine allele frequencies. HapMap now includes millions
of SNPs, although these are biased to common SNPs.
161Given the high-throughput genotyping technologies available,
testing additional candidate functional SNPs to identify the
common and rare SNPs can be readily performed. Indeed, we
have recently undertaken the task of genotyping approximately
30,000 nsSNPs from the public databases to identify a set of
aSNP discovery efforts interrogate a limited number of individuals and henceapproximately 20,000 that are polymorphic in at least one
population.
105With the availability of the functional elements and the
SNPs, only approximately 270,000–350,000 SNPs must be
genotyped to assess common functional SNPs in the genome.
Furthermore, the genotyping of 300,000–500,000 additional
SNPs will allow assessment of rare functional SNPs which
have been implicated in many common diseases and are
inadequately assessed by other approaches.
References
1. Risch, N. and Merikangas, K. (1996), ‘The future of genetic studies of complex human diseases’,ScienceVol. 273, pp. 1516–1517.
2. Lohmueller, K.E., Pearce, C.L., Pike, M.et al.(2003), ‘Meta-analysis of genetic association studies supports a contribution of common variants to susceptibility to common disease’,Nat. Genet.Vol. 33, pp. 177–182.
3. Begovich, A.B., Carlton, V.E.H., Honigberg, L.A.et al.(2004), ‘A missense single-nucleotide polymorphism in a gene encoding a protein tyrosine phosphatase (PTPN22) is associated with rheumatoid arthritis’,
Am. J. Hum. Genet.Vol. 75, pp. 330–337.
4. van Oene, M., Wintle, R.F., Liu, X.et al.(2005), ‘Association of the lymphoid tyrosine phosphatase R620W variant with rheumatoid arthritis, but not Crohn’s disease, in Canadian populations’,Arthritis Rheum.Vol. 52, pp. 1993–1998.
5. Simkins, H.M., Merriman, M.E., Highton, J.et al.(2005), ‘Association of the PTPN22 locus with rheumatoid arthritis in a New Zealand Caucasian cohort’,Arthritis Rheum.Vol. 52, pp. 2222–2225. 6. Hinks, A., Barton, A., John, S.et al.(2005), ‘Association between the
PTPN22 gene and rheumatoid arthritis and juvenile idiopathic arthritis in a UK population: Further support that PTPN22 is an autoimmunity gene’,Arthritis Rheum.Vol. 52, pp. 1694–1699.
7. Zhernakova, A., Eerligh, P., Wijmenga, C.et al.(2005), ‘Differential association of the PTPN22 coding variant with autoimmune diseases in a Dutch population’,Genes Immun.Vol. 6, pp. 459–461.
8. Viken, M.K., Amundsen, S.S., Kvien, T.K.et al.(2005), ‘Association analysis of the 1858C.T polymorphism in the PTPN22 gene in juvenile idiopathic arthritis and other autoimmune diseases’,Genes Immun.Vol. 6, pp. 271–273.
9. Criswell, L.A., Pfeiffer, K.A., Lum, R.F.et al.(2005), ‘Analysis of families in the multiple autoimmune disease genetics consortium (MADGC) collection: The PTPN22 620W allele associates with multiple autoimmune phenotypes’,Am. J. Hum. Genet.Vol. 76, pp. 561–571. 10. Lee, A.T., Li, W., Liew, A.et al.(2005), ‘The PTPN22 R620W
polymorphism associates with RF positive rheumatoid arthritis in a dose-dependent manner but not with HLA-SE status’,Genes Immun.
Vol. 6, pp. 129–133.
11. Orozco, G., Sanchez, E., Gonzalez-Gay, M.A.et al.(2005), ‘Association of a functional single-nucleotide polymorphism of PTPN22, encoding lymphoid protein phosphatase, with rheumatoid arthritis and systemic lupus erythematosus’,Arthritis Rheum.Vol. 52, pp. 219–224.
12. Steer, S., Lad, B., Grumley, J.A.et al.(2005), ‘Association of R602W in a protein tyrosine phosphatase gene with a high risk of rheumatoid arthritis in a British population: Evidence for an early onset/disease severity effect’,Arthritis Rheum.Vol. 52, pp. 358–360.
13. Seldin, M.F., Shigeta, R., Laiho, K.et al.(2005), ‘Finnish case-control and family studies support PTPN22 R620W polymorphism as a risk factor in rheumatoid arthritis, but suggest only minimal or no effect in juvenile idiopathic arthritis’,Genes Immun.Vol. 6, pp. 720–722. 14. Mori, M., Yamada, R., Kobayashi, K.et al.(2005), ‘Ethnic differences in
allele frequency of autoimmune-disease-associated SNPs’,J. Hum. Genet.
Vol. 50, pp. 264–266.
15. Qu, H., Tessier, M.C., Hudson, T.J. and Polychronakos, C. (2005), ‘Confirmation of the association of the R620W polymorphism in the protein tyrosine phosphatase PTPN22 with type 1 diabetes in a family based study’,J. Med. Genet.Vol. 42, pp. 266–270.
16. Zheng, W. and She, J.X. (2005), ‘Genetic association between a lymphoid tyrosine phosphatase (PTPN22) and type 1 diabetes’,Diabetes
Vol. 54, pp. 906–908.
17. Ladner, M.B., Bottini, N., Valdes, A.M. and Noble, J.A. (2005), ‘Association of the single nucleotide polymorphism C1858T of the PTPN22 gene with type 1 diabetes’,Hum. Immunol.Vol. 66, pp. 60–64. 18. Onengut-Gumuscu, S., Ewens, K.G., Spielman, R.S. and Concannon, P. (2004), ‘A functional polymorphism (1858C/T) in the PTPN22 gene is linked and associated with type I diabetes in multiplex families’,
Genes Immun.Vol. 5, pp. 678–680.
19. Smyth, D., Cooper, J.D., Collins, J.E.et al.(2004), ‘Replication of an association between the lymphoid tyrosine phosphatase locus (LYP/ PTPN22) with type 1 diabetes, and evidence for its role as a general autoimmunity locus’,DiabetesVol. 53, pp. 3020–3023.
20. Bottini, N., Musumeci, L., Alonso, A.et al.(2004), ‘A functional variant of lymphoid tyrosine phosphatase is associated with type 1 diabetes’,
Nat. Genet.Vol. 36, pp. 337–338.
21. Klein, R.J., Zeiss, C., Chew, E.Y.et al.(2005), ‘Complement factor H polymorphism in age-related macular degeneration’,ScienceVol. 308, pp. 385–389.
22. Edwards, A.O., Ritter III, R., Abel, K.J.et al.(2005), ‘Complement factor H polymorphism and age-related macular degeneration’,Science
Vol. 308, pp. 421–424.
23. Conley, Y.P., Thalamuthu, A., Jakobsdottir, J.et al.(2005), ‘Candidate gene analysis suggests a role for fatty acid biosynthesis and regulation of the complement system in the etiology of age-related maculopathy’,
Hum. Mol. Genet.Vol. 14, pp. 1991–2002.
24. Hageman, G.S., Anderson, D.H., Johnson, L.V.et al.(2005), ‘A common haplotype in the complement regulatory gene factor H (HF1/CFH) predisposes individuals to age-related macular degeneration’,Proc. Natl. Acad. Sci. USAVol. 102, pp. 7227–7232.
25. Haines, J.L., Hauser, M.A., Schmidt, S.et al.(2005), ‘Complement factor H variant increases the risk of age-related macular degeneration’,Science
Vol. 308, pp. 419–421.
26. Zareparsi, S., Branham, K.E.H., Li, M.et al.(2005), ‘Strong association of the Y402H variant in complement factor H at 1q32 with susceptibility to age-related macular degeneration’,Am. J. Hum. Genet.Vol. 77, pp. 149–153.
27. Bertina, R.M., Koeleman, B.P.C., Koster, T.et al.(1994), ‘Mutation in blood coagulation factor V associated with resistance to activated protein C’,NatureVol. 369, pp. 64–67.
28. Ridker, P.M., Hennekens, C.H., Lindpaintner, K.et al.(1995), ‘Mutation in the gene coding for coagulation factor V and the risk of myocardial infarction, stroke, and venous thrombosis in apparently healthy men’,N. Engl. J. Med.Vol. 332, pp. 912–917.
29. Zoller, B. and Dahlback, B. (1994), ‘Linkage between inherited resistance to activated protein C and factor V gene mutation in venous thrombosis’,
LancetVol. 343, pp. 1536–1538.
30. Zoller, B., Svensson, P.J., He, X. and Dahlback, B. (1994), ‘Identification of the same factor V gene mutation in 47 out of 50 thrombosis-prone families with inherited resistance to activated protein C’,J. Clin. Invest.
Vol. 94, pp. 2521–2524.
31. Ma, D.D., Aboud, M.R., Williams, B.G. and Isbister, J.P. (1995), ‘Activated protein c resistance (APC) and inherited factor V (FV) mis-sense mutation in patients with venous and arterial thrombosis in a haematology clinic’,Aust. N. Z. J. Med.Vol. 25, pp. 151–154. 32. Ridker, P.M., Miletich, J.P., Stampfer, M.J.et al.(1995), ‘Factor V Leiden
and risks of recurrent idiopathic venous thromboembolism’,Circulation
Vol. 92, pp. 2800–2802.
33. Arruda, V.R., Annichino-Bizzacchi, J.M., Costa, F.F. and Reitsma, P.H. (1995), ‘Factor V Leiden (FVQ 506) is common in a Brazilian population’,Am. J. Hematol.Vol. 49, pp. 242–243.
34. Schobess, R., Junker, R., Auberger, K.et al.(1999), ‘Factor V G1691A and prothrombin G20210A in childhood spontaneous venous
thrombosis — Evidence of an age-dependent thrombotic onset in carriers of factor V G1691A and prothrombin G20210A mutation’,
Eur. J. Pediatr.Vol. 158(Suppl. 3), pp. S105–S108.
35. Rees, D.C., Cox, M. and Clegg, J.B. (1995), ‘World distribution of factor V Leiden’,LancetVol. 346, pp. 1133–1134.
36. Miyata, T., Kawasaki, T., Fujimura, H.et al.(1998), ‘The prothrombin gene G20210A mutation is not found among Japanese patients with deep vein thrombosis and healthy individuals’,Blood Coagul. Fibrinolysis
Vol. 9, pp. 451–452.
37. Cumming, A.M., Keeney, S., Salden, A.et al.(1997), ‘The prothrombin gene G20210A variant: Prevalence in a UK anticoagulant clinic population’,Br. J. Haematol.Vol. 98, pp. 353–355.
38. Cattaneo, M., Chantarangkul, V., Taioli, E.et al.(1999), ‘The G20210A mutation of the prothrombin gene in patients with previous first episodes of deep-vein thrombosis: Prevalence and association with factor V G1691A, methylenetetrahydrofolate reductase C677T and plasma prothrombin levels’,Thromb. Res.Vol. 93, pp. 1–8.
39. Margaglione, M., Brancaccio, V., Giuliani, N.et al.(1998), ‘Increased risk for venous thrombosis in carriers of the prothrombin G–.A20210 gene variant’,Ann. Intern. Med.Vol. 129, pp. 89–93.
40. Poort, S.R., Rosendaal, F.R., Reitsma, P.H. and Bertina, R.M. (1996), ‘A common genetic variation in the 30-untranslated region of
the prothrombin gene is associated with elevated plasma prothrombin levels and an increase in venous thrombosis’,BloodVol. 88, pp. 3698–3703.
41. Sachchithananthan, M., Stasinopoulos, S.J., Wilusz, J. and Medcalf, R.L. (2005), ‘The relationship between the prothrombin upstream sequence element and the G20210A polymorphism: The influence of a competi-tive environment for mRNA 30-end formation’,Nucleic Acids Res.Vol.
33, pp. 1010–1020.
42. Rees, D.C., Chapman, N.H., Webster, M.T.et al.(1999), ‘Born to clot: The European burden’,Br. J. Haematol.Vol. 105, pp. 564–566. 43. Lesage, S., Zouali, H., Cezard, J.P.et al.(2002), ‘CARD15/NOD2
mutational analysis and genotype-phenotype correlation in 612 patients with inflammatory bowel disease’,Am. J. Hum. Genet.Vol. 70, pp. 845–857.
44. Hampe, J., Cuthbert, A., Croucher, P.J.et al.(2001), ‘Association between insertion mutation in NOD2 gene and Crohn’s disease in German and British populations’,LancetVol. 357, pp. 1925–1928. 45. Ogura, Y., Bonen, D.K., Inohara, N.et al.(2001), ‘A frameshift mutation
in NOD2 associated with susceptibility to Crohn’s disease’,Nature
Vol. 411, pp. 603–606.
46. Hugot, J.P., Chamaillard, M., Zouali, H.et al.(2001), ‘Association of NOD2 leucine-rich repeat variants with susceptibility to Crohn’s disease’,NatureVol. 411, pp. 599–603.
47. Kim, T.H., Rahman, P., Jun, J.B.et al.(2004), ‘Analysis of CARD15 polymorphisms in Korean patients with ankylosing spondylitis reveals absence of common variants seen in western populations’,J. Rheumatol.
Vol. 31, pp. 1959–1961.
48. Yamazaki, K., Takazoe, M., Tanaka, T.et al.(2002), ‘Absence of mutation in the NOD2/CARD15 gene among 483 Japanese patients with Crohn’s disease’,J. Hum. Genet.Vol. 47, pp. 469–472. 49. Stockton, J.C., Howson, J.M., Awomoyi, A.A.et al.(2004),
‘Poly-morphism in NOD2, Crohn’s disease, and susceptibility to pulmonary tuberculosis’,FEMS Immunol. Med. Microbiol.Vol. 41, pp. 157–160. 50. CHEK2 Breast Cancer Case-Control Consortium (2004),
‘CHEK2*1100delC and susceptibility to breast cancer: A collaborative analysis involving 10,860 breast cancer cases and 9,065 controls from 10 studies’,Am. J. Hum. Genet.Vol. 74, pp. 1175–1182.
51. Broeks, A., de Witte, L., Nooijen, A.et al.(2004), ‘Excess risk for contralateral breast cancer in CHEK2*1100delC germline mutation carriers’,Breast Cancer Res. Treat.Vol. 83, pp. 91–93.
52. Cybulski, C., Gorski, B., Huzarski, T.et al.(2004), ‘CHEK2 is a multiorgan cancer susceptibility gene’,Am. J. Hum. Genet.Vol. 75, pp. 1131–1135.
53. Dufault, M.R., Betz, B., Wappenschmidt, B.et al.(2004), ‘Limited relevance of the CHEK2 gene in hereditary breast cancer’,Int. J. Cancer
54. Gorski, B., Cybulski, C., Huzarski, T.et al.(2005), ‘Breast cancer predisposing alleles in Poland’,Breast Cancer Res. Treat.Vol. 92, pp. 19–24.
55. Meijers-Heijboer, H., van den Ouweland, A., Klijn, J.et al.(2002), ‘Low-penetrance susceptibility to breast cancer due to
CHEK2(*)1100delC in noncarriers of BRCA1 or BRCA2 mutations’,
Nat. Genet.Vol. 31, pp. 55–59.
56. Vahteristo, P., Bartkova, J., Eerola, H.et al.(2002), ‘A CHEK2 genetic variant contributing to a substantial fraction of familial breast cancer’,
Am. J. Hum. Genet.Vol. 71, pp. 432–438.
57. Corder, E.H., Saunders, A.M., Risch, N.J.et al.(1993), ‘Gene dose of apolipoprotein E type 4 allele and the risk of Alzheimer’s disease in late onset families’,ScienceVol. 261, pp. 921–923.
58. Saunders, A.M., Strittmatter, W.J., Schmechel, D.et al.(1993), ‘Association of apolipoprotein E allele epsilon 4 with late-onset familial and sporadic Alzheimer’s disease’,NeurologyVol. 43, pp. 1467–1472.
59. Mayeux, R., Stern, Y., Ottman, R.et al.(1993), ‘The apolipoprotein epsilon 4 allele in patients with Alzheimer’s disease’,Ann. Neurol.Vol. 34, pp. 752–754.
60. Anon (1993), ‘Apolipoprotein E genotype and Alzheimer’s disease. Alzheimer’s Disease Collaborative Group’,LancetVol. 342, pp. 737–738. 61. Strittmatter, W.J. and Roses, A.D. (1995), ‘Apolipoprotein E and
Alzheimer disease’,Proc. Natl. Acad. Sci. USAVol. 92, pp. 4725–4727. 62. Corbo, R.M. and Scacchi, R. (1999), ‘Apolipoprotein E (APOE) allele
distribution in the world Is APOE*4 a “thrifty’ allele?”’,Ann. Hum. Genet.Vol. 63, pp. 301–310.
63. Sayi, J.G., Patel, N.B., Premkumar, D.R.et al.(1997), ‘Apolipoprotein E polymorphism in elderly east Africans’,East Afr. Med. J.Vol. 74, pp. 668–670.
64. Lane, K.A., Gao, S., Hui, S.L.et al.(2003), ‘Apolipoprotein E and mortality in African-Americans and Yoruba’,J. Alzheimers Dis.Vol. 5, pp. 383–390.
65. Wu, J.H., Lo, S.K., Wen, M.S. and Kao, J.T. (2002), ‘Characterization of apolipoprotein E genetic variations in Taiwanese: Association with coronary heart disease and plasma lipid levels’,Hum. Biol.Vol. 74, pp. 25–31.
66. Gloyn, A.L., Weedon, M.N., Owen, K.R.et al.(2003), ‘Large-scale association studies of variants in genes encoding the pancreatic beta-cell KATP channel subunits Kir6.2 (KCNJ11) and SUR1 (ABCC8) confirm that the KCNJ11 E23K variant is associated with type 2 diabetes’,
DiabetesVol. 52, pp. 568–572.
67. Laukkanen, O., Pihlajamaki, J., Lindstrom, J.et al.(2004),
‘Polymorphisms of the SUR1 (ABCC8) and Kir6.2 (KCNJ11) genes predict the conversion from impaired glucose tolerance to type 2 diabetes. The Finnish Diabetes Prevention Study’,J. Clin. Endocrinol. Metab.Vol. 89, pp. 6286–6290.
68. McCarthy, M.I. (2004), ‘Progress in defining the molecular basis of type 2 diabetes mellitus through susceptibility-gene identification’,
Hum. Mol. Genet.Vol. 13, pp. R33–R41.
69. Dean, M., Carrington, M., Winkler, C.et al.(1996), ‘Genetic restriction of HIV-1 infection and progression to AIDS by a deletion allele of the CKR5 structural gene. Hemophilia Growth and Development Study, Multicenter AIDS Cohort Study, Multicenter Hemophilia Cohort Study, San Francisco City Cohort, ALIVE Study’,ScienceVol. 273,
pp. 1856–1862.
70. Huang, Y., Paxton, W.A., Wolinsky, S.M.et al.(1996), ‘The role of a mutant CCR5 allele in HIV-1 transmission and disease progression’,
Nat. Med.Vol. 2, pp. 1240–1243.
71. Liu, R., Paxton, W.A., Choe, S.et al.(1996), ‘Homozygous defect in HIV-1 coreceptor accounts for resistance of some multiply-exposed individuals to HIV-1 infection’,CellVol. 86, pp. 367–377.
72. Samson, M., Libert, F., Doranz, B.J.et al.(1996), ‘Resistance to HIV-1 infection in caucasian individuals bearing mutant alleles of the CCR-5 chemokine receptor gene’,NatureVol. 382, pp. 722–725.
73. Zimmerman, P.A., Buckler-White, A., Alkhatib, G.et al.(1997), ‘Inherited resistance to HIV-1 conferred by an inactivating mutation in CC chemokine receptor 5: Studies in populations with contrasting
clinical phenotypes, defined racial background, and quantified risk’,
Mol. Med.Vol. 3, pp. 23–36.
74. Martinson, J.J., Chapman, N.H., Rees, D.C.et al.(1997), ‘Global distribution of the CCR5 gene 32-basepair deletion’,Nat. Genet.Vol. 16, pp. 100–103.
75. Shiffman, D., Ellis, S.G., Rowland, C.M.et al.(2005), ‘Identification of four gene variants associated with myocardial infarction’,Am. J. Hum. Genet.Vol. 77, pp. 596–605.
76. Smith, M.W. and O’Brien, S.J. (2005), ‘Mapping by admixture linkage disequilibrium: Advances, limitations and guidelines’,Nat. Rev. Genet.
Vol. 6, pp. 623–632.
77. Abecasis, G.R., Ghosh, D. and Nichols, T.E. (2005), ‘Linkage disequilibrium: Ancient history drives the new genetics’,Hum. Hered.
Vol. 59, pp. 118–124.
78. Halder, I. and Shriver, M.D. (2003), ‘Measuring and using admixture to study the genetics of complex diseases’,Hum. GenomicsVol. 1, pp. 52–62. 79. Vaisse, C., Clement, K., Durand, E.et al.(2000), ‘Melanocortin-4
receptor mutations are a frequent and heterogeneous cause of morbid obesity’,J. Clin. Invest.Vol. 106, pp. 253–262.
80. Cohen, J.C., Kiss, R.S., Pertsemlidis, A.et al.(2004), ‘Multiple rare alleles contribute to low plasma levels of HDL cholesterol’,Science
Vol. 305, pp. 869–872.
81. Margulies, M., Egholm, M., Altman, E.et al.(2005), ‘Genome sequencing in microfabricated high-density picolitre reactors’,Nature
Vol. 437, pp. 376–380.
82. Faham, M., Zheng, J., Moorhead, M.et al.(2005), ‘Multiplexed variation scanning for 1,000 amplicons in hundreds of patients using mismatch repair detection (MRD) on tag arrays’,Proc. Natl. Acad. Sci. USAVol. 102, pp. 14717–14722.
83. Cargill, M., Altshuler, D., Ireland, J.et al.(1999), ‘Characterization of single-nucleotide polymorphisms in coding regions of human genes’,
Nat. Genet.Vol. 22, pp. 231–238.
84. de Bakker, P.I., Yelensky, R., Pe’er, I.et al.(2005), ‘Efficiency and power in genetic association studies’,Nat. Genet.Vol. 37, pp. 1217–1223. 85. Van Eerdewegh, P., Little, R.D., Dupuis, J.et al.(2002), ‘Association of
the ADAM33 gene with asthma and bronchial hyperresponsiveness’,
NatureVol. 418, pp. 426–430.
86. Saleh, M., Vaillancourt, J.P., Graham, R.K.et al.(2004), ‘Differential modulation of endotoxin responsiveness by human caspase-12 polymorphisms’,NatureVol. 429, pp. 75–79.
87. Kim, T.H., Barrera, L.O., Qu, C.et al.(2005), ‘Direct isolation and identification of promoters in the human genome’,Genome Res.Vol. 15, pp. 830–839.
88. Ahmadi, K.R., Weale, M.E., Xue, Z.Y.et al.(2005), ‘A single-nucleotide polymorphism tagging set for human drug metabolism and transport’,
Nat. Genet.Vol. 37, pp. 84–89.
89. Evans, D.M., Cardon, L.R. and Morris, A.P. (2004), ‘Genotype predic-tion using a dense map of SNPs’,Genet. Epidemiol.Vol. 27, pp. 375–384. 90. Carlson, C.S., Eberle, M.A., Rieder, M.J.et al.(2004), ‘Selecting a
maximally informative set of single-nucleotide polymorphisms for association analyses using linkage disequilibrium’,Am. J. Hum. Genet.
Vol. 74, pp. 106–120.
91. Hu, X., Schrodi, S.J., Ross, D.A. and Cargill, M. (2004), ‘Selecting tagging SNPs for association studies using power calculations from genotype data’,Hum. Hered.Vol. 57, pp. 156–170.
92. Ke, X., Durrant, C., Morris, A.P.et al.(2004), ‘Efficiency and consistency of haplotype tagging of dense SNP maps in multiple samples’,Hum. Mol. Genet.Vol. 13, pp. 2557–2565.
93. Reich, D.E. and Lander, E.S. (2001), ‘On the allelic spectrum of human disease’,Trends Genet.Vol. 17, pp. 502–510.
94. Pritchard, J.K. (2001), ‘Are rare variants responsible for susceptibility to complex diseases?’,Am. J. Hum. Genet.Vol. 69, pp. 124–137. 95. Pritchard, J.K. and Cox, N.J. (2002), ‘The allelic architecture of human
disease genes: Common disease-common variant. . .or not?’,Hum. Mol. Genet.Vol. 11, pp. 2417–2423.
97. Gordon, D., Finch, S.J., Nothnagel, M. and Ott, J. (2002), ‘Power and sample size calculations for case-control genetic association tests when errors are present: Application to single nucleotide polymorphisms’,
Hum. Hered.Vol. 54, pp. 22–33.
98. Fan, J.B., Oliphant, A., Shen, R.et al.(2003), ‘Highly parallel SNP genotyping’,Cold Spring Harb. Symp. Quant. Biol.Vol. 68, pp. 69–78. 99. Hardenbol, P., Yu, F., Belmont, J.et al.(2005), ‘Highly multiplexed
molecular inversion probe genotyping: Over 10,000 targeted SNPs genotyped in a single tube assay’,Genome Res.Vol. 15, pp. 269–275. 100. Reich, D.E. and Goldstein, D.B. (2001), ‘Detecting association in a
case-control study while correcting for population stratification’,Genet. Epidemiol.Vol. 20, pp. 4–16.
101. Falush, D., Stephens, M. and Pritchard, J.K. (2003), ‘Inference of population structure using multilocus genotype data: Linked loci and correlated allele frequencies’,GeneticsVol. 164, pp. 1567–1587. 102. Jones, H.B. and Faham, M. (2005), ‘Evidence and implications for
multiplicative interactions among loci predisposing to human common disease’,Hum. Hered.Vol. 59, pp. 176–184.
103. Sunyaev, S., Ramensky, V., Koch, I.et al.(2001), ‘Prediction of deleterious human allele’,Hum. Mol. Genet.Vol. 10, pp. 591–597. 104. Ramensky, V., Bork, P. and Sunyaev, S. (2002), ‘Human
non-synonymous SNPs: Server and survey’,Nucleic Acids Res.Vol. 30, pp. 3894–3900.
105. Ireland, J., Carlton, V.E., Falkowski, M.et al.(2006), ‘Large-scale characterization of public database SNPs causing non-synonymous changes in three ethnic groups’,Hum. Genet.Vol. 119, pp. 75–83. 106. Lin, S., Chakravarti, A. and Cutler, D.J. (2004), ‘Exhaustive allelic
transmission disequilibrium tests as a new approach to genome-wide association studies’,Nat. Genet.Vol. 36, pp. 1181–1188.
107. Altshuler, D., Hirschhorn, J.N., Klannemark, M.et al.(2000), ‘The common PPARgamma Pro12Ala polymorphism is associated with decreased risk of type 2 diabetes’,Nat. Genet.Vol. 26, pp. 76–80. 108. Haga, H., Yamada, R., Ohnishi, Y.et al.(2002), ‘Gene-based SNP
discovery as part of the Japanese Millennium Genome Project 2002. Identification of 190,562 genetic variations in the human genome’,
J. Hum. Genet.Vol. 47, pp. 605–610.
109. Botstein, D. and Risch, N. (2003), ‘Discovering genotypes underlying human phenotypes: Past successes for Mendelian disease, future approaches for complex disease’,Nat. Genet.Vol. 33, pp. 228–237.
110. Halushka, M.K., Fan, J.-B., Bentley, K.et al.(1999), ‘Patterns of single-nucleotide polymorphisms in candidate genes for blood-pressure homeostasis’,Nat. Genet.Vol. 22, pp. 239–247.
111. Cargill, M., Altshuler, D., Ireland, J.et al.(1999), ‘Characterization of single-nucleotide polymorphisms in coding regions of human genes’,
Nat. Genet.Vol. 22, pp. 231–238.
112. Siepel, A., Bejerano, G., Pedersen, J.S.et al.(2005), ‘Evolutionarily conserved elements in vertebrate, insect, worm, and yeast genomes’,
Genome Res.Vol. 15, pp. 1034–1050.
113. Crawford, D.C., Akey, D.T. and Nickerson, D.A. (2005), ‘The patterns of natural variation in human genes’,Annu. Rev. Genomics Hum. Genet.
Vol. 6, pp. 287–312.
114. Krawczak, M., Reiss, J. and Cooper, D.N. (1992), ‘The mutational spectrum of single base-pair substitutions in mRNA splice junctions of human genes: Causes and consequences’,Hum. Genet.Vol. 90, pp. 41–54.
115. Treisman, R., Orkin, S.H. and Maniatis, T. (1983), ‘Specific transcription and RNA splicing defects in five cloned beta-thalassaemia genes’,
NatureVol. 302, pp. 591–596.
116. Mitchell, G.A., Labuda, D., Fontaine, G.et al.(1991), ‘Splice-mediated insertion of an Alu sequence inactivates ornithine delta-aminotransferase: A role for Alu elements in human mutation’,Proc. Natl. Acad. Sci. USA
Vol. 88, pp. 815–819.
117. Pagani, F., Buratti, E., Stuani, C.et al.(2002), ‘A new type of mutation causes a splicing defect in ATM’,Nat. Genet.Vol. 30, pp. 426–429. 118. Min, G.L., Martiat, P., Pu, G.A. and Goldman, J. (1990), ‘Use of pulsed
field gel electrophoresis to characterize BCR gene involvement in CML patients lacking M-BCR rearrangement’,LeukemiaVol. 4, pp. 650–656.
119. Zhang, X.H., Leslie, C.S. and Chasin, L.A. (2005), ‘Dichotomous splicing signals in exon flanks’,Genome Res.Vol. 15, pp. 768–779. 120. Fairbrother, W.G., Holste, D., Burge, C.B. and Sharp, P.A. (2004), ‘Single nucleotide polymorphism-based validation of exonic splicing enhancers’,PLoS Biol.Vol. 2, p. E268.
121. Senapathy, P., Shapiro, M.B. and Harris, N.L. (1990), ‘Splice junctions, branch point sites, and exons: Sequence statistics, identification, and applications to genome project’,Methods Enzymol.Vol. 183, pp. 252–278.
122. Cartegni, L., Chew, S.L. and Krainer, A.R. (2002), ‘Listening to silence and understanding nonsense: Exonic mutations that affect splicing’,
Nat. Rev. Genet.Vol. 3, pp. 285–298.
123. Liu, H.X., Zhang, M. and Krainer, A.R. (1998), ‘Identification of functional exonic splicing enhancer motifs recognized by individual SR proteins’,Genes Dev.Vol. 12, pp. 1998–2012.
124. Schaal, T.D. and Maniatis, T. (1999), ‘Multiple distinct splicing enhancers in the protein-coding sequences of a constitutively spliced pre-mRNA’,
Mol. Cell Biol.Vol. 19, pp. 261–273.
125. Zhang, X.H. and Chasin, L.A. (2004), ‘Computational definition of sequence motifs governing constitutive exon splicing’,Genes Dev.Vol. 18, pp. 1241–1250.
126. Fairbrother, W.G., Yeh, R.F., Sharp, P.A. and Burge, C.B. (2002), ‘Predictive identification of exonic splicing enhancers in human genes’,
ScienceVol. 297, pp. 1007–1113.
127. Smale, S.T. and Kadonaga, J.T. (2003), ‘The RNA polymerase II core promoter’,Annu. Rev. Biochem.Vol. 72, pp. 449–479.
128. Callahan III, R. and Balbinder, E. (1970), ‘Tryptophan operon: Structural gene mutation creating a ‘promoter’ and leading to 5-methyltryptophan dependence’,ScienceVol. 168, pp. 1586–1589. 129. Roberts, J.W. (1969), ‘Promoter mutation in vitro’,NatureVol. 223,
pp. 480–482.
130. Kulozik, A.E., Bellan-Koch, A., Bail, S.et al.(1991), ‘Thalassemia intermedia: Moderate reduction of beta globin gene transcriptional activity by a novel mutation of the proximal CACCC promoter element’,
BloodVol. 77, pp. 2054–2058.
131. Bosma, P.J., Chowdhury, J.R., Bakkerm, C.et al.(1995), ‘The genetic basis of the reduced expression of bilirubin UDP-glucuronosyltransferase 1 in Gilbert’s syndrome’,N. Engl. J. Med.Vol. 333, pp. 1171–1175. 132. Trinklein, N.D., Aldred, S.J., Saldanha, A.J. and Myers, R.M. (2003),
‘Identification and functional analysis of human transcriptional promoters’,Genome Res.Vol. 13, pp. 308–312.
133. Imanishi, T., Itoh, T., Suzuki, Y.et al.(2004), ‘Integrative annotation of 21,037 human genes validated by full-length cDNA clones’,PLoS Biol.
Vol. 2, p. e162.
134. Suzuki, Y., Yamashita, R., Sugano, S. and Nakai, K. (2004), ‘DBTSS, DataBase of Transcriptional Start Sites: Progress report 2004’,Nucleic Acids Res.Vol. 32, pp. D78–D81.
135. Suzuki, Y., Yamashita, R., Shirota, M.et al.(2004), ‘Large-scale collection and characterization of promoters of human and mouse genes’,In Silico Biol.Vol. 4, pp. 429–444.
136. Rodriguez-Jato, S., Nicholls, R.D., Driscoll, D.J. and Yang, T.P. (2005), ‘Characterization of cis- and trans-acting elements in the imprinted human SNURF-SNRPN locus’,Nucleic Acids Res.Vol. 33, pp. 4740–4753.
137. Lettice, L.A., Heaney, S.J., Purdie, L.A.et al.(2003), ‘A long-range Shh enhancer regulates expression in the developing limb and fin and is associated with preaxial polydactyl’,Hum. Mol. Genet.Vol. 12, pp. 1725–1735.
138. The ENCODE (ENCyclopedia Of DNA Elements) Project (2004),
ScienceVol. 306, pp. 636–640.
139. Kolbe, D., Taylor, J., Elnitski, L.et al.(2004), ‘Regulatory potential scores from genome-wide three-way alignments of human, mouse, and rat’,Genome Res.Vol. 14, pp. 700–707.
140. Elnitski, L., Hardison, R.C., Li, J.et al.(2003), ‘Distinguishing regulat-ory DNA from neutral sites’,Genome Res.Vol. 13, pp. 64–72. 141. Woolfe, A., Goodson, M., Goode, D.K.et al.(2005), ‘Highly conserved
non-coding sequences are associated with vertebrate development’,
142. Dermitzakis, E.T., Reymond, A., Lyle, R.et al.(2002), ‘Numerous potentially functional but non-genic conserved sequences on human chromosome 21’,NatureVol. 420, pp. 578–582.
143. Cooper, G.M., Stone, E.A., Asimenos, G.et al.(2005), ‘Distribution and intensity of constraint in mammalian genomic sequence’,Genome Res.
Vol. 15, pp. 901–913.
144. Dermitzakis, E.T., Reymond, A. and Antonarakis, S.E. (2005), ‘Conserved non-genic sequences — An unexpected feature of mammalian genomes’,Nat. Rev. Genet.Vol. 6, pp. 151–157. 145. Margulies, E.H., Blanchette, M., Haussler, D. and Green, E.D. (2003),
‘Identification and characterization of multi-species conserved sequences’,Genome Res.Vol. 13, pp. 2507–2518.
146. Boffelli, D., McAuliffe, J., Ovcharenko, D.et al.(2003), ‘Phylogenetic shadowing of primate sequences to find functional regions of the human genome’,ScienceVol. 299, pp. 1391–1394.
147. Frazer, K.A., Tao, H., Osoegawa, K.et al.(2004), ‘Noncoding sequences conserved in a limited number of mammals in the SIM2 interval are frequently functional’,Genome Res.Vol. 14, pp. 367–372.
148. Pennacchio, L.A. and Rubin, E.M. (2001), ‘Genomic strategies to identify mammalian regulatory sequences’,Nat. Rev. Genet.Vol. 2, pp. 100–109.
149. Hardison, R.C. (2003), ‘Comparative genomics’,PLoS Biol.Vol. 1, p. E58. 150. Culi, J. and Modolell, J. (1998), ‘Proneural gene self-stimulation in
neural precursors: An essential mechanism for sense organ development that is regulated by Notch signaling’,Genes Dev.Vol. 12, pp. 2036–2047. 151. Renucci, A., Zappavigna, V., Za`ka`ny, J.et al.(1992), ‘Comparison of
mouse and human HOX-4 complexes defines conserved sequences involved in the regulation of Hox-4.4’,EMBO J.Vol. 11, pp. 1459–1468. 152. Loots, G.G., Locksley, R.M., Blankespoor, C.M.et al.(2000),
‘Identification of a coordinate regulator of interleukins 4, 13, and 5 by cross-species sequence comparisons’,ScienceVol. 288, pp. 136–140. 153. Poulin, F., Nobrega, M.A., Plajzer-Frick, I.et al.(2005), ‘In vivo
characterization of a vertebrate ultraconserved enhancer’,Genomics
Vol. 85, pp. 774–781.
154. Nobrega, M.A., Ovcharenko, I., Afzal, V. and Rubin, E.M. (2003), ‘Scanning human gene deserts for long-range enhancers’,ScienceVol. 302, pp. 413.
155. Kimura-Yoshida, C., Kitajima, K., Oda-Ishii, I.et al.(2004), ‘Characterization of the pufferfish Otx2 cis-regulators reveals evolutionarily conserved genetic mechanisms for vertebrate head specification’,DevelopmentVol. 131, pp. 57–71.
156. Uchikawa, M., Takemoto, T., Kamachi, Y. and Kondoh, H. (2004), ‘Efficient identification of regulatory sequences in the chicken genome
by a powerful combination of embryo electroporation and genome comparison’,Mech. Dev.Vol. 121, pp. 1145–1158.
157. Ganley, A.R., Hayashi, K., Horiuchi, T. and Kobayashi, T. (2005), ‘Identifying gene-independent noncoding functional elements in the yeast ribosomal DNA by phylogenetic footprinting’,Proc. Natl. Acad. Sci. USAVol. 102, pp. 11787–11792.
158. Xie, X., Lu, J., Kulbokas, E.J.et al.(2005), ‘Systematic discovery of regulatory motifs in human promoters and 30UTRs by comparison of
several mammals’,NatureVol. 434, pp. 338–345.
159. Glazko, G.V., Koonin, E.V., Rogozin, I.B. and Shabalina, S.A. (2003), ‘A significant fraction of conserved noncoding DNA in human and mouse consists of predicted matrix attachment regions’,Trends Genet.
Vol. 19, pp. 119–124.
160. Drake, J.A., Bird, C., Nemesh, J.et al.(2006), ‘Conserved noncoding sequences are selectively constrained and not mutation cold spots’,
Nat. Genet.Vol. 38, pp. 223–227.
161. Altshuler, D., Brooks, L.D., Chakravarti, A.et al.(2005), ‘A haplotype map of the human genome’,NatureVol. 437, pp. 1299–1320. 162. Boffelli, D., Nobrega, M.A. and Rubin, E.M. (2004), ‘Comparative
genomics at the vertebrate extremes’,Nat. Rev. Genet.Vol. 5, pp. 456–465.
163. Clark, A.G., Glanowski, S., Nielsen, R.et al.(2003), ‘Inferring nonneutral evolution from human-chimp-mouse orthologous gene trios’,ScienceVol. 302, pp. 1960–1963.
164. Gilad, Y., Bustamante, C.D., Lancet, D. and Paabo, S. (2003), ‘Natural selection on the olfactory receptor gene family in humans and chimpanzees’,Am. J. Hum. Genet.Vol. 73, pp. 489–501.
165. Kellis, M., Patterson, N., Endrizzi, M.et al.(2003), ‘Sequencing and comparison of yeast species to identify genes and regulatory elements’,
NatureVol. 423, pp. 241–254.
166. Gibbs, R.A., Weinstock, G.M., Metzker, M.L.et al.(2004), ‘Genome sequence of the Brown Norway rat yields insights into mammalian evolution’,NatureVol. 428, pp. 493–521.
167. Kruglyak, L. and Nickerson, D.A. (2001), ‘Variation is the spice of life’,
Nat. Genet.Vol. 27, pp. 234–236.
168. The International Consortium (2005), ‘A haplotype map of the human genome’,NatureVol. 437, pp. 1299–1320.
169. Matsuzaki, H., Dong, S., Loi, H.et al.(2004), ‘Genotyping over 100,000 SNPs on a pair of oligonucleotide arrays’,Nat. MethodsVol. 1, pp. 109–111.