Testing an association between baseline resting
pulse rate averages and short-term changes in
resting pulse rates: A pilot study
John Hart, DC, MHSc*
*Assistant Director of Research Sherman College of Chiropractic P.O. Box 1452
Spartanburg, SC 29304 Email: [email protected] © JCCA 2015
Introduction: Resting heart (pulse) rate (RPR)
monitoring may be a useful neurological assessment tool in chiropractic practice. Lower RPR generally reflects a better level of fitness and health status than higher RPR. However, the clinical significance of short-term changes in RPR remains unknown. The purpose of this study was to take an initial step towards understanding the clinical significance of short-term RPR changes, first, by describing short-term RPR changes between duplicated measurements, and second, by comparing RPR changes between groups with lower and higher baseline RPR. Methods: Seventy-three healthy adult volunteers received an RPR measurement on two days within a 1-week period. The mean difference between the two measurements (RPR change) in patients with lower versus higher baseline RPR was compared.
Results: Mean RPR change in the low baseline group was -0.3 BPM (95% confidence interval [CI] = -2.7 to 2.1 BPM) whereas in the high baseline group, it was +4.4 BPM (95% CI = 1.2 to 7.6). This difference between groups was statistically significant (P = 0.02)
Introduction : Le contrôle de la fréquence cardiaque
(pouls) au repos (FCR) peut constituer un outil d’évaluation neurologique utile dans la pratique de la chiropratique. Une FCR basse reflète généralement une meilleure condition physique et une meilleure santé qu’une FCR élevée. Cependant, l’importance clinique du changement de FCR à court terme reste inconnue. L’objectif de cette étude était de faire un premier pas vers la compréhension de l’importance clinique des changements de FCR, tout d’abord en décrivant des changements de FCR à court terme entre des mesures dupliquées et, ensuite, en comparant des changements de FCR entre des groupes avec des FCR basses et élevées. Méthodologie : Soixante-treize adultes en bonne santé se sont portés volontaires pour que leur FCR soit mesurée à deux reprises sur une période d’une semaine. La différence moyenne entre les deux mesures (changement de la FCR) a été mesurée chez les patients ayant une FCR de départ plus basse et les patients ayant une FCR de départ plus élevée.
Introduction
Most chiropractors focus on a condition known as verte-bral subluxation.1 Essentially, a subluxation is defined in
concept and in theory as a slight misalignment resulting in some type of neurological disturbance.2-3 The actual
valid-ity of this theoretical construct is yet to be established. In the meantime, methods for detecting putative sublux-ations have included such assessments as thermography and leg length analyses.4 In a recent publication, it was
suggested that resting heart rate may be a useful proxy measure for neurological dysfunction in subluxation-type chiropractic practice.5 Resting heart rate is: a) considered
an autonomic marker,6-8 and b) evidence-based inasmuch
as a higher resting heart rate over time (e.g., 10 years) has been associated with worse health outcomes (e.g., high-er cardiac death rates).9-12 Previous studies have typically
found linear relationships between increasing heart rate over time (in years) and adverse clinical events, although one study has reported a nonlinear relationship.12 In the
meantime, there is: a) good agreement between ECG-ob-tained resting heart rate measurements and manually ascertained resting pulse rate (RPR);13-14 b) good
cor-relation of RPR with heart rate variability, particularly in terms of the standard deviation of normal-to-normal
beats (SDNN);15 and c) evidence that RPR may improve
following chiropractic care.16,17 On the other hand, these
changes in response to chiropractic care have only been documented over the course of a few days or weeks post-intervention, in which case, the clinical significance of such changes over the long-term remains unknown. Traditional chiropractic theory would have us assume that reductions in RPR following successful adjustment are attributable to the removal of vertebral subluxation-re-lated neurological dysfunction. However that line of rea-soning presupposes the existence of both vertebral sub-luxation and subsub-luxation-induced elevation of RPR prior to intervention. Again, vertebral subluxation (let alone the existence of clinically significant subluxation-related health effects) remains to be a validated construct. There-fore, a more plausible line of reasoning would be based on preliminary evidence from animal models showing that mechanical stimulation of somatic structures can re-sult in visceral responses that include reductions in both blood pressure and heart rate.18
The clinical validity of office-based measurements such as RPR, blood pressure, and heart rate variabil-ity are typically determined from long-term studies, in which baseline measures are correlated with subsequent
with a large effect size (Cohen’s d = 0.57). Conclusion: In this pilot study, a higher RPR at baseline was associated with increased RPR change, whereas a lower baseline RPR was associated with a stable or reduced RPR change. A future main study with a larger sample size and longer follow-up period is needed to better characterize both the natural variation of RPR over multiple repeated measurements, and the clinical significance of short-term RPR changes in terms of predicting longer-term health outcomes.
(JCCA 2015; 59(2):165-172)
k e y w o r d s : pulse, heart rate, reproducibility of
results, risk assessment, chiropractic
à 7,6 BPM). Cette différence entre les groupes était statistiquement significative (P = 0,02) avec un grand effet de taille (Cohen’s d = 0,57).
Conclusion : Dans cet étude pilote, une FCR élevée au départ était associée à un changement de FCR accru, tandis qu’une FCR plus basse au départ était associée à un changement de FCR stable ou réduit. Une étude principale avec un plus grand échantillon et une période de suivi plus longue est nécessaire afin de mieux caractériser à la fois la variation naturelle de la FCR lors de mesures répétées et l’importance sur le plan clinique des changements de FCR à court terme pour ce qui est de prédire les résultats sur la santé à long terme.
(JCCA 2015; 59(2):165-172)
m o t s c l é s : pouls, rythme cardiaque,
health effects (i.e., clinically significant patient-centered outcomes) over many years of follow-up. An example of this would be reductions in systolic blood pressure, which have been shown to be correlated with reductions in cardiovascular mortality risk in large studies over long periods of follow-up. Similarly, decreases in RPR, have also been shown to be associated with healthier cardio-vascular outcomes over the long-term,10 although
admit-tedly not in all studies.12 Overall, however, the existing
literature supports the notion that increased RPR is asso-ciated with worse health outcomes compared to stable or reduced RPR in long-term studies.
The utility of a new test, or novel application of an existing test can be explored indirectly by correlating a range of its values with those of an already-established criterion method or measure (such as an isolated blood pressure or baseline RPR reading). Good correlation be-tween the new and criterion measure helps to establish one form of validity (namely, criterion validity or, more specifically, concurrent criterion validity). For example, in an individual patient whose systolic blood pressure at one reading changes by 10 mm hg at a subsequent read-ing within a short-term period, it would be interestread-ing to know if that short-term change between two consecutive measurements is systematically dependent upon the value of initial baseline reading. In this example, the short-term change between readings from two separate visits is the novel measure of interest, and the baseline reading is the criterion measure as it is already known to be a predictor of health outcomes over the longer-term.
For the current study, it was of interest to know if short-term changes (i.e., magnitude and direction of short-short-term variations) between duplicate RPR readings are system-atically dependent on the baseline RPR reading, the lat-ter of which by itself is a known predictor of longer-lat-term health outcomes including cardiovascular morbidity and mortality. If found to be associated in this regard, there would be justification for further exploring the utility of this variable as a potential neurophysiological measure (in addition to RPR alone) to inform, as well monitor the longer-term general health effects of chiropractic inter-vention.
Unfortunately, most, if not all tests that purport to mon-itor a neurological function in subluxation type practices have not been adequately tested in either short- or long-term studies. The unique objective of the present study
was to compare short-term RPR changes to the mean of RPR on two visits. Literature on the clinical significance of short term RPR changes (e.g., a few days apart) is no-nexistent. Baseline RPR on the other hand has been shown to be a good predictor of health outcomes over time.6,19-21
As an example, data from the Framingham study indicate that as resting heart rate increases, (cardiovascular and overall) death rates also increase significantly.21 As Table
1 shows, for example, as each RPR category increases, death rates typically also increase.
The present study is a pilot study that investigates the magnitude and direction of short-term RPR changes among healthy volunteers, and to compare this variable between groups defined by their initial (baseline RPR) reading. Depending on the results of this pilot study, a larger main study could be planned to more definitively evaluate the validity of RPR change as a predictor of clin-ically significant patient-centered health outcomes. This in turn would help to validate the use of RPR change as a neurological measure to assist the chiropractor in deciding if the patient needs a chiropractic adjustment (assuming a slight biomechanical dysfunction is also present). In the meantime, the primary hypothesis for this pilot study was that greater increases in RPR over the short-term would be associated with higher RPR measurements at baseline.
Methods
The study was approved by the Institutional Review Board at Sherman College of Chiropractic. Informed con-sent was obtained from all participants. Participants were
Table 1:
Overall death rate (per 1000 persons) by resting heart rate category. Adapted from the Framingham study.21
Men death rate Women death rate
RHR Ages 35-64 Ages 65-94 Ages 35-64 Ages 65-94
30- 67 6 35 3 22
68- 75 8 43 4 28
76- 83 11 46 6 25
84- 91 13 61 8 30
recruited as a convenience sample and examined by the author on two days within a one week period. The mean number of days between visits was 1.8 (standard devi-ation [SD], 1.9; range, 1 to 7). The 73 participants con-sisted of 36 females with a mean age of 25.8 years (SD, 4.6) and 37 males with a mean age of 29.4 years (SD, 7.4). Participants abstained from receiving chiropractic care for at least 1 week prior to their baseline visit, up until after their second visit.
RPR measurements were palpated at the radial artery. Two different groups of participants were examined at different time periods. In the earlier group, measurements were averaged between two separate 15-second count periods (separated by 15 seconds) on each visit, and were multiplied by 4 to estimate the beats per minute (BPM). For the more recent group, the BPM value was based on a single 30-second count period and multiplied by two. Thus, all participants’ RPR values are reported in BPM. In both groups the count for beats was begun with “1” rather than “0.” This is because good agreement with electrocardiography, as well as with 60-second count times, is achieved when the first beat is counted as “1” (rather than zero), regardless of whether count times are 15, 30, or 60 seconds.22 All RPR measurements were
pre-ceded by at least 5 minutes of seated resting. Participants
then remained seated during the active measurement per-iod. A digital timer on a wrist watch was used to mark time. Measurements were obtained within the same hour for both visits for each participant but not the same hour for all participants (e.g., some had both of their appoint-ments during the 11:00 AM hour while others had both of their appointments at the 3:00 PM hour). Information on current medication use was documented during each visit.
Analysis
For the classification variable, RPR for visit 1 (RPR-V1) and RPR for visit 2 V2) were averaged (RPR-V1V2) and categorized into two groups: 1) “low” RPR patients, defined as RPR-V1V2 less than or equal to the overall RPR-V1V2 mean; and 2) “high” RPR patients, defined as RPR-V1V2 greater than this overall mean. The dependent variable, RPR change, was calculated by subtracting RPR-V1 from RPR-V2 (i.e., RPR-V2 minus RPR-V1), which was then compared between the low and high baseline RPR groups. Averaging of the RPRs from the two visits was thought to allow for better estimation of baseline RPR (keeping in mind the random variability of RPR between isolated determinations), rather than using only one of the visits for baseline.
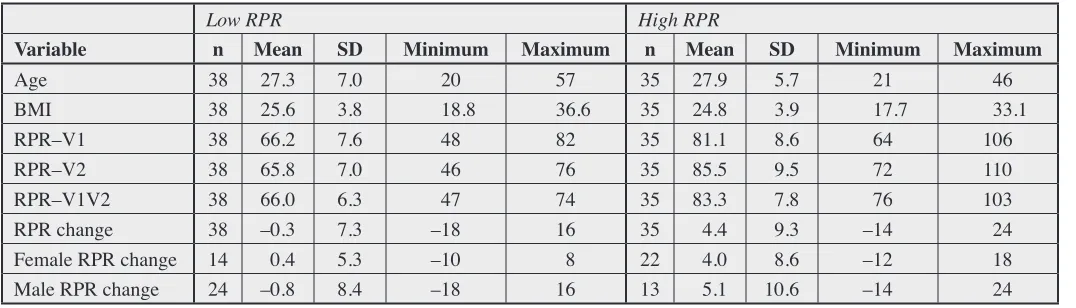
Body mass index was calculated with a formula pro-Table 2:
Summary statistics for low versus high resting pulse rate.
Low RPR High RPR
Variable n Mean SD Minimum Maximum n Mean SD Minimum Maximum
Age 38 27.3 7.0 20 57 35 27.9 5.7 21 46
BMI 38 25.6 3.8 18.8 36.6 35 24.8 3.9 17.7 33.1
RPR–V1 38 66.2 7.6 48 82 35 81.1 8.6 64 106
RPR–V2 38 65.8 7.0 46 76 35 85.5 9.5 72 110
RPR–V1V2 38 66.0 6.3 47 74 35 83.3 7.8 76 103
RPR change 38 –0.3 7.3 –18 16 35 4.4 9.3 –14 24
Female RPR change 14 0.4 5.3 –10 8 22 4.0 8.6 –12 18
Male RPR change 24 –0.8 8.4 –18 16 13 5.1 10.6 –14 24
vided by the Centers for Disease Control and Prevention: (weight / (height)2 * 703)23 and compared between low
versus high groups.
The main statistical test consisted of assessing the dif-ference between low and high RPR groups using the two sample t test (for groups with unequal variances). The an-alysis was performed in Stata IC 12.1 (StataCorp, College Station, TX). Since there were at least 3024 observations
(participants) in each group, the t test was considered ap-propriate. In addition, histograms for each group were examined to confirm normality of the data. The magni-tude of this difference was quantified with the effect size statistic, using a pooled standard deviation, calculated, in Excel 2010 (Microsoft Corp., Redmond, WA). To test for a linear association between mean baseline RPR (RPR-V1V2) and the short-term RPR change, Pearson’s cor-relation coefficient was estimated. Two-tailed p-values less than or equal to the conventional alpha level of 0.05 were considered statistically significant for all analyses.
Results
Descriptive statistics are provided in Table 2. Mean age and BMI were essentially the same in both low and high RPR groups (Table 2). In the low RPR group, there were 14 females and 24 males. In the high RPR group, there
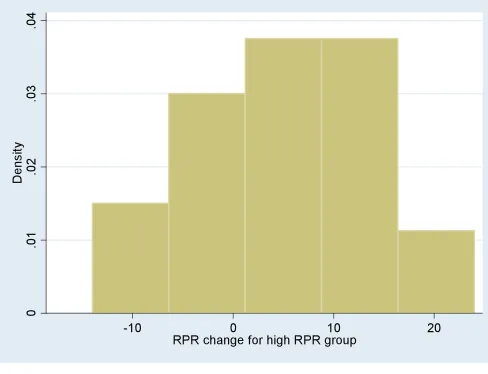
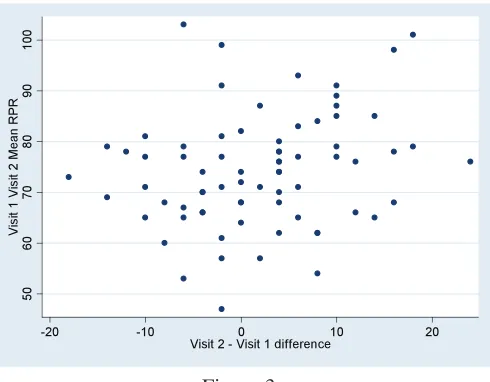
were 22 females and 13 males. Three participants had missing information regarding their use of medications during at least one visit. Another 11 participants indi-cated taking medication (vitamins in one case) that was the same for both visits. Six of these 11 medication users were in the low RPR group while the remaining five were in the high RPR group. Thus, changes in medication use were not considered a confounder in the current study. Histograms indicated acceptable normality of the data (Figures 1 and 2). Mean RPR-V1 was 73.3 BPM (SD, 11.0) compared to 75.3 BPM (SD, 12.9) for RPR-V2. The difference here, of 1.9 BPM (SD, 8.6) was not quite statistically significant according to the paired t test (p = 0.06). A scatter plot of baseline RPR-V1V2 versus RPR change (Figure 3) suggested the presence of a weak posi-tive linear trend, with larger posiposi-tive increases being cor-related with higher baseline RPR (r = 0.231, p = 0.0491). Overall mean RPR-V1V2, which separated the groups into low and high RPR, was 74.3 BPM (SD, 11.2).
Mean RPR change in the low RPR group was -0.3 BPM (SD, 7.3; 95% CI, - 2.7 to 2.1). Mean RPR change in the high RPR group was + 4.4 BPM (SD, 9.3; 95% CI, 1.2 to 7.6 [Figure 4]). The mean difference in RPR change between the low and high RPR groups (low minus high) was -4.7 BPM (95% CI, -8.6 to -0.8) and statistically sig-Figure 1:
nificant (p = 0.02) with a large effect size of 0.57 (Table 2 and Figure 4).
As RPR tends to be slightly higher among females (whose RPR-V1V2 mean in the present study was 78.0, compared to 70.8 for males), and as the low and high RPR groups differ in terms of their distribution by sex, mean RPR change by both sex and group was estimated. In this regard, mean RPR change did not appear to be substan-tially different between sexes within groups (Table 2).
Discussion
As previously noted, a number of studies show the predict-ability of health outcomes based on one or an average of multiple resting heart rate values.19-21 In the present study,
the mean RPR-V1V2 was used as a classification measure and may potentially be an additional and convenient as-pect of RPR measurements to consider for predicting fu-ture health outcomes. Within individual subjects, average RPR-V1V2 values for the low RPR group ranged from 47-74 BPM versus 76-103 in the high RPR group (Table 2). These ranges overlap with some of the categories of patients from the Framingham Study21 (Table 1), which
specifically included groups defined by patients with 30-75 BPM and 76-220 BPM. In the Framingham study, participants were initially healthy, yet those with higher
baseline heart rates (e.g., 76-220 BPM) had higher death rates. Framingham study participants with initially higher heart rates were at greater risk of adverse health outcomes (i.e., cardiac death) even within in each of the two age categories of relevance to the current study (Table 1).
Limitations to the study
There are several limitations to this study. Participants were young, relatively healthy adults (most were in their 20s in terms of age). Thus, these results are only gener-alizable to a similar population spectrum. Both the clas-sification measure (RPR-V1V2) and the dependent vari-able (RPR change) in this study are calculated from the identical sets of measurements, that is, from RPR-V1 and RPR-V2. Given the mathematical correlation of these two measurements, the independent biological effect of base-line RPR on RPR change is not isolated in the current analysis. Furthermore, the estimation of baseline RPR was based on measurements on only two discrete days and therefore does not account for random variation in otherwise stable RPR measurements over multiple (more than 2) repeated measurements.
Future study ideas
The results from this pilot study provide necessary and Figure 3:
Scatter plot for baseline versus Visit 2 minus Visit 1 differences in RPR.
Figure 4:
Resting pulse rate (RPR) change in beats per minute (BPM) between two visits in low and high baseline
useful data for the planning of a future larger study. Pre-viously, no studies on short-term changes in RPR were available from which a sample size calculation could be made. The present study’s findings indicate that a sample size of 50 in each group would be needed to detect sta-tistically significant differences in RPR change between low versus high mean RPR- V1V2 groups, assuming 80% power, a two-tailed alpha of 0.05, mean RPR change of -0.3 BPM and standard deviation change of 7.3 in the low mean RPR V1-V2 group, versus a mean RPR change of + 4.4 BPM and standard deviation of change of 9.2 in the high mean RPR-V1V2 group. In the meantime, the current study was able to detect a statistically significant difference between groups with sample sizes of only 38 and 35 in each group.
In future studies on short term RPR changes, more than two time points could be used and, perhaps the mean of the individual differences over time could be used to represent RPR change. However, because of natural RPR variability over time, it will be necessary to measure RPR change over multiple time points, and over longer time periods, in order to determine the normative distribution of this variable.
As chiropractic visits are often days rather than months or years apart, particularly in the case of a new patient, the goal would be to demonstrate that short-term chan-ges in RPR are predictive of longer-term health outcomes when the short-term changes are used as a guide for deter-mining when the patient needs a chiropractic adjustment. Another important line of research on RPR change could be done in the context of the maintenance care patient, in whom the frequency of care is typically once a month or so. For this purpose, the predictive validity of 30-day RPR changes could be examined.
In the present study, the classification variable was de-rived using baseline RPR as a source variable, but future studies could include comparisons of other independent variables, such as heart rate variability (HRV) or self-rat-ed health perception. A similar study has been done pre-viously with respect to HRV but only during a single visit where the RPR and HRV were measured simultaneous-ly and therefore cross-sectionalsimultaneous-ly.15 In a future study,
one could examine for associations between, on the one hand, RPR change and, on the other hand, HRV and/or health-related quality of life over both the short-term and the long-term. Like RPR, HRV has a rather robust
evi-dence base.25-26 For neurological assessment on all visits,
RPR has an advantage over HRV in that RPR requires no special equipment to ascertain, and is therefore us-er-friendly and feasible to use during routine patient vis-its.
One other research idea would be to use a longitudinal study design involving patients who were, versus those who were not, receiving care based on RPR change and follow them for 10 years or so. Critical health outcomes, such as death rates, could then be compared between groups. In such a study, the effects of other factors such as age, gender, and other clinical variables of interest on death rates could be either statistically controlled for and therefore treated as mere confounders, or, alternatively, measured and therefore analyzed as important additional independent variables of interest.
Finally, to achieve a more comprehensive value for resting pulse rate, RPR change could be added to baseline RPR to obtain a type of “pulse index.” As an example, if two consecutive visits have RPR values of 70 and 72, this pulse index would be 73, calculated as follows:
Baseline: (70 + 72) / 2 = 71 RPR change: 72 – 70 = 2 Pulse index: 71 + 2 = 73
If the order of these two values was reversed, where there was a decrease in RPR on visit 2 compared to visit 1, the pulse index would be 69, calculated as follows:
Baseline: (72 + 70) / 2 = 71 RPR change: 70 – 72 = -2 Pulse index: 71 + (–2) = 69
In this type of pulse index, a lower number would be considered healthier than a higher number.
Conclusion
References
1. McDonald WP, Durkin KF, Pfefer M. How chiropractors think and practice: The survey of North American chiropractors. Seminars in Integrative Medicine. 2004; 2:92-98.
2. Sherman College focuses on vertebral subluxation. Sherman College of Chiropractic. Accessed on August 8, 2014 at: http://www.sherman.edu/chiropractic-education/ history/
3. Association of Chiropractic Colleges. 4.0 The subluxation. Chiropractic paradigm. Accessed on Sept 13, 2012 at: http://www.chirocolleges.org/paradigm_scope _practice.html
4. Owens EF. Chiropractic subluxation assessment: What the research tells us. J Can Chiropr Assoc. 2002;46(4):215-220.
5. Hart J. Resting pulse rate as a potentially useful autonomic marker for neurologically-based chiropractic practice. Internet Journal of Chiropractic. 2013; 2 (1), DOI: 10.5580/2ccc. Accessed on Aug 20, 2013 at: http://ispub.com/IJCH/2/1/14450
6. Mensink GBM, Hoffmeister H. The relationship between resting heart rate and all-cause, cardiovascular and cancer mortality. Eur Heart J. 1997; 18:1404-1410.
7. Verrier RL, Tan A. Heart rate, autonomic markers, and cardiac mortality. Heart Rhythm. 2009;6(11 Suppl):S68-S75. 8. Hsia J, Larson JC, Ockene JK, Sarto GE, Allison MA,
Hendrix SL, Robinson JG, LaCroix AZ, Manson JE. Resting heart rate as a low tech predictor of coronary events in women: prospective cohort study. Br Med J. 2009; 338:577-580.
9. Greenland P, et al. Resting heart rate is a risk factor for cardiovascular and noncardiovascular mortality. Amer J Epidemiol. 1999; 149:853-862.
10. Jouven X, Empana JP, Escolano S, Buyck JF, Tafflet M, Desnos M, Ducimetiere P. Relation of heart rate at rest and long term (> 20 years) death rate in initially healthy middle–aged men. Amer J Cardiol. 2009; 103:279-283. 11. Migliaro ER, Contreras P, Bech S, Etxagibel A, Castro M,
Ricca R, Vicente K. Relative influence of age, resting heart rate and sedentary life style in short-term analysis of heart rate variability. Brazilian J Med Biol Res. 2001; 34:493-500.
12. Nauman J, Janszky I, Vatten LJ, Wisloff U. Temporal changes in resting heart rate and deaths from ischemic heart disease. J Amer Med Assoc. 2011; 306:2579-2587. 13. Erikssen J, Rodahl K. Resting heart rate in apparently
healthy middle-aged men. Eur J Appl Physiol Occup Physiol. 1979; 42(1):61-69.
14. Runcie CJ, Reeve W, Reidy J, Dougall JR. A comparison of measurements of blood pressure, heart rate and
oxygenation during inter-hospital transport of the critically ill. Intensive Care Med. 1990; 16(5):317-322.
15. Hart J. Association between heart rate variability and manual pulse rate. J Can Chiropr Assoc. 2013;57(3):243-250.
16. Hart J. Reduction of resting pulse rate following chiropractic adjustment of atlas subluxation. Ann Vert Sublux Res 2014;March 3:16-21.
17. Zhang J, Dean D, Nosco D, Strathopulos D, Floros M. Effect of chiropractic care on heart rate variability and pain in a multisite clinical study. J Manip Physiol Ther. 2006;29:267-274.
18. Sato A, Swenson RS. Sympathetic nervous system response to mechanical stress of the spinal column in rats. J Manip Physiol Ther. 1984; 7:141-7.
19. Jouven X, et al. Heart rate and risk of cancer death in healthy men. PLoS ONE. 2011;6(8): e21310.
20. Zhang GQ, Zhang W. Heart rate, lifespan, and mortality risk. Ageing Res Rev. 2009:8(1):52-60.
21. Kannel WB, Kannel C, Paffenbarger RS, Cupples LA. Heart rate and cardiovascular mortality: The Framingham Study. Am Heart J. 1987; 113(6):1489-94.
22. Hwu YJ, Coates VE, Lin FY. A study of the effectiveness of different measuring times and counting methods of human radial pulse rates. J Clin Nurs. 2000; 9:146-152. 23. Centers for Disease Control and Prevention. About BMI
for adults. Accessed August 18, 2014 at: www.cdc.gov 24. Devore J, Peck R. Statistics: The exploration and analysis
of data. Pacific Grove, CA: Duxbury. 4th Edition. 2001:
410.
25. Lauer MS. Autonomic function and prognosis. Clev Clin J Med. 2009; S18-S-22.
26. Szajzel J. Heart rate variability: a noninvasive