Textile Texture Images
S.ANITHA*
Ph.d Research Scholar , Department of Computer Science Avinashilingam Deemed University for Women
Coimbatore-43 Dr.V.RADHA Associate Professor Department of Computer Science Avinashilingam Deemed University for Women
Coimbatore-43
Abstract
Texture analysis is an important approach in textile quality control. The investment in automated unit is more economical when reduction in labor cost and associated benefits are considered. Preprocessing in textile image is a crucial initial step before texture analysis is performed. Many preprocessing methods are available in the literature. Datasets are limited by laboratory constraints so that the need is for guidelines on quality and robustness, to proceed experimentation while image are yet restricted. In this paper, the performance of four preprocessing methods are compared namely Contrast adjustment, Intensity adjustment, Histogram equalization, Binarization and Morphological operation. The performances of these methods are evaluated using Peak Signal to Noise Ratio (PSNR) and Mean Square Error (MSE).
Key words: Image processing, preprocessing, image enhancement, PSNR, MSE
I. INTRODUCTION
Quality control, designed to ensure that defective products are not allowed to reach the customer. Visual inspection constitutes an important part of quality control in industry. Until recent years, inspection has been heavily relied upon human inspectors. Development of fast and specialized equipment, however, has facilitated the application of image processing algorithms to real-world industrial inspection problems. Since in many areas the quality of a surface is best characterized by its “texture”, texture analysis plays an important role in the automated visual inspection of surfaces.
Figure- 1 General structure of an automatic quality control system
Automatic error detection is performed by a specially design software able to compare in real time the textile texture image with the desired pattern of the textile material [1][3]. Preprocessing methods can dramatically improve the performance of image processing methods like Image transform, Segmentation, Feature extraction and Fault detection.
In this paper preprocessing algorithms are compared by the PSNR and MSE value. The paper is organized as follows: Section II discusses the need for preprocessing. Section III presents the preprocessing algorithm for textile images. The experimental evaluation is presented in section IV. Finally, conclusions are given in section V.
II. Need for preprocessing
Image acquisition is a highly important step for the automatic quality control because it provides the input data for the whole process. The acquisition is performed by an optical sensor which is always a video camera (with one line or a matrix of CCD) that provide accurate and noiseless image.Local illumination is directly linked with the quality of image acquisition because it is straight forward to demonstrate that its variations can heavily affect the patterns visibility in the textile texture image.
Consequently the natural sources of light which are non-constant must not be employed and their influence should be carefully eliminated. Thus the use of a strictly controlled illumination provides control, exclusively by one or more artificial light sources is the reasonable alternative.
III. PREPROCESSING METHOD FOR TEXTILE TEXTURE IMAGES
Preprocessing is the important method that influences automated detection of defects. The following are the preprocessing methods under study
(a) Contrast adjustment (b) Intensity adjustment (c) Histogram equalization
(d) Binarization
(e). Morphological operation
(a) Contrast adjustment
2(a) Original Image 2(b) Contrast adjusted image
Figure-2 Original image and image after contrast adjustment
(b) Intensity adjustment
Image enhancement techniques are used to improve an image, where "improve" is sometimes defined objectively (e.g., increase the signal-to-noise ratio), and sometimes subjectively (e.g., make certain features easier to see by modifying the colors or intensities).Intensity adjustment is an image enhancement technique that maps the image intensity values to a new range. The low-contrast image with its histogram and all the values gather in the center of the intensity range. Figure-3(a) shows the original image and 3(b) image after intensity adjustment
3(a) Original Image 3(b) Intensity adjusted image
Figure-3 Original image and image after Intensity adjustment
(c) Histogram equalization
4(a) Original Image 4(b) Histogram Equalized image
Figure-4 Original image and image after Histogram equalization
To make it simple, histogram equalization technique changes the pdf of a given image into that of a uniform pdf that spreads out from the lowest pixel value (0 in this case) to the highest pixel value (L – 1). This can
be achieved quite easily if the pdf is a continuous function. However, with a digital image, the pdf will be a discrete function. Suppose that for an image x, and for the dynamic range for the intensity r
k varying from 0 (black) to L – 1 (white), the pdf can be approximated using the probability expressed as follows ,
x
r
r
kk
p
(
)
where ‘rk’ total pixels with intensity and ‘
x
’ total pixels in image. From this pdf, one can then obtain the cumulative density function p(Sk) (cdf) as follows: The output pixels from the histogram equalization operation are equal to the cdf of the image. Mathematically it can be represented as,
1 0)
(
)
(
L k kr
p
x
to get the pixel value p(Sk),
1 0)
(
)
(
L k k kr
s
p
p
the resultant value is rounded to the nearest integer.
(d) Binarization
Binarization is a model-motivated approach, the image intensity distribution is used to create the binary version of the image.
where the mixing or prior probabilities, k, sum to 1. When the mixing proportions are assumed equal, the
5(a)Original Image 5(b) Binarized image
Figure-5 Original image and image after binarization
The Expectation-Maximization (EM) algorithm is then used to iteratively solve this [2]. The corresponding binarized images are shown in Figure-5.The model-based binarization addresses well-known data quality problems such as temporal calibration drift, coupled with spatial variability of sensitivity and illumination [5].
(e) Morphological Operation
Every texture image taken has been implemented with morphological reconstruction, extended maxima transformation using thresholding, the extended maxima transformation is the regional maxima computation of the corresponding H-maxima transformation. As a result, it produces a binary image. A connected-component labeling operation is performed, in order to evaluate the characteristics and the location of every object. The extended-maxima transform computes the regional extended-maxima of the H-Transform. Here H refers to nonnegative scalar [6]. Regional maxima are connected components of pixels with a constant intensity value, and whose external boundary pixels will have a lower value. Figure-6(a) shows the original image and 6(b) the image after morphological processing.
6(a)Original Image 6(b) H-maxima image
Figure-6 Original image and image after processing
IV. EXPERIMENTAL EVALUATION
To test the accuracy of preprocessing algorithms, the following three steps are used.
A textile texture image is taken as input.
Preprocessing algorithm is applied for texture image.
The MSE and PSNR value is calculated for different algorithm.
(a) Mean Square Error (MSE)
(b) Peak signal to Noise Ratio (PSNR)
(a) Mean Square Error (MSE)
The metric MSE is defined as:
For two m×n monochrome images I and K, one of the images is considered a noisy approximation of the other.
Other metrics like Root Mean Square Deviation RMSE, Mean Absolute Error MAE and PSNR are defined using MSE.
(b) Peak Signal to Noise Ratio (PSNR)
The PSNR is defined in logarithmic scale, in dB. It is the ratio of peak signal power to noise power. Since the MSE represents the noise power and the peak signal power, it is unity in case of normalized image signal. The image metric PSNR is defined as:
Here, MAXi is the maximum possible pixel value of the image.
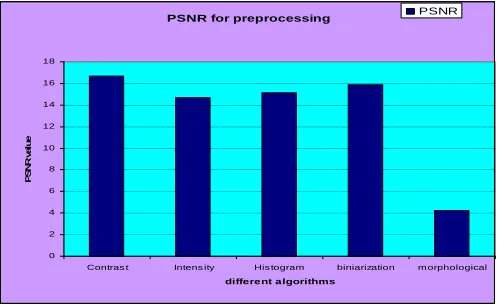
PSNR for preprocessing
0 2 4 6 8 10 12 14 16 18
Contras t Intens ity His togram biniarization m orphological
different algorithms
PS
N
R
val
u
e
PSNR
Figure 7 Comparison of different preprocessing algorithm by PSNR
0.00E+00 5.00E+02 1.00E+03
Contras t Intens ity His togram biniarization m orphological
different algorithsm
M
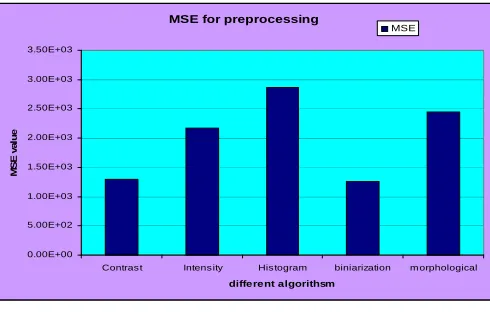
Figure 8 Comparison of different preprocessing algorithm by MSE
From the figures it can be concluded that contrast adjustment technique gives high PSNR value and low mean square rate. So the contrast adjustment technique gives desirable results compared to other preprocessing technique.
V CONCLUSION
Textile industry need, automatic real time quality control in order to avoid end products defects in a quick and efficient manner. Manual control is inefficient, time consuming that leads to heavy material loss. On other hand automatic quality control is much more efficient, because it is real time and independent from manual efficiency. Even good quality cameras are used with an adequate artificial illumination it is necessary to pre-process those images before applying image processing methods. The different preprocessing techniques like contrast adjustment, intensity adjustment, histogram equalization, binarization and morphological operation is applied. These algorithms are evaluated using Peak Signal to Noise Ratio and Mean Square Error. The contrast adjustment and binarization gives suitable results and contrast adjustment is found to better with high PSNR and low MSE values.
REFERENCES
[1] D.P. Brzaković, P. R, Bakić, N. S. Vuiovic, and H. Sari-Sarraf, “A Generalized development environment for inspection of web materials,”
Proc. IEEE Intl. Conf. Robotics and Automation, Albuquerque, New Maxico, pp. 1-8, Apr. 1997.
[2] Celeux G. and Govaert G. 1995. “Gaussian parsimonious clustering models” Pattern Recognition, 28(5), 781–793.
[3] Dan Laurentiu, Adraiana Balta, University of timisora, “ Real Time Texture error Detection”, Anale saria informatica, Vol. VI fasic,P.No.127-134, year 2008.
[4] Y. Wang, Q. Chen and B. Zhang. 1999. Image enhancement based on equal area dualistic sub-image histogram equalization method. IEEE Trans. on Consumer Electronics. 45(1): 68-75.
[5] J. G. Campbell, C. Fraley, D. Stanford,F. Murtagh A. E. Raftery , “Model based method for fault detection”, Jhon Wiley, Vol.10, P.No.339-346, year 1999