Numerical Analysis of Wind loads on Tapered
Shape Tall Buildings
Ashwin G Hansora Paresh N Nimodiya
Assistant Professor Assistant Professor
Department of Applied Mechanics Department of Applied Mechanics
L.D. College of Engineering, Ahmedabad Vishwakarma Govt. Engineering College, Ahmedabad
Kailashkumar P Gehlot
Student
Department of Applied Mechanics L.D. College of Engineering, Ahmedabad
Abstract
The development of high strength concrete, higher grade steel, new construction techniques and advanced computational technique has resulted in the emergence of a new generation of tall structures that are flexible, low in damping, slender and light in weight. These types of flexible structures are very sensitive to dynamic wind loads and adversely affect the serviceability and occupant comfort. Thus, aerodynamic modification has become an important aspect of tall building design process. Various aerodynamic modifications on building could be made in order to improve the aerodynamic performance. To ensure the functional performance of tall flexible structures and to control the wind induced motion of the tall buildings various types of aerodynamic modifications to the shape/geometry of the buildings are possible. The purpose of the present work is to investigate the effect of height to width ratio of tapered shape tall building on wind pressure coefficient distribution around different surface of building models. For the present study height to width ratio 3, 3.5, 4, 4.5 and 5 are taken to study the wind pressure coefficient variation along height. The results show that height to width ratio has significant effect on wind pressure coefficient distribution around building.
Keywords: Tapered, Pressure Coefficient, H/B Ratio, Computational Fluid Dynamics, k-ε Method
________________________________________________________________________________________________________
I.
I
NTRODUCTIONThe current tallest building in the world is the 828 m-high Burj Khalifa, which is over 300 m higher than Taipei 101, and the tallest buildings in the next decade will be Kingdom Tower (over 1000 m), which will be completed in 2018, making Burj Khalifa the third tallest building (http://www.skyscrapercenter.com/List/future-tallest-100-buildings, 2012). Current trend of tall building construction, i.e., manhattanization with various building shapes, requires attention. Their freewheeling building shapes are expressed by taper, set-back, helical, openings, or combinations of these, reflecting architects’ and engineers’ challenging spirits for new forms. These irregular and unconventional building shapes are a resurrection of an old characteristic, motivated by new trends in architecture, but they have the advantage of mitigating across-wind responses, which is a major factor in safety and habitability of tall buildings.
The effectiveness of aerodynamic modifications in reducing wind loads has been widely examined, and they can be tentatively classified as corner modification and height modification (Kim and Kanda, 2010a). Corner modification includes corner cut, recess, chamfer and addition of fins (Kawai, 1998; Kwok et al., 1988), and height modification includes taper, set-back, opening, helical (twisting) and inclined (tilted) shape, and so on (Dutton and Isyumov, 1990; Kim and Kanda, 2010a). In particular, Tanaka et al. (2012) conducted a series of wind tunnel tests to investigate aerodynamic characteristics and to evaluate the most effective building shape in wind-resistant design for 31 tall buildings with various aerodynamic modifications. Unlike structural modification, this controls mass, spring and damping directly in a governing equation of motion, aerodynamic modification controls forces applied to tall buildings by altering the separated shear layer or disturbing the alignment of the vortex over the whole height.
II.
M
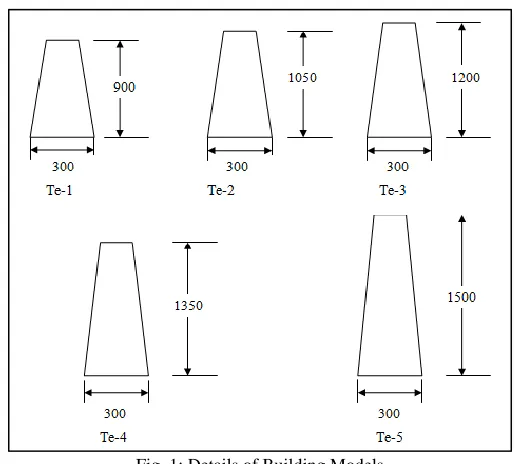
ETHODOLOGYDimensions and Designation of Model: A.
Fig. 1: Details of Building Models
Table - 1
Model shape and designation Length(mm) Breadth(mm) Height(mm) Side Ratio
Tapered-1 (Te-1) 335.5 268.5 100 1.25
Tapered-2 (Te-2) 367.5 245 100 1.5
Tapered-3 (Te-3) 397.5 226.5 100 1.75
Tapered-4 (Te-4) 424.5 212.2 100 2.0
Tapered-5 (Te-5) 450 200 100 2.25
Solution Strategy: B.
Numerical simulations were carried out using Computational Fluid Dynamics (CFD) package ANSYS CFX 14.0. Standard k-ε method was used to numerically formulate the viscosity and turbulence. The governing equations are as follows.
The standard k-Ɛ model is a typical example of a two-equation turbulence model. In this case an equation for the turbulent kinetic energy and its dissipation are used to determine the eddy viscosity.
̅̅̅̅̅̅̅ ( ̅̅̅̅ ̅̅̅̅ ̅̅̅̅) (1)
It can be observed that the eddy viscosity is dependent on the turbulent kinetic energy, k, and an unknown constant and an unknown length scale.
(2) The governing equations for determining k & ε are
ε [( ) ] (3)
ε ̅̅̅̅̅̅̅̅ (4) ε
ε
ε
ε
ε ε [(
ε)
ε
] (5)
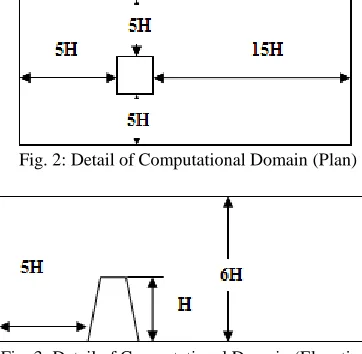
Details of Domain: C.
The analysis was carried out on Tapered shape model having different height to width ratio but same cross sectional area. A domain having 5H upwind fetch, 15H downwind fetch, 5H top clearance and 5H side clearance, where H is the height of the model, is considered as per Franke’s recommendation [3] (Fig. 3). Such a large size provides enough space for generation of vortex on the leeward side and avoids backflow of wind. Moreover no blockage correction is required.
Fig. 2: Detail of Computational Domain (Plan)
Fig. 3: Detail of Computational Domain (Elevation)
Boundary Condition: D.
The flow at inlet was simulated similar to that of terrain category 2 as per Indian standard for wind load IS: 875 (part 3) – 1987. Inlet velocity was considered as 10m/s. The power law is used for generating the boundary layer flow at inlet. The outlet was considered as pressure outlet.The no slip boundary conditions are applied to the surfaces of Building Model. The velocity profile near the windward side as obtained from numerical method is shown in Fig. 3.
Fig. 4: Velocity Profile at Inlet
III.
R
ESULT ANDD
ISCUSSIONRectangular (Re-1): A.
(a.) (b.) (C.)
Rectangular (Re-2): B.
(a.) (b.) (c.)
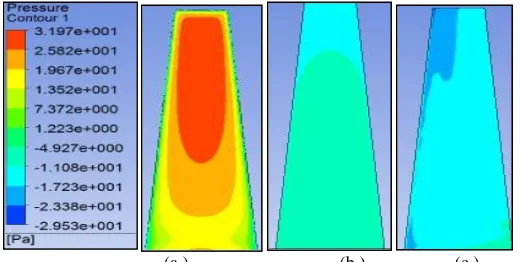
Fig. 6: (A) Pressure Contour of Windward Face (B) Pressure Contour of Leeward Face (C) Pressure Contour of Sidewall
Rectangular (Re-3): C.
(a.) (b.) (c.)
Fig. 7: (A) Pressure Contour of Windward Face (B) Pressure Contour of Leeward Face (C) Pressure Contour of Sidewall
Rectangular (Re-4): D.
(a.) (b.) (c.)
Fig. 8: (A) Pressure Contour of Windward Face (B) Pressure Contour of Leeward Face (C) Pressure Contour of Sidewall
Rectangular (Re-5): E.
(a.) (b.) (c.)
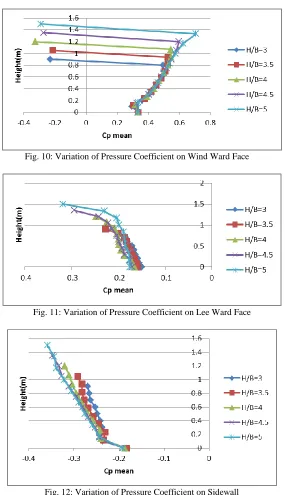
Fig. 10: Variation of Pressure Coefficient on Wind Ward Face
Fig. 11: Variation of Pressure Coefficient on Lee Ward Face
Fig. 12: Variation of Pressure Coefficient on Sidewall
IV.
P
RESSURE DISTRIBUTIONS ON MODELSThe evaluated mean pressure at a particular grid point locations non-dimensionalized to evaluate the mean pressure coefficients along the considered wind direction by 1/2 v2,where is the density of air (1.226 kg/m3), v is the free stream velocity at the roof level of the building model(10 m/s).
Dynamic Pressure = 1/2 v2
V.
C
ONCLUSIONIn the present study effect of change in H/B ratio of tapered building is studied by computational fluid dynamics technique. Outcome of above study is summarised below
1) The absolute values of peak pressure coefficient on windward face of tapered shape building increases with increasing H/B ratio.
2) Smallest and largest negative mean pressure coefficient on leeward face of building increases with increasing H/B ratio while on side surface of building smallest negative mean pressure coefficient are nearly same for all H/B ratio while largest mean pressure coefficient increases with increasing H/B ratio.
R
EFERENCES[1] Kim, Y.C., Kanda, J., 2010b. Effects of taper and setback on wind force and wind-induced response of tall buildings. Wind and Structures 13 (6), 499–517 [2] ASCE: 7-02 (2002). “Minimum Design Loads for Buildings and Other Structures”, Structural Engineering Institute of the American Society of Civil
Engineering, Reston.
[3] Franke, J., Hirsch, C., Jensen, A., Krüs, H., Schatzmann, M., Westbury, P., Miles, S., Wisse, J. and Wright, N.G. (2004). “Recommendations on the use of CFD in wind engineering, COST Action C14: Impact of Wind and Storm on City Life and Built Environment, von Karman Institute for Fluid Dynamics. [4] Halder, L. , Dutta, S.C., (2010) . “Wind effects on multi-storied buildings: A critical review of Indian codal provisions with special reference to American
standard”, Asian journal of civil engineering (Building And Housing) VOL. 11, NO. 3 Pages (345-370)
[5] Lin, N., Letchford, C., Tamura, Y. and Liang, B., (2004).“Characteristics of Wind Forces Acting on Tall Buildings”, Journal of Wind Engineering and Industrial Aerodynamics, Volume 93, Pages - 217–242.
[6] IS: 875 – 1987 “Indian Standard Code of Practice for Design Loads (Other than Earthquake) For Buildings And Structures, Part 3 (Wind Loads)” Bureau Of Indian Standards, New Delhi.
[7] Hayashida H, Iwasa Y (1990) “Aerodynamic shape effects of tall building for vortex induced vibration” J Wind Eng Industrial Aerodynamics 33:237–242 [8] Dutton, R., Isyumov, N., 1990. Reduction of tall building motion by aerodynamic treatments. Journal of Wind Engineering and Industrial Aerodynamics