ISSN (e): 2250-3021, ISSN (p): 2278-8719
Vol. 05, Issue 11 (November. 2015), ||V2|| PP 16-24
Vibration Analysis for Different Materials of Single Point Cutting
Tool during Turning
1.
Mr. T.Eswara Rao,
2.Mr. G.Bala Murali
1.Assistant Professor Dept of Mech Engg GIET GUNUPUR 2.
Assistant Professor Dept of Mech Engg. GIET GUNUPUR
Abstract: - The present work involves the study of tool deflection and tool failure due to vibrations while turning on the lathe. The problem of tool failure monitoring in machining operations, has been an active area of research for quite a long time. The accurate prediction of tool failure or fracture is important to have a better product quality and dimensional accuracy. In This work Experiments were performed with mild steel as work piece and HSS, STAINLESS STEEL, CEMENTED CARBIDE and CBN (Cubic Boron Nitride) as a tool material and the various machining forces have been measured experimentally. Cutting tool model being designed by taking existing cutting tool dimensions. Finite element analysis is done using ANSYS 14.5 software tool to find frequencies of HSS STAINLESS STEEL, CEMENTED CARBIDE and CBN cutting tools. Modal analysis has been done to determine the minimum vibrations for a particular rake angle for the cutting tool.
Keywords: Ansys Software ,vibration analysis ,Cutting tool ,Nose radius, Rake angle
I. INTRODUCTION
In this project, an advanced FEM simulation technique is utilized to investigate the physical cutting process for predicting ―Vibration Analysis of Single Point Cutting tool. There has been a great deal of research on single point cutting tool analysis and large body of literature on single point cutting tool has been published. FEM based simulation of machining processes has been providing a better understanding for deflection & vibration in cutting zones, and resulting stress and temperature fields. The premise of the numerical models is to be able to lead predictions in machinability, tool wear, tool failure, and surface integrity on the machined surfaces. Success and reliability of numerical models is basically dependent upon work material flow stress models in function of strain, strain rate and temperatures, also on friction parameters between the tool and work material interfaces. There has been a considerable amount of research devoted to analyze the effect of machining variables such as speed, depth of cut, temperature, and cutting forces on the tool by using modelling and Analysis software ANSYS. Predicting the numerical process, temperature and stress fields accurately play a pivotal role for predictive process engineering for high speed machining processes. Tool edge geometry is very important, because its influence on obtaining most important tool life and surface integrity is considered significant.
1.1. INTRODUCTION OF SINGLE POINT CUTTING TOOL:- [2]
Parameters used for designing the cutting tool is:- 1 Back Rake angle
2 Side Rake angle 3 End relief angle 4 End cutting edge angle 5 Side cutting Edge angle 6 Nose Radius
1.2. BRIEF OVERVIEW OF FINITE ELEMENT ANALYSIS [3]
An analytical solution is a mathematical expression that gives values of the desired unknown quantity at any location in a body (or structure) and as a consequence, it is valid for an infinite number of locations in the body. However, analytical solutions can be obtained only for simple engineering problems. It is extremely difficult and many a times impossible to obtain the exact analytical mathematical solutions for many complex engineering problems. In such cases, the technique known as Finite Element Method (FEM) is used.
1.2.1 Applications of FEA [4]
This method was original developed for structural analysis. However the general nature of the theory on which it is based has made problem. In other field of engineering such as Mechanical design, Mechanical vibration, Heat transfer, Fluid flow, soil and Rock Mechanics, Bioengineering, Aeronautics.
The different types of analysis carried out by Finite element Analysis are: 1. Static linear analysis.
2. Static Non-linear analysis. 3. Dynamics linear analysis. 4. Dynamics Non-linear analysis. 5. Fluid flow analysis
1.2.2 Steps Involved In the Finite Element Analysis:-[9] 1 Discretization of the continuum
2. Formation of element stiffness matrices:- The element stiffness matrices in global coordinate system is given by [K] e = [L]T[K1]e[L]
3. Formation of global stiffness matrix: - [K] = [K] e 4. Formation of global load vector: - {F} = {f} e
5. Formation of global nodal displacement vector: - {UN}
6. Assembly of global stiffness-nodal displacement-load equations: - [K] {UN} = {F} 7. Incorporation of specified boundary condition
8. Solution of simultaneous equation
9. Computation of element strains and stresses:- The components of strains at any point within the element are given by, {Î} = [B] {UN} similarly, the components of stresses at any point within the element are given by, {S} = [D] [Î]
Where,
[B] = Element strain-nodal displacement matrix. [D] = Element stress-strain matrix.
1.3 ANSYS:- [5]
ANSYS is a general purpose software, used to simulate interactions of all disciplines of physics, structural, vibration, fluid dynamics, heat transfer and electromagnetic for engineers.
So ANSYS, which enables to simulate tests or working conditions, enables to test in virtual environment before manufacturing prototypes of products. Furthermore, determining and improving weak points, computing life and foreseeing probable problems are possible by 3D simulations in virtual environment.[8]
1.3.1 Ansys Application:- [6]
S.NO Application Task
1 Design Modeler, Assembly , Drafting setup Mechanism design
2 Drafting Drawing
3 Simulation Modeling, Boundary condition,Meshing,Post processor,Optimisation 4 Manufacturing Modeler, Generative machining,
II.
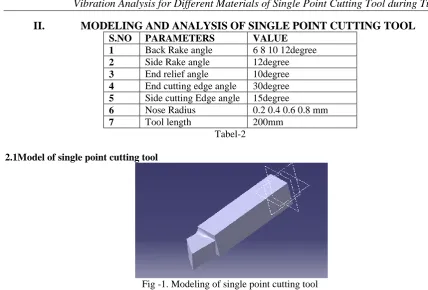
MODELING AND ANALYSIS OF SINGLE POINT CUTTING TOOL
S.NO PARAMETERS VALUE
1 Back Rake angle 6 8 10 12degree 2 Side Rake angle 12degree 3 End relief angle 10degree 4 End cutting edge angle 30degree 5 Side cutting Edge angle 15degree
6 Nose Radius 0.2 0.4 0.6 0.8 mm
7 Tool length 200mm
Tabel-2
2.1Model of single point cutting tool
Fig -1. Modeling of single point cutting tool
Figure -1 is the model of cutting tool that is designed by using the catia software with the dimension of existing tool
2.2 Vibration analysis of single point cutting for different materials Materials Used:-
1. Stainless steel 2. HSS
3. Cemented carbide
4. Cubic boron nitride (CBN)
Fig-2 Imported model of cutting tool from the catia
Fig-3 Meshing
Figure-3 represents the meshing that is done to the single point cutting tool for vibration analysis. Meshing is dividing the body in to finite number of elements
Fig-4 .Applying the constraints
Figure -4 represents the applying the constraints to the single point cutting tool in such way that how it is inserted in the tool post during turning operation.[10]
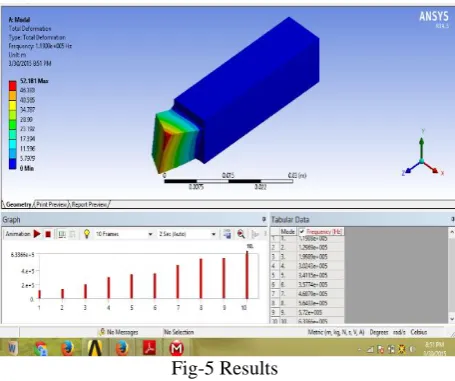
Fig-5 Results
III.
RESULTS
3.1 Frequencies for different angle and different nose radius of stainless steel Angle Nose Radius Frequency
6 0.2 0.4 0.6 0.8 2.2079e+005 2.21e+005 2.2123e+005 2.2149e+005 8 0.2 0.4 0.6 0.8 2.2038e+005 2.2053e+005 2.2074e+005 2.2099e+005 10 0.2 0.4 0.6 0.8 2.2011e+005 2.2022e+005 2.2041e+005 2.2064e+005 12 0.2 0.4 0.6 0.8 2.189e+005 2.1896e+005 2.1903e+005 2.1911e+005 Tabel-3
3.2. Frequencies for different angle and different nose radius of HSS material Angle(Degree) Nose
Radius(mm) Frequency(Hz) 6 0.2 0.4 0.6 0.8 2.2894e+005 2.2915e+005 2.2939e+005 2.2966e+005 8 0.2 0.4 0.6 0.8 2.2851e+005 2.2867e+005 2.2888e+005 2.2914e+005 10 0.2 0.4 0.6 0.8 2.2823e+005 2.2835e+005 2.2854e+005 2.2877e+005 12 0.2 0.4 0.6 0.8 2.2698e+005 2.2703e+005 2.2711e+005 2.2719e+005 Tabel-4
3.3: Frequencies for different angle and different nose radius for CEMENTED CARBIDE Angle Nose Radius Frequency
10 0.2 0.4 0.6 0.8 2.7071e+005 2.7088e+005 2.7115e+005 2.747e+005 12 0.2 0.4 0.6 0.8 2.6645e+005 2.6698e+005 2.6769e+005 2.6892e+005 Table-5
3.4: Frequencies for different angle and different nose radius for CBN
Angle(Degree) Nose Radius(mm) Frequency(Hz)
6 0.2 0.4 0.6 0.8 6.3366e+005 6.3418e+005 6.3478e+005 6.3552e+005 8 0.2 0.4 0.6 0.8 6.3243e+005 6.3285e+005 6.3343e+005 6.3412e+005 10 0.2 0.4 0.6 0.8 6.6554e+005 6.6586e+005 6.6641e+005 6.6704e+005 12 0.2 0.4 0.6 0.8 6.6033e+005 6.6046e+005 6.6065e+005 6.6084e+005 Table-6
IV.
GRAPHS
4.1. Graph between nose radius of cutting tool and frequency of Stain less Steel material for different angles
2.185E+05 2.190E+05 2.195E+05 2.200E+05 2.205E+05 2.210E+05 2.215E+05 2.220E+05
0 0.2 0.4 0.6 0.8 1
F
re
que
nc
y
Nose radius
Nose radius Vs Frequency
6 degree angle 8 degree angle
4.2. Graph between nose radius of cutting tool and frequency of HSS material for different angles.
Graph-2
4.3. Graph between nose radius of cutting tool and frequency of Cemented carbide material for different angles
Graph-3
4.3. Graph between nose radius of cutting tool and frequency of CBN material for different angles 2.265E+05
2.270E+05 2.275E+05 2.280E+05 2.285E+05 2.290E+05 2.295E+05 2.300E+05
0 0.2 0.4 0.6 0.8 1
F
re
que
nc
y
Nose radius
Nose radius Vs Frquency
6 degree angle 8 degree angle
10 degree angle 12 degree angle
2.660E+05 2.670E+05 2.680E+05 2.690E+05 2.700E+05 2.710E+05 2.720E+05 2.730E+05 2.740E+05 2.750E+05 2.760E+05
0 0.2 0.4 0.6 0.8 1
Fre
q
u
en
cy
Nose radius
Nose radius vs Frequency
6 degree angle 8 degree angle
Graph-4
V.
CONCLUSION
Graphs shows frequency variation for the different nose radius of different materials .Graphs has been plot for different for different nose radius and frequency that is obtained from the vibration analysis of single point cutting tool by varying the rake angles. From the graphs it is observed that for stainless steel and HSS materials 12 degree angle has low frequency during the machining, for the CBN material low frequency is at 6 and 8 degree and for the cemented carbide material 12 degree angle is having low frequency.
The Modal and Harmonic analysis gives some useful results in relation to change in rake ANGLE and FREQUENCIES for different work material while machining with High speed steel tool, Stainless steel tool, cemented carbide tool, and CBN tool which will be useful in developing turning process optimization with respect to tool consumption and tool failure, tool life prediction. The focus should be on choosing an appropriate combination of proper rake angles as well as nose radius for different materials while machining to avoid the effect of vibration on the cutting material as well as tool for ex: - rough surface and tool breakage, which will be helpful in proper manufacturing automobile parts and other structural parts contributing to the cost reduction in the overall production process as well as proper finishing of the surface.
VI.
ACKNOWLEDGEMENT
I gratefully acknowledge my indebtedness and offer sincere thanks to Dr. M.M.M.Sarkar, Vice chancellor of JNTU Ananthapur for providing me an opportunity to carry out this research work
Finally, I whole heartedly thank my family for motivating me with their patience and love.
REFERENCES
[1]. Analysis And Modeling Of Single Point Cutting (Hss Material) Tool With Help Of Ansys For Optimization Of (Transient) Vibration Parameters.
[2]. By Prabhat Kumar Sinha, Rajneesh Pandey, Vijay Kumar yadav ISSN 0976 – 6340 (Print) ISSN 0976 – 6359 (Online) Volume 5, Issue 6, June (2014), pp. 14-27
[3]. Finite Element Analysis of Von Misses Stresses &Deformation at Tip of Cutting Tool. By Maheshwari N Patil Shreepad Sarange
[4]. Effect of cutting parameters on surface roughness and cutting forces in turning mild steel by Research journal of recants sciences vol.1 (10), 19-26, October (2012) for standard design parameters for tool design.
[5]. Eiji Nabata, Yuji Terasaka Jig Rigidity Evaluation Technology by Vibration Analysis, VOL.52, 2006. [6]. R S Rajpurohit and R S Prasad, ―Analysis of Mechanical Structure Under Vibration using Vibration
Measuring System‖, International Journal of Mechanical Engineering & Technology (IJMET), Volume 4, Issue 1, 2013, pp. 134 - 141, ISSN Print: 0976 – 6340,ISSN Online: 0976 – 6359.
[7]. K. O’Shea, Enhanced vibration control of ultrasonic tooling using finite element analysis, in: 1991 ASME Design Tech. Conf., Miami, DE 37, ASME (1991) 259–265.
6.300E+05 6.350E+05 6.400E+05 6.450E+05 6.500E+05 6.550E+05 6.600E+05 6.650E+05 6.700E+05
0 0.2 0.4 0.6 0.8 1
F
re
que
nc
y
Nose radius
Nose radius Vs frquency
6 degree angle 8 degree angle
[8]. V.K. Jain, P.C. Pandey, Tooling design forECM—a finite element approach, J. Eng. Ind., ASME 103 (2) (1981) 183-191
[9]. J.S. Strenkowski, J.T. Carroll, A finite elementmodel of orthogonal metal cutting, J. Eng. Ind., ASME 107 (1985) 349–354.
[10]. K. Marchelek, S. Berczynski, A. Witek, Modification of machine tool dynamical properties using vibration absorbers, in: ASME Design Technology Conference, Montreal, DE 18-2, ASME (1989) 85– 90.