INTERNATIONAL JOURNAL OF ENGINEERING SCIENCES
& MANAGEMENT
ANALYSIS OF IMAGE COMPRESSION RATIO USING HAAR AND DB
WAVELET TRANSFORM WITH DIFFERENT FILTERS
Bhushan Kharche
1, Prof. Geetesh Wagadre
2, Prof. Sameena Zafar
3, Prof. Hemant Soni
4M. Tech. Scholar
1, Asst. Prof. & HOD
2, Asst. Prof. & Head academic
3, Asst. Prof.
4Department of Electronics and Communication Engineering
PATEL COLLEGE OF SCIENCE & TECHNOLOGY, BHOPAL (M.P.) India
ABSTRACT
Image compression is an important field of research, students and that has been studied for nearly three decades now. Compression of images has numerous applications in diverse areas such as high definition videophones, television, medical imaging, on-line product catalogs and other multimedia applications. Another important application is browsing, where the focus is on getting high compression. For many years, the most popular image compression technique was based on the discrete cosine transform. Virtually all image compression algorithms exploit this statistical structure to devise a compressed representation of an image. In this paper we used de-noising filter (Wiener filter and Median filter) with the Haar wavelet and db2 wavelet at the transmission and receiver side and also used flat fading Reyligh is used as wireless channel for transmission of image on wireless medium with QPSK and 8-PSK modulation. Performance of these systems is measured by SER and BER plot with respect to SNR. The experimental result shows that the proposed scheme maintains the accuracy of compression, transmission and decompression of image.
Keyword: Image Corporation, Reyligh Channel, Haar wavelet and Daubechies wavelet (Db) wavelet, Wiener filter and Median filter, PSNR, CR etc.
INTRODUCTION
Image compression techniques are based on reduction of the number of bits required to store or transmit images without any or less loss of information. The main basis of the reduction process is the removal of redundant data or bits. Data redundancy is the major issue in digital image compression. For data compression, we reduce the number of bits required to represent a given quantity of information. In most digital images, the neighboring pixels are correlated each other so it have redundant information. The most task then is to find less correlated pixels representation of the image. In recent years, digital images are becoming more and more important. Digital cameras are now rather cheap and technically mature. As a consequence, digital images are replacing conventional analog images in almost every field. Examples range from holiday pictures to medical images, like x-ray tomography. So, there is a natural need to store images on a computer and also to transmit them over the internet, to share them with other persons [3]. The big problem is that digital images are quite memory-consuming,
and so a need to compress images is also quite natural if one wants to store lots of images with a rather high resolution or wants to transmit these images via a channel with limited bandwidth. Although memory is getting cheaper and cheaper these days it is still not unlimited and also the number and even more severe the resolution of images one may want to store has increased in the last years.
WAVELET TRANSFORM
Wavelet transform analysis introduces a windowing technique with variable-sized regions. In wavelet transform, we use of shorter regions with high frequency information and long time intervals with more precise low frequency information is needed. In place of time-frequency region, wavelet transform use a time-scale region for contrast with the time-based, frequency-based, and STFT views of a signal [7].
duration. And where sine waves are smooth and predictable, wavelets transform to be irregular and symmetric.
Fig.1 Sinusoidal wave
Fourier transform consists of breaking up a signal into sine waves of various frequencies and wavelet transform is the breaking up of a signal into shifted and scaled versions of the original (or mother) wavelet. Looking at pictures of wavelets and sine waves, we may see intuitively that signals with sharp changes can be better analyzed with an irregular wavelet transform than with a smooth sinusoid, etc; as some foods are better handled with a fork than a spoon.
A. Haar Wavelet
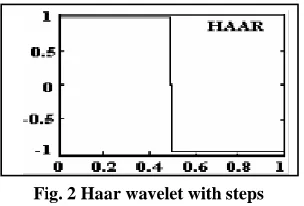
In 1909 first Discrete Wavelet Transform (DWT) was invented by the Alfred Haar, Hungarian mathematician. For the space of square integral functions on the real line, he used these functions to give for example of a countable orthonormal system. These wavelet is discontinuous type, and resembles a step function. It represents the same wavelet as Daubechiesdb1 [14]. These wavelet transform may be considered to simply input value’s pair, storing the difference value and passing the sum, when input represented by a list of numbers. These process is repeated recursively, pairing up the value of sums to provide the next scale, finally resulting in differences values and one final sum. These wavelet transformation is a simple form of compression which involves averaging and differencing terms, storing their detail coefficients, eliminating data, and reproduce the matrix such manner that the resulting matrix is similar to the initial matrix. One nice feature of the Haar wavelet transform is that the transform is equal to its inverse. As each transform is computed the energy in the data in relocated to the top left hand corner; i.e. after each transform is performed the size of the square which contains the most important information is reduced by a factor of 4. The technical disadvantage of these wavelet is that it is not continuous wavelet, and therefore not differentiable.
Analysis of monitoring of tool failure in machines is done by this wavelet.
Fig. 2 Haar wavelet with steps
B. Daubechie wavelet
These Daubechies wavelets are chosen to have the highest number A of vanishing moments, means this does not imply the best smoothness for given width N=2A, and on the
2𝐴−1possible solutions that one is chosen which scaling
filter has external phase[14]. For fast wavelet transform is easy to put into practice. These wavelets are mainly used for solving self-similarity properties of a signal or fractal problems, signal discontinuities.Ingrid Daubechies, making discrete wavelet analysis practicable to compactly supported orthonormal wavelets. Daubechies family wavelets names are written db N, where N stands for order of wavelet, and db stands for the “surname” of the wavelet. The db1 wavelet, as mentioned above, is the same as Haar wavelet. Haar and Daubechie’s wavelets both have orthogonality, and they has some nice features:
1. Wavelet function and the scaling function are the same for forward and inverse transform.
2. Different subspaces between the correlations in the signal are removed. The Haar wavelet transform is the simplest type of wavelet, one to implement, and fastest compare to other wavelet. But its discontinuity, it makes difficult to simulate a continuous signal, is main drawback.
Fig.3 Waveforms of various versions of daubechies wavelet
Powerful linear techniques, such as Wiener filtering, are meaningful only when additive noise is present Wiener uses a pixel wise adaptive Wiener technique based on statistics approximate from a local neighborhood of every pixel. Main purpose of the Wiener filter is to filter out the noise that has corrupted a signal. Wiener filter is based on a statistical approach. Most filters are designed for a needed frequency response. These filter deals with the filtering of image by different methods from a different point of view. In One method, we have knowledge of the noise and spectral properties of the original signal. We deals with the Linear Time invariant filter whose output comes to be as closed as to the original signal as possible in another method. Weiner filter was adopted for filtering in the spectral domain. Wiener filter (a type of linear filter) is applied to an image adaptively, tailoring itself to the local image variance. Where the variance is large, Wiener filter performs little smoothing. Where the variance is small, Wiener performs more smoothing. The Wiener filtering is a linear estimation of the original image. The approach is based on a stochastic framework.
MEDIAN FILTER
Spatial filtering operation is performed on Median filter , so it uses a 2-D mask type that is applied to each pixel in the input image. It is used to remove defects and noise from pictures mostly "salt and pepper" noise. One effective use of median filters has been the reduction of high-frequency and impulsive noise in digital images without the extensive blumng and edge destruction associated with linear filters. Because the median filter is nonlinear, spectral analysis gives little insight into the filtering process. Deterministic and statistical properties of that filters are used to describe the filter's effect on signals , which contain noise. In a recent publication, the author has studied the functional optimization properties of median-related filters[20]. Mean filter replaces the mean of the pixels values but it does not preserve image details. Some details are removes with the mean filter. We should replaces with the median of those values in median sorting of neighboring pixel values. The median is calculated by first sorting all the pixel values from the surrounding neighborhood into numerical order and then replacing the pixel being considered with the middle pixel value.
BLOCK DIAGRAM OF PROPOSED
METHODOLOGY
Transmitter Section
Receiving Section
Fig. 4: Block Diagram of proposed metrology
RAYLEIGH FADING CHANNEL
NLOS (indoor, city) Rayleigh fading occurs when there is no multipath LOS between transmitter and receiver and have only indirect path which is called NLOS to receive the resultant waves. The Rayleigh Fading is one kind of model which propagates the environment of radio signal.
Fig. 5: NLOS prorogation
Rayleigh fading works as a reasonable model when many objects in environment which scatter radio signal before arriving of receiver. When there is no propagation dominant during line of sight between transmitter and receiver on that time Rayleigh Fading is most applicable. On the other hand Rician Fading is more applicable then Rayleigh Fading when there is dominant line of sight. During our simulation we used Rayleigh Fading when we simulate the performance of Bit Error Rate (BER) verses Signal to Noise Ratio (SNR).
Haar / Db2 Wavelet
PSK Modulation De- noising
Filter Original
Image
Received Image Inverse Wavelet
Haar / Db2 De- noising
Filter De-
Modulation
A. Rayleigh Fading Distribution
In mobile radio channels, the Rayleigh distribution is commonly used to describe the statistical time varying nature of the received envelope of a flat fading signal, or the envelope of an individual multipath component. It is well known that the envelope of the sum of two quadrature Gaussian noise signals obeys a Rayleigh distribution. The Rayleigh distribution has a probability density function (pdf) [18] given by:
P(r) = {
𝑟 𝜎2exp (−
𝑟2 2𝜎2) ,
0, (𝑟 < 0) (0 ≤ 𝑟 ≤ ∞)
(3)
SIMULATION RESULTS
The simulation result presented in the thesis focuses mainly on Compression ratio, PSNR and MSE which typically affects the picture quality. Most of the times as researchers go on increasing the compression ratio the quality of the resulting image use to go down. for the proposed technique, test image “Cameraman.tif” size (256 × 256 and 512 × 512). The Results are shown in a quality measures such as PSNR and MSE for decompressed “Cameraman.tif” image are calculated and compared.
Table 1 Showing CR values on various stage
Wavelet CR
Wiener filter Median filter
Haar 6.3114 8.4726
Db2 6.2680 8.4408
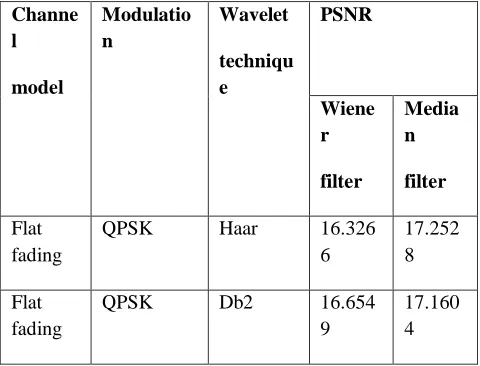
Table 2 showing PSNR values on various stages
A. FLAT of QPSK in Haar with median filter
Fig. 6 Original image, (b) Compressed image, (c) De-compressed image.
Fig.7 FLAT of QPSK in Haar with median filter
origional image
50 100 150 200 250 50
100
150
200
250
Compressed image
20 40 60 80 100120 20
40
60
80
100
120
DeCompressed image
50 100 150 200 250 50
100
150
200
250
Channe l
model
Modulatio n
Wavelet
techniqu e
PSNR
Wiene r
filter
Media n
filter
Flat fading
QPSK Haar 16.326 6
17.252 8
Flat fading
QPSK Db2 16.654 9
RESULT ANALYSIS
Simulation result showsBER &SER for FLAT of QPSK in Haar with median filter at SNR up to 10 dB. So, Best BER & SER is 3.0119 × 10⁻² & 6.0614 × 10⁻² respectively at SNR of 10 dB.
Fig.8 FLAT of QPSK in Haar with wiener filter
RESULT ANALYSIS
Simulation result showsBER &SER for FLAT of QPSK in Haar with wiener filter at SNR up to 10 dB. So, Best BER & SER is 3.1053 × 10⁻² & 6.5230 × 10⁻² respectively at SNR of 10 dB.
Fig.9 FLAT of QPSK in Db 2 with median filter
RESULT ANALYSIS
Simulation result showsBER &SER for FLAT of QPSK in Db2 with median filter at SNR up to 10 dB. So, Best BER & SER is 3.6774 × 10⁻² & 6.2401 × 10⁻² respectively at SNR of 10 dB.
Fig.10 Flat of QPSK in Db2 with wiener filter
CONCLUSION
We had also noticed that if using Db2 wavelet compression, increasing compression ratio for transmitting image compare to Haar wavelet compression. It is also seen that using Db2, higher PSNR compare to Haar wavelet compression, as well as using Db2, lower MSE compare to Haar. We have finally get minimum BER for Fading Channel of QPSK in Haar wavelet compression technique with denoising (Wiener filter) is
4.9821 × 10
−6..
We also find maximum compression ratio is 8.4408 by using Db2 compression technique with Median filter and PSNR is 17.2528 by using Fading Channel of QPSK in Haar wavelet compression technique with Median filter.REFERENCES
[1] [1] Rimas A. Zrae, Mohamed Hassan, and Mohamed El-Tarhuni “An Adaptive Modulation Scheme for Image Transmission over Wireless Channels”,
978-1-4244-9991-5/11/ 2011 IEEE.
[2] Ms. Vaibhavi P. Lineswala, Ms. Jigisha N. patel,
Wireless Channel”, 978-0-7695-3915-7/09 © 2009 IEEE DOI 10.1109/ACT.2009.163.
[3] Vincent Lecuire, Cristian Duran-Faundez, and Nicolas Krommenacker; “Energy-Efficient Transmission of Wavelet- Based Images in Wireless Sensor Networks” ,
Hindawi Publishing Corporation EURASIP Journal on Image and Video Processing Volume 2007, Article ID 47345, 11 pages doi:10.1155/2007/47345.
[4] Ms. Sonam Malik and Mr. VikramVerma,
“Comparative analysis of DCT, Haar and Daubechies
Wavelet for Image Compression”, International Journal
of Applied Engineering Research, ISSN 0973-4562 Vol.7 No.11 (2012) © Research India Publications. [5] Zachaeus K. Adeyemo, Ph.D. , Teslim I. Raji, Ph.D,
“Bit Error Rate Analysis For Wireless Links Using Adaptive Combining Diversity”, Journal of Theoretical
and Applied Information Technology,, © 2005 - 2010 JATIT& LLS.
[6] An Zhu, Dongning Guo, Michael L. Honig, “A
Message-Passing Approach for Joint Channel
Estimation, Interference Mitigation, and Decoding”,
IEEE TRANSACTIONS ON WIRELESS COMMUNICATIONS, VOL. 8, NO. 12, DECEMBER 2009, page 6008-6018.
[7] [24] Alan Barbieri, Amina Piemontese, and Giulio Colavolpe, “ARMA Approximation for Fading Channels Described by the Clarke Model with
Applications to Kalman-based Receivers”, IEEE
TRANSACTIONS ON WIRELESS
COMMUNICATIONS, VOL. 8, NO. 2, FEBRUARY 2009, page -535-540.
[8] [25] Ming Jiang, Siji Huang, and Wenkun Wen, “Adaptive Polar-Linear Interpolation Aided Channel
Estimation for Wireless Communication Systems”,
IEEE TRANSACTIONS ON WIRELESS COMMUNICATIONS, VOL. 11, NO. 3, MARCH 2012, Page 920-926.
[9] [26]Cheng Shan, Pooi Yuen Kam, and Arumugam Nallanathan, “A Symbol-by-Symbol Channel Estimation Receiver for Space-Time Block Coded Systems and its Performance Analysis on the
Nonselective Rayleigh Fading Channel”, IEEE
TRANSACTIONS ON COMMUNICATIONS, VOL. 56, NO. 12, DECEMBER 2008, 0090-6778/08$25.00
_c 2008 IEEE, Page 2116-2124.
[10][27] M Padmaja, Dr. P. Satyanarayana and K. Prasuna;
“Maximum and Minimum Power Adaptation Analysis
for Transmission of Different Image Formats Using Unilevel Haar Wavelet” , Signal & Image Processing :