ISSN (e): 2250-3021, ISSN (p): 2278-8719
Vol. 08, Issue 5 (May. 2018), ||V (IV) || PP 16-22
Applying Supervised Machine Learning Algorithms for Analytics
of Sensor Data
Sanskruti Patel
(Assistant Professor, Faculty of Computer Science and Applications, CHARUSAT, Changa, Gujarat, India) Corresponding Author:Sanskruti Patel
Abstract: -
The Internet of Things (IoT) is defined as a system with interconnected physical objects having ability to transfer data over a network without requiring human-to-human or human-to-computer interaction. It is estimated that IoT will consist 30 billion objects by 2020. In IoT, either billions of smart sensors and devices interacts with one another to collect or supply data without human intervention follows Machine-to-Machine (M2M) communication. Methodologies and approaches are needed to process these data intelligently in order to provide information and control of events and objects to humans in remote physical environments. Machine learning approaches are best suited where ample amount of data are available, but very less is known about the process. Machine learning approaches possesses a capability to vary the outcome according to knowledge, observation and situation, which are essential for IoT based applications. This paper addresses how different supervised machine learning algorithms are applied in order to analyze, process and extract meaningful information from massive amount of structured and unstructured data gathered from IoT devices. It also discussed the performance evaluation of these algorithms base on the experiment carried out on sensor data set.Keywords: -
Supervised Machine Learning, IoT data, Sensor data analytics--- --- Date of Submission: 27-05-2018 Date of acceptance: 10-06-2018 --- ---
I.
INTRODUCTION
The Internet of things (IoT) is defined as a network of physical devices including objects like vehicles, home appliances, software, sensors, actuators etc. and connectivity which enables these objects to connect and exchange data.[1][2][3] Each thing is uniquely identifiable through its embedded computing system but is able to inter-operate within the existing Internet infrastructure. IoT is one of the crucial developments in the field of ICT (Information and communication technologies) as it mainly aims to provide worldwide internet-based architecture, which mainly facilitates the exchange of services, information and data between millions or trillions of objects. This term introduced by Kevin Ashton in 1998 and since then it has obtained a lot of attention in the industry and academia [4]. It is estimated that by 2020, there will be 30 million objects consisted by IoT and the global market value of IoT will reach to $7.1 trillion. IoT is realized through the usage of sensors and actuators and it is part of cyber-physical systems. The objects residing in IoT sensed or controlled remotely across existing network infrastructure in order to make direct integration of the physical world into computer-based systems. By thus, it is aimed to reduce human intervention and to improve efficiency, accuracy and economic benefit. Many applications based on IoT being used in variety of sectors including smart health, smart agriculture, smart transportation, smart home, smart shopping, smart car etc.
The volume of data associated with and produced through IoT devices increases exponentially with the widespread usage of IoT enabled applications and devices. The extensive growth in the number of devices connected to the IoT generate and consume enormous data. These data sets are in form of structured, semi-structured or unsemi-structured. However, such large data sets are not useful without analytic power. To extract meaningful information from these massive and varying data sets, some data analytics process should be applied. IoT analytics refers to the analytical process apply on data to make IoT more efficient, reliable and fruitful.
application of Machine Learning approaches on IoT data can facilitate the traditional data analytical process. The aim of this research is to explore the possibilities of applying conventional machine learning algorithms for analytics of IoT data sets. These data sets are gathered from the values passed by sensors or IoT devices. The Experiment is carried out to apply well-known machine learning algorithms on IoT data sets. The analysis on performance of these algorithms on IoT data set is discussed in this paper. The set of machine learning algorithms used for experiment are Decision Tree, k-Nearest Neighbors, Support Vector Machines, Naive Bayes and multilayer perceptron neural network. The objective of this paper is to analyze the effectiveness and efficiency of above mentioned algorithms on data set that is generated through sensors.
II.
RELATED
WORK
Many researchers presented their research work which elaborated how machine learning algorithms are useful to analysis of IoT data. Mohammad Saeid Mahdavinejad et. al surveyed and presented the usage of different machine learning algorithms for IoT data analytics. They selected Smart City traffic data a use case and discussed the potential and challenges of machine learning for IoT data analytics [ 6].
The rapid growth of IoT devices generates massive amount of data. Application of automated machine learning techniques to smart building with over 100 connected sensors are discussed by Che-Min Chung et. Al [7]. One of the popular machine learning approach is deep learning used by Xie Xiaofeng et. Al [8] to construct a structure of a long-short term memory recurrent neural network. To build a prediction model, they used the normal time series training set. N. Saravanan et. al [9] provided an overview of challenges and importance for machine learning applications for IoT data analytics. Moreover, the need of machine learning algorithms for data classification and prediction were represented by M. Swarnamugi et. al [10]. Home appliances and traffic management were the applications selected by them for experimental purpose. G. Kejela et. al [11] collected real time data set of oil and gas company from the sensors used to monitor drilling processes and equipment. For predictive analysis of these data, they applied distributed machine learning techniques by integrating H2O. Ahn, Jaehyun et. al [12] proposed a model for an air quality prediction system. They have used sensor data and machine learning together and achieved a very good performance by carrying experiment with different parameter settings. Bill Karakostas[13] presented a model in which he used Bayesian model to forecast the events. These event generated thorough IoT devices. As Bayesian model is based on probability, the future events forecasted based on historical data. Hyo-Sik Ham et. al [14] used SVM for detection of Malware to make IoT services reliable.
III.
TAXONOMY
OF
MACHINE
LEARNING
ALGORITHMS
Machine learning algorithms possesses a capability of self learning and improvisation and they are broadly categorized into three categories: Supervised Learning, Unsupervised Learning and Reinforcement Learning [15][16][17]. The algorithms fall under supervised learning needs external assistance [18]. These algorithms apply on a set of input variables X and an output variable Y. A mapping between X and Y applies to predict the outputs for unseen data [19]. An algorithm is applied on the labelled data set with inputs and desired outputs. It mainly uses for classification and regression task where ample amount of historical data is available. Naïve Byes, Support Vector Machine, Decision Tree, Multilayer perceptron neural network are some the well-known algorithms categorized under supervised learning. The algorithms based on Unsupervised learning, infers from datasets consisting of input data without labelled responses. It is mainly used for clustering and association based problems. The data set assigned to an algorithm does not consist pre-defined labels like super vised learning. Cluster analysis using k-means clustering is a frequently used algorithm follows unsupervised learning method. Reinforcement learning is a type of learning where software agents must to take actions in a way that will maximize some notion of cumulative reward. These actions may affect situations and their actions in the future [18]. Further, the algorithms are also categorized into Linear and Nonlinear algorithms. Linear algorithms use linear model to predict the outcome, examples are linear regression and logistic regression. In linear algorithms are able to solved problems that are linearly separable. Non-linear algorithms do not make strong assumptions about the relationship between the input attributes and the output attribute being predicted.
The data set used in this paper for experiment is based on a problem that falls under supervised learning. As stated before, supervised learning offers two learning models: Classification and Regression. Classification generally maps the input space into predefined classes. However, Regression models map the input space into a real-valued domain [20]. Here, the data set is best suits for classification. Therefore, the experiment is carried out by considering a set of algorithms namely Decision Tree, k-Nearest Neighbors, Support Vector Machines, Naive Bayes and multilayer perceptron neural network.
Decision Tree
represents a decision. The rules based on data are represented through sequential structure of Decision trees and it iteratively partition the data [21]. Decision tree used in classification problem consists of Root Node, the top node of a tree comprising all the data, Splitting Node, A node that splits the data among alternatives and Terminal Node, A node where the outcome or final decision is available. Each of the internal node of a decision tree splits the instance space into two or more subspaces according to a certain discrete function of the input attributes values. If attributes contain numeric value, each leaf is assigned to one class representing the most appropriate target value. Instances are classified by navigating them from the root of the tree down to a leaf, according to the outcome of the tests along the path [22].
ID3, CART and C4.5 are the three widely used decision tree learning algorithms [23]. The ID3 (Quinlan, 1983) algorithm is a decision-tree building algorithm. It determines the classification of objects by testing the values of the properties. CART (Breiman et al., 1984) is another algorithm, stands for Classification and Regression Trees. To build a decision tree, it constructs binary trees. In Binary trees, each internal node has exactly two outgoing edges. ID3 is enhanced by C4.5 (Quinlan, 1993). The C4.5 algorithm generates a decision tree for the given data by recursively splitting that data and it uses Depth-first strategy. The C4.5 algorithm considers all the possible tests that can split the data and selects a test that gives the best information gain [23]. Variety of algorithms are available in Weka namely J48, LMT, Random Forest, random Tree to generate decision tree. For constructing decision trees, in Weka, the C4.5 algorithms is implemented as J48, a well-known classifier. Classifiers, like filters, are organized in a hierarchy: J48 has the full name weka.classifiers.trees.J48.
k-nearest Neighbors (KNN)
The k-nearest neighbor (KNN) algorithms classifies new, unseen data by looking at K given data points in the training set, which are closest in input or feature space. KNN uses a distance function to quantity either a difference or similarity between two instances [24]. It is classified as an instance based learning or lazy learning nonparametric method. The significance of using a distance measure function is to define which of the K instances in the training dataset are most similar to a new, unseen data. Euclidean distance is considered as a one of the most popular method. Between two instances x and y, the standard Euclidean distance d(x, y) between is often defined as follows [25].
The form of output of KNN is depends on whether it is used for classification or regression. The output is termed as a class membership, if it is a KNN classification. Here, an object is classified by a majority vote of its neighbors, with the object being assigned to the class most common among its k-nearest neighbors. However, the output is considered as the property value for the object, if it is used for regression task. This property value is the average of the values of its k-nearest neighbors. In Weka, the implementation of KNN is available as IBk (Instance based elarner) under lazy selection. The IBk algorithm available in Weka generates a prediction for a test instance without building a model. It uses a distance measure method(s) to locate k “close” instances in the training data for each test instance and uses those selected instances to make a prediction [20].
Support Vector Machines (SVM)
Support vector machine (SVM) forms hyperplanes and basically used for classification and regression analysis and has been used for many applications. It is a supervised learning model and a binary classifier that creates predictions based on formerly perceived data. In SVM, all the data points are either belonging to one class or another class and the objective is to decide which class is suitable for the new data point. All the data points reside in one side of hyperplane are labeled as P and others are P – 1. The data points that are helps to determine the hyperplane and thus closest to the hyperplane are called support vectors [26]. Some of the well-known applications of SVM are text processing, image segmentation, image classification etc.In Weka, SVM is available as SMO under functions in classifier option. Weka implements John Platt's sequential minimal optimization algorithm for training a support vector classifier [27]. It is advisable to use cross fold validation while working with SMO in Weka.
Multilayer Perceptron Neural Network
layer without having loop or cycles, and therefore it is called feed forward neural network. Multilayer perceptron (MLP) contains one or more hidden layers and it is categorized as a feed forward neural network. The Neural network must be trained before its real time usage and it is realized with an implementation of Feed Forward Back Propagation Neural Network. MLP utilizes a supervised learning technique called backpropagation, based on gradient descent, for training. Except Input layer, each neuron is used activation function that is non-linear. Unlike single layer perceptron, multilayer perceptron also able to learn non-linear functions. As stated earlier, backpropagation algorithm is used to train the neural network. Training to the neural network includes adjusting the parameters, weights and biases in such a way that error is minimized [34]. Multilayer Perceptron Neural Network is available in Weka under the functions tab, as a MultilayerPerceptron. It is comparatively slow but having good performance on real time problems. Weka offers a graphical interface to set the value of different parameters including learning rate, momentum, no. of hidden layers and many more. Also, it avails the option to create user defined network structure with perceptrons and connections [30].
Naïve Byes
Naive Bayes is a classification algorithm based on probabilistic and it applies Bayes' theorem for that. It is used to solve the classifications problems that are categorized as binary and multi-class problems. The most popular usage of Naïve Byes is for classification of email and text. It calculates probability for every factor and eventually selects the outcome with highest probability. It is comparatively fast and highly scalable algorithm among other machine leaning algorithms and can be easily trained with smaller data set. The naïve Byes calculates the probability for each category from given simple to produce the outcome the category with heights one. The Bays’ theorem executes on given formula
Naïve Byes is available in Weka under Byes folder, as NaiveBays. It is simple Bayesian and standard classifier that works on probability. The Laplace estimator is automatically applied and probability distribution of each instance in the data set is narrated in classification result.
IV.
EXPERIMENTS
&
RESULTS
The experiment is carried out using Weka 3 Toolkit. It consists of a collection of machine learning algorithms for data mining tasks. It is an open source software in Java, freely available under General Public License (GNU) agreement and offers a very good user interface for the different tasks like pre-processing, classification, clustering etc.
Experimental Methodology
In the experiment, five well-known machine-learning algorithms are considered for evaluation of their performance namely Decision Tree, k-Nearest Neighbors, Support Vector Machines, Naive Bayes and multilayer perceptron neural network. Human Activity Recognition Using Smartphones Dataset used in experiment and it is obtained from UC Irvine Machine Learning Repository (UCI) [31]. For data collection, sensor signals from embedded accelerometer and gyroscope are used. In the obtained sensor data set, 70% is used for training and remaining 30% is used for testing. Human activity is classified six activities: Walking, Walking Upstairs, Walking Downstairs, Sitting, Standing and Laying [31]. To carry out the experiment in Weka 3, Data pre-processing step should be executed first from the Explorer option. Weka offers the options to load .arff and .csv format data set files. Once the data set file is loaded properly, Weka identifies the attributes and computes some basic statistics on each attribute. The frequency for each attribute value is depicted, if attributes are categorical. Otherwise, for continuous attributes, min, max, mean, standard deviation, etc are shown [32].
After pre-processing, classification process may start. Classification is the process of finding a set of models that describe and distinguish data classes and concepts [33]. For classification, the model should be first trained with the training data set and then after the performance is evaluated by testing the model using test data set. In the experiment carried out, each of five machine learning algorithm is applied on train data set and then after on test data set.
Results and Discussion
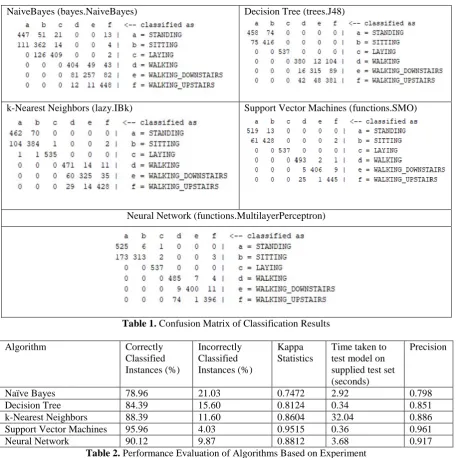
Multilayer Perceptron Neural Network are very close to each other while considering the accuracy in classification results. SVM obtained to 95.96% accuracy while Neural Network achieved 90.12% accuracy. The obtained kappa statistics of SVM is 0.9515 which is considerably good. Moreover, time taken to test model on supplied test set is 0.36 seconds, which also makes the usage of SVM worthy. The results are also represented that; the accuracy of multilayer perceptron Neural Network is also considerably high as kappa statistics of multilayer perceptron is 0.8812. The time taken is slightly more compare to other algorithms. Improvisation in accuracy may achieve by increasing more hidden layers and neurons.
NaiveBayes (bayes.NaiveBayes) Decision Tree (trees.J48)
k-Nearest Neighbors (lazy.IBk) Support Vector Machines (functions.SMO)
Neural Network (functions.MultilayerPerceptron)
Table 1. Confusion Matrix of Classification Results
Algorithm Correctly
Classified Instances (%)
Incorrectly Classified Instances (%)
Kappa Statistics
Time taken to test model on supplied test set (seconds)
Precision
Naïve Bayes 78.96 21.03 0.7472 2.92 0.798
Decision Tree 84.39 15.60 0.8124 0.34 0.851
k-Nearest Neighbors 88.39 11.60 0.8604 32.04 0.886
Support Vector Machines 95.96 4.03 0.9515 0.36 0.961
Neural Network 90.12 9.87 0.8812 3.68 0.917
Figure 1. Kappa Statistics and Precision Values
V.
CONCLUSION
IoT devices generates enormous volume of heterogeneous data through variety of sensors. It is desirable to apply adequate data analytics process to extract meaningful information from these data sets. Such analytical process applies on data to make IoT more efficient, reliable and fruitful. This paper demonstrated the applicability of well-known machine learning algorithms through the analysis of experiment carried out on sensor obtained data set. The analysis showed that Support Vector Machine (SVM) and Multilayer Perceptron Neural Network gave reasonably higher precision compare to other algorithms. In future, the experiment will also carry out on huge and vague sensor data sets.
REFERENCES
[1]. Brown, Eric (13 September 2016), "Who Needs the Internet of Things?", Linux.com, Retrieved 23 October 2016.
[2]. Brown, Eric (20 September 2016), "21 Open Source Projects for IoT", Linux.com, Retrieved 23 October 2016
[3]. Internet of Things Global Standards Initiative. ITU, Retrieved 26 June 2015.
[4]. J. Antonio et al., “Drugs interaction checker based on IoT,” Internet of Things (IOT), IEEE, Pages. 1-8, 2010.
[5]. Clifton DA, Gibbons J, Davies J, Tarassenko L., “Machine learning and software engineering in health informatics”, Proceedings of 1st International Workshop on Realizing Artificial Intelligence Synergies in Software Engineering (RAISE); Zurich, Switzerland, Pages. 37-41, 2012
[6]. Mohammad Saeid Mahdavinejad, Mohammadreza Rezvan, Mohammadamin Barekatain, Peyman Adibi, Payam Barnaghi, Amit P. Sheth, “Machine learning for Internet of Things data analysis: A survey”, Digital Communications and Networks, 2017
[7]. Che-Min Chung , Cai-Cing Chen , Wei-Ping Shih , Ting-En Lin , Rui-Jun Yeh , Iru Wang, “Automated machine learning for Internet of Things”, 2017 IEEE International Conference on Consumer Electronics - Taiwan (ICCE-TW)
[8]. Xie, Xiaofeng & Wu, Di & Liu, Siping & Li, Renfa, “IoT Data Analytics Using Deep Learning”
[9]. N. Saravanan, Dr. N. Preethi, “Survey on Analytics, Machine Learning and the Internet of Things”, Int.J.Computer Technology & Applications,Vol 6 (6),Pages. 1042-1046, Nov-Dec 2015
[10]. M. Swarnamugi , Dr.R.Chinnaiyan, Dr.V.Ilango, “IoT Technologies And Machine Learning Algorithms – A Study”, 5(10), Pages. 614-624, October 2016
[11]. G. Kejela, R. M. Esteves and C. Rong, "Predictive Analytics of Sensor Data Using Distributed Machine Learning Techniques", 2014 IEEE 6th International Conference on Cloud Computing Technology and Science, Singapore, Pages. 626-631, 2014
[12]. Ahn, Jaehyun & Shin, Dongil & Kim, Kyuho & Yang, Jihoon, Indoor Air Quality Analysis Using Deep Learning with Sensor Data. Sensors, 2017
[13]. Bill Karakostas, “Event prediction in an IoT environment using naïve Bayesian models”, The 7th International Conference on Ambient Systems, Networks and Technologies (ANT 2016), Procedia Computer Science 83, Pages. 11 – 17, 2016
[15]. D. Barber, “Bayesian reasoning and machine learning”, Cambridge University Press, 2012 [16]. C. M. Bishop, "Pattern Recognition and Machine Learning", Springer 2006
[17]. K. P. Murphy, “Machine learning: a probabilistic perspective”, MIT press, 2012.
[18]. Ayon Dey, “Machine Learning Algorithms: A Review”, International Journal of Computer Science and Information Technologies (IJCSIT), Vol. 7 (3), Pages. 1174-1179, 2016
[19]. Cunningham P., Cord M., Delany S.J., “Supervised Learning”, In: Cord M., Cunningham P. (eds) Machine Learning Techniques for Multimedia. Cognitive Technologies. Springer, Berlin, Heidelberg, 2008
[20]. https://machinelearningmastery.com/, retrieved April 2018
[21]. Murthy, S.K., “Data Mining and Knowledge Discovery”, 2: 345. https://doi.org/10.1023/A:1009744630224, (1998)
[22]. L. Rokach, O. Maimon, "Top-Down induction of decision trees classifiers-A survey", IEEE TSMC, Volume 35, Issue 4, Pages. 476-487, 2005.
[23]. Sonia Singh, Priyanka Gupta, “Comparative Study Id3, Cart and C4.5 Decision Tree Algorithm: A Survey”, International Journal of Advanced Information Science and Technology (IJAIST) ISSN: 2319:2682 Vol.27, No.27, July 2014, Pages. 97-103, 1998
[24]. J. Liangxiao, C. Zhihua, W. Dianhong nad J. Siwei, "Survey of Improving K-Nearest Neighbor for Classification", Int. Conf. on Fuzzy Systems and Knowledge Discovery, Pages. 679-683, 2007
[25]. D. Aha., “Lazy learning”, Kluwer Academic Publishers, 1997
[26]. Simon Tong, Daphne Koller, “Support Vector Machine Active Learning with Applications to Text Classification”, Journal of Machine Learning Research, Pages. 45-66, 2001
[27]. http://weka.sourceforge.net/doc.stable/weka/classifiers/functions/SMO.html, retrieved April 2018 [28]. Dharwal R, Kaur L, “Applications of Artificial Neural Networks: A review”, Indian Journal of Science
and Technology, 9(47, Pages. 1-8, Dec 2016
[29]. Zupan J., “Introduction to Artificial Neural Network (ANN) methods: What they are and how to use”, Acta Chimica Slovenica, Pages. 327-52, 1994
[30]. https://www.cs.waikato.ac.nz/ml/weka/mooc/moredataminingwithweka/slides/Class5-MoreDataMiningWithWeka-2014.pdf, retrieved February 2018
[31]. Davide Anguita, Alessandro Ghio, Luca Oneto, Xavier Parra and Jorge L. Reyes-Ortiz, “A Public Domain Dataset for Human Activity Recognition Using Smartphones”, 21th European Symposium on Artificial Neural Networks, Computational Intelligence and Machine Learning, ESANN 2013. Bruges, Belgium, 24-26 April 2013.
[32]. http://facweb.cs.depaul.edu/mobasher/classes/ect584/WEKA/preprocess.html, retrieved March 2018 [33]. Swasti Singhal, Monika Jena, “A Study on WEKA Tool for Data Preprocessing, Classification and
Clustering”, International Journal of Innovative Technology and Exploring Engineering (IJITEE) ISSN: 2278-3075, Volume-2, Issue-6, Pages. 250-253, May 2013
[34]. Artificial Neural Network Based Numerical Solution of Ordinary Differential Equations, retrieved from http://ethesis.nitrkl.ac.in/3553/1/Thesis-Artificial_Neural_Network_training_for_solving_ODE-101.pdf, retrieved May 15, 2018.