© Penerbit UTHM
DOI: https://doi.org/10.30880/ijie.2018.10.09.018
*Corresponding author: [email protected], [email protected]
2018 UTHM Publisher. All right reserved.
96
A Finite Element (FE) simulation of naked solid steel beam at
elevated temperature
Fariz Aswan Ahmad Zakwan
1*, Renga Rao Krishnamoorthy
2*, Azmi Ibrahim
2,
Ruqayyah Ismail
11
Faculty of Civil Engineering, Universiti Teknologi MARA (Pulau Pinang), 13500 Permatang Pauh, Pulau Pinang, Malaysia
2Faculty of Engineering, Universiti Teknologi MARA, 40450 Shah Alam, Selangor, Malaysia
Received 19 March 2018; accepted 17 December 2018, available online 31 December 2018
1. Introduction
There have been rigorous researches related with performance-based approach structural member, especially steel beam. Traditional approach uses prescriptive based approach to obtain the fire resistance performance. The aims of this research are to predict numerically the temperature evolution of naked solid steel beam at elevated temperature and hence to validate the experimental investigation of the naked solid steel beam when expose to fire exposure. From the outcome of this research, structural behavior of the naked steel beam at elevated temperature will be analyzed and used for future research involving performance-based approach of cellular steel beam (CSB) at elevated temperature.
An analysis tool of general purpose of ABAQUS finite element program software was used in this study. This advanced software can predict the temperature evolution and hence structural behavior can be determined through finite element method. Finite element method is a numerical method to solve an integral or differential equation. This method predicts the piecewise continuous function for the solution and obtaining the parameters of the function to minimize the error in the solution.
2. Prescriptive based approach
Prescriptive and performance-based approach are the main approach that can be used for structural steel design. This approach is explicitly outline in the fire design codes
Abstract: This paper presents the numerical analysis of temperature distribution of a simply supported naked solid
steel beam (SSNSSB) under fire exposure. Prescriptive based approach particularly is the safest and easiest approach to determine the level of strength of structural member when expose to elevated temperature. However, this method assuming uniform fire exposure through the overall cross section of the structural member which may leads to over design. The outcome of the design may not reflect the real fire scenario. Performance-based approach is a realistic approach which can predict the structural steel behavior. In this method, three main components were considered, namely fire exposure behavior, heat transfer analysis and mechanical reaction. Fire exposure behavior dealing with types or severity fire load exposed to structural member. There are few options available to determine the fire extent, namely nominal fire models, compartment fires, localized fires, zone models and computational fluid dynamics (CFD) models. Meanwhile, heat transfer analysis estimates the energy dissipation (initiate from fire) between structural elements due to temperature variation. Structural response incorporates finite element modeling that predicts the structural element behavior, namely stresses and deformation. This method considers the prime factors such as shadow effect, support condition, loading condition, boundary conditions and interaction properties between different structural elements which can optimize the structural behavior analysis. However, there are still lack of research that consider those factors that might jeopardize the behavior of steel beam. Owing to this, a performance-based approach method was introduced in this research. Experimental investigation was retrieved from the readily available data of Compendium of UK Standard Fire Test Data. One sample of SSNSSB was selected from the wide range of naked solid beam available from the Compendium. Standard fire curve of ISO 834 was used during numerical simulation to correlate with the experimental investigation. From the results of the finite element simulation, the predicted member temperature agrees well with the experimental investigations. Hence, future works of cellular steel beam (CSB) with various web opening shapes can be initiate due to its limited researches related to CSB at elevated temperatures.
Keywords: Elevated temperature, heat transfer, ABAQUS finite element, performance-based approach, thermal
97
of EC1, EC3 and EC4 [1]–[2]. This traditionally based approach uses standard fire curve in designing the fire resistance of steel member. Several nominal fire curves such as hydrocarbon fire, standard fire curve, large pool hydrocarbon, external fire and smouldering curve are available in the codes [1]–[7]. This approach involves structural fire design which leads to determine the required thickness of fire protection material. The required thickness of the fire protection material is explicitly well mention in the code in obtaining fire resistance rating for structural steel member. However, this approach does not consider several important factors that might disturb the structural behavior of structural steel beam at elevated temperature. Owing to this circumstance, performance based approach is more accurate and reliable approach for analyzing temperature distribution and mechanical response along the steel section [8]–[11]. For the latter approach, it involves structural fire resistance computation which is correlate with the experimental investigation. Material properties gained from structural steel materials experiment will be used in the numerical modelling to predict the structural behavior of the structural steel element when expose to elevated temperature. Structural steel prediction behavior when exposed to fire were analyzed through Finite element method (FEM) [12]. In FEM procedure, fire resistance performance will be depending on estimation of fire behavior, heat transfer and structural response [13]. Several benefits can be made when adopting performance-based approach of:
a) Cost saving measures without compromising the levels of fire safety,
b) Construction of state-of-the-art of new buildings, c) Compassionate the reality of the structural behavior of members due to exposure of realistic fire,
d) Making the building more strong and stiffer when adopting performance-based approach, and
e) To increase the level of building safety by integrating advanced structural fire design approach.
3.
Experimental investigations
The United Kingdom (UK) Building regulations were set up to restrict the spread of fire, to reduce the number of injuries, and to cut down the number of loss of life and also to prevent a structure from collapse. During 1990s, Tata Steel (previously known as British Steel Corporation) has initiate numerous standard fire tests to explore the performance of structural steelwork with no additional fire protection layer. The so called ‘compendium’ was able to be compiled by Tata Steel, which consists of all standard fire tests undertaken in the UK, ranging from completely protected hot rolled universal section to partially protected hot rolled universal sections [1]–[2]. The test specimens were burnt in a gas fired furnace, where the temperature were controlled with respect to time (Fig. 1), conformance with the available codes [3]–[10] endorsement as stated below:
(1)
where, t = time of test (minutes); T = furnace temperature, , at time t; and T0 = initial furnace temperature, .
0 100 200 300 400 500 600 700 800 900 1000
0 500 1000 1500 2000 2500
T
e
m
p
e
ra
ta
tu
re
(
C)
Time (seconds)
Fire Furnace Temperature Standard fire curve (ISO 834)
Fig. 1 - Types of fire exposure used during experimental and numerical test program [1], [4]–[11]
All the fire tests selected in this research were conducted at Warrington Research Centre, UK [1]. For this purpose of research, a simply supported naked steel beam of Test 1A (SSNSSB-1A) was selected from a various number of member element, consists of floor beams, columns and walls. The naked steel beam section size is 254 x 146 x 43 UB. The steel quality selected is Grades 43A. The effective span of the steel beam is 4.5 m. Concrete slab acted as a cover and were attached on top of the top flange steel beam. The concrete slab size is 130 mm in thick-ness and 650 mm wide. The concrete slab was loaded with vertical load of 44.15 kN and were located (1.5 m from both supports) at two locations as shown in Fig. 2. The maximum permissible bending stresses at mid-span of the steel beam are 165 and 230 N/mm2 for steel grade 43A. The detailed dimension properties of SSNSSB-1A were outlined in Table 1.
Table 1 – Dimension properties of SSNSSB-1A
Section beam size
Depth of section
Width of section
Web thickness
Flange thickness
254x146x43 UB
259.6 mm
147.3 mm 7.3 mm 12.7 mm
Elastic modulus
(XX axis)
Elastic modulus (YY axis)
Plastic modulus (XX axis)
Plastic modulus (YY axis)
505.3 cm3
92 cm3 568.2 cm3 141.2 cm3
Moment of inertia (XX axis)
Moment of inertia (YY axis)
6558 cm4 677 cm4
98
depth of the top flange section of the steel beam. Theinitial ambient temperature recorded is 21 °C.
Fig. 2 - Longitudinal view of the of the SSNSSB-1A test assembly [1]
Fig. 3 - Thermocouples location of the SSNSSB-1A (longitudinal section) [1]
Fig. 4 - Thermocouples location of the SSNSSB-1A [1]
4.
Numerical simulation model
For this purpose, general purpose of ABAQUS finite element program were used to validate the experimental investigation. In this simulation, three-dimensional conventional shell element (S4R) with reduced integration properties were selected rather than solid element. Shell element provides rigorous and precise solution for all loading conditions for thin and thick shell element. Shell element is much easier to mesh rather solid
element. In addition, shell modeling creates less problems in terms of stability due to its less space disk required for linear and nonlinear analysis. A shell can be extract from a slim plate by originally turn out the middle plane to a singly (or doubly) curved surface [11]. This numerical simulation taking into consideration the interface between the steel beam section and concrete slab. Contact properties of tie constraint were used between upper flange steel layer and bottom slab concrete layer to predict temperature distribution response due to fire exposure. The concrete slab acts only as a cover on top of the steel beam. The thermal response was initiate through transient uncoupled heat transfer analysis. For this numerical analysis, a nonlinear stress-strain curve relationship model was adopted to simulate the linear plasticity of steel beam corresponding to the results of the documented one-dimensional tensile test or can be retrieved from BS EN 1993-1-1 and BS EN 1994-1-1 [12], [13].
In this analysis, three-dimensional heat transfer analysis (DS4, 4-node heat transfer quadrilateral shell) were used to predict thermal output of the steel beam. A standard fire curve from EC3 and EC4 (Fig. 1) were used to replicate the fire load imposed experimentally on the steel beam [3]–[10]. The duration of fire exposure is 35.5 minutes (2130 seconds). In this analysis, convection coefficient of 25 W/m2K and 9 W/m2K were used for exposed surface and unexposed surface respectively. Thermal load was applied through the bottom surface of bottom flange up to bottom top flange and bottom concrete slab. Thermal steel properties of specific heat (Fig. 5) and thermal conductivity (Fig. 6) were applied during numerical simulation as mentioned in EC3 and EC4 [3]–[10]. In addition, the density of the steel beam and a non-structural concrete slab were taken as 7850 and 2240 kg/m3 respectively as stated in [1]. However, the non-structural concrete slab does not be considered in the numerical simulation due it only acting as a cover to SSNSSB-1A.
0 500 1000 1500 2000 2500 3000
0 200 400 600 800 1000 1200
Sp
ec
if
ic
h
ea
t,
cα
(J
/k
g
K
)
Steel temperature, θα(C°)
Fig. 5 - Specific heat of steel [4]–[11] 147.3 mm
70 mm 70 mm
7.3 mm 650 mm 0.31 m 0.62 m 0.93 m
0.31 m 0.62 m
0.93 m 4.5 m
W4 W3 W2 W1
F4 F2 F1
F5 F
3
F i r e
Support Support
Concrete slab
Beam mid-height
Fire 4500 mm span
Fire
1500 mm 44.15 kN
load 1500 mm
44.15 kN load
Steel beam: 254 x 146 x 43 UB
Concrete
topping slab:
630 mm x 130
mm thick 4000 mm furnace
width
F3,F5
W1,W2,W3W4
F1,F2,F4 Concrete
slab 130 mm
12.7 mm
99
0.0 10.0 20.0 30.0 40.0 50.0 60.0
0.0 200.0 400.0 600.0 800.0 1000.0 1200.0 1400.0
Th
er
m
a
l
co
n
d
u
ct
iv
it
y,
λα
(W
/m
K
)
Steel temperature, θα(C°)
Fig. 6 - Thermal conductivity of steel [3]–[10]
5.
Results and Discussion
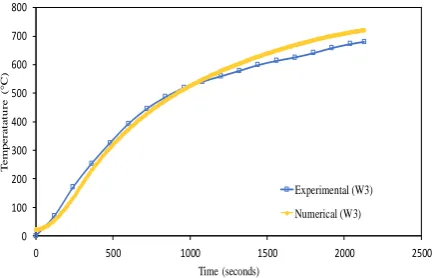
From the results of heat transfer analysis, temperature against time curve were obtained for all the thermocouples location along the steel beam. Fig. 7 to Fig. 15 shows correlation between the numerical simulation results and experimental results. Form the numerical simulation output, the predicted temperature measurement for web beam section are almost similar for all thermocouples F3 and F5 in upper flange beam section as shown in Fig. 7 and Fig. 8. The same applies with web beam section of thermocouples W1, W2, W3 and W4 as in Fig. 9 to Fig. 12. Thermocouples F1, F2 and F4 also exhibit the same trend for bottom flange beam section.
It can be clearly seen that the upper flange section exhibits the lowest temperature for both measured and predicted temperature in comparison to web section and bottom flange section. Bottom flange section shows the second highest temperature profile while web section exhibits the highest temperature gained respectively. The upper flange section located in the upper most part of the beam section where it takes longer time for the heat source to dissipate through until to the upper flange section. Due to this reason, upper flange section exhibits the least temperature profile among other section. In addition, geometrical effect also has a significant effect onto the temperature movement along the steel beam section. Thicker section contribute longer time for the heat to travel between adjacent beam section. The thickness of the upper and bottom flange section is 12.7 mm, which are 5.4 mm more than the thickness of the web section. However, there are no significant differences of temperature between the bottom flange section and web section.
Fig. 7 and Fig. 8 shows that the measured and predicted maximum temperature in the upper flange section of thermocouples F3 and F5 at the end of 2130 seconds of fire exposure. The measured maximum temperatures are 561°C and 509°C respectively. The predicted maximum temperature for both points is 572°C. The measured temperature in the web section are illustrates as in Fig. 9, Fig. 10, Fig. 11 and Fig. 12. Thermocouples W1, W2, W3 and W4 recorded maximum temperature of 696°C, 672°C, 681°C and 715°C respectively. The predicted temperature is similar for all points of 720°C. Fig. 13, Fig. 14 and Fig. 15 shows the measured temperature in the bottom flange section.
Thermocouples F1, F2 and F4 recorded temperature of 673°C, 666°C and 707°C respectively. The predicted temperature is similar for all points of 703°C. Fig. 16 and Fig. 17 illustrate the predicted temperature of naked steel beam at 1080 seconds and 2130 seconds of fire exposure respectively. It can be clearly seen from both figures (Fig. 16 and Fig. 17) that the upper flange section of SSNSSB-1A exhibit cooler temperature distribution along the beam section (denoted by blue colour as shown in Fig. 17) at the end of fire exposure. This types of behaviour were anticipated due to its connection to concrete slab which attached on top of the upper flange section. The temperature distribution was distributed between the upper flange section and concrete slab even though the latter were not considered in the numerical analysis. However, a full interaction between the former and latter were considered in the numerical simulation which contribute this behaviour. It was followed by upper web section along the beam stretched where the temperature distribution was increased as compared to upper flange section (denoted by green colour as shown in Fig. 17). This behaviour occurred due to its location underneath the upper flange section where it received the high thermal exposure than the upper flange section. Meanwhile, the bottom flange section predicted the highest temperature distribution among all the beam section due to its location where it received the fire exposure at first hand during the numerical simulation (denoted by red colour as shown in Fig. 17).
0 100 200 300 400 500 600 700
0 500 1000 1500 2000 2500
T
em
p
era
ta
tu
re
(
C)
Time (seconds)
Experimental (F3) Numerical (F3)
Fig. 7 - Steel temperature of experimental SSNSSB-1A against the numerical outcome for thermocouples F3
(upper flange section)
0 100 200 300 400 500 600 700
0 500 1000 1500 2000 2500
T
e
m
pe
ra
ta
tu
re
(
C)
Time (seconds)
Experimental (F5)
Numerical (F5)
Fig. 8 - Steel temperature of experimental SSNSSB-1A against the numerical outcome for thermocouples F5
100
0 100 200 300 400 500 600 700 800
0 500 1000 1500 2000 2500
T
e
m
p
e
ra
ta
tu
re
(
C)
Time (seconds)
Experimental (W1) Numerical (W1)
Fig. 9 - Steel temperature of experimental SSNSSB-1A against the numerical outcome for thermocouples W1
(web section)
0 100 200 300 400 500 600 700 800
0 500 1000 1500 2000 2500
T
e
m
p
e
ra
ta
tu
re
(
C)
Time (seconds)
Experimental (W2) Numerical (W2)
Fig. 10 - Steel temperature of experimental SSNSSB-1A against the numerical outcome for thermocouples
W2 (web section)
0 100 200 300 400 500 600 700 800
0 500 1000 1500 2000 2500
T
e
m
p
e
ra
ta
tu
re
(
C)
Time (seconds)
Experimental (W3)
Numerical (W3)
Fig. 11 - Steel temperature of experimental SSNSSB-1A against the numerical outcome for thermocouples
W3 (web section)
0 100 200 300 400 500 600 700 800
0 500 1000 1500 2000 2500
T
e
m
p
e
ra
ta
tu
re
(
C)
Time (seconds)
Experimental (W4) Numerical (W4)
Fig. 12 - Steel temperature of experimental SSNSSB-1A against the numerical outcome for thermocouples
W4 (web section)
0 100 200 300 400 500 600 700 800
0 500 1000 1500 2000 2500
T
e
m
p
e
ra
ta
tu
re
(
C)
Time (seconds)
Experimental (F1)
Numerical (F1)
Fig. 13 - Steel temperature of experimental SSNSSB-1A against the numerical outcome for thermocouples
F1 (bottom flange section)
0 100 200 300 400 500 600 700 800
0 500 1000 1500 2000 2500
T
e
m
p
e
ra
ta
tu
re
(
C)
Time (seconds)
Experimental (F2) Numerical (F2)
Fig. 14 - Steel temperature of experimental SSNSSB-1A against the numerical outcome for thermocouples
101
0 100 200 300 400 500 600 700 800
0 500 1000 1500 2000 2500
T
e
m
p
e
ra
ta
tu
re
(
C)
Time (seconds)
Experimental (F4)
Numerical (F4)
Fig. 15 - Steel temperature of experimental SSNSSB-1A against the numerical outcome for thermocouples
F4 (bottom flange section)
Fig. 16 - Predicted critical steel temperature for SSNSSB-1A at 1080 seconds (18 minutes) of fire
exposure
Fig. 17 - Predicted critical steel temperature for SSNSSB-1A at 2130 seconds (35.5 minutes) of fire
exposure
Table 2 shows the temperature differences between the numerical simulation and experimental investigations in terms of maximum temperature at the end of 2130 seconds of fire exposure. It can be clearly seen that only a slightly temperature differences were obtained between both results. Numerical maximum temperature output was slightly overestimate than the experimental maximum temperature output. However, only thermocouples location of F4 exhibit a negative sign (underestimate) of 4°C between both analyses.
Table 2 – Maximum measured and predicted temperature distribution of SSNSSB-1A at the end
2130 seconds fire exposure
Thermocouples location
Maximum temperature (experiment)
Maximum temperature (numerical)
Temperature differences
F3 561°C 573°C 12°C
F5 509°C 573°C 64°C
W1 696°C 721°C 25°C
W2 672°C 721°C 49°C
W3 681°C 721°C 40°C
W4 715°C 721°C 6°C
F1 673°C 703°C 30°C
F2 666°C 703°C 37°C
F4 707°C 703°C -4°C
6.
Conclusion
From this study, general purpose of ABAQUS finite element program can correlate the thermal analysis behavior of the naked steel beam at elevated temperature with the experimental investigation conducted as in the compendium. From the heat transfer analysis, the predicted temperature obtained from Fig. 7 to Fig. 15 agrees well with the experimental investigation. However, numerical prediction was slightly over estimate for both thermocouples F3 and F5, ranging from 12°C to 64°C respectively, which is within acceptable range. The same trend was achieved for thermocouples W1, W2, W3 and W4 it recorded only small temperature increase of 25°C, 49°C, 40°C and 6°C respectively. The numerical maximum temperature was slightly up for 30°C and 37°C for thermocouple F1 and F2 while thermocouples F4 exhibit a decreased value of 4°C. The experimental results referred were conducted by Tata Steel back in the 1990s where there were limitations in conducting the experiment. Therefore, it can be observed that some of the results from the numerical data that does not consistent with the experimental data. Thus, it can be concluded that the numerical data pattern is found to be more reliable and accurate in comparison to the experimental results.
Temperature distribution are not uniform and different from one beam section to another beam section for both experimental and numerical results. The variation thickness of the steel beam section plays a major role during heat transfer simulation. Top flange beam section is the last section to receive the heat source from fire exposure which leads to less temperature recorded for both numerical and experimental results.
References
[1] D. E. Wainman and B. R. Kirby, “Compendium of UK Standard Fire Test Data (Unprotected Structural Steel - 1),” 1988.
[2] D. E. Wainman and B. R. Kirby, “Compendium of UK Standard Fire Test Data (Unprotected Structural Steel - 2).” 1989.
102
[4] BSI, “BS EN 1991-1-2:2002 Actions onstructures — Part 1-2: General actions — Actions on structures exposed to fire,” 2002.
[5] BSI, “BS EN 1993-1-2:2005 Design of steel structures — Part 1-2: General rules — Structural fire design,” 2005.
[6] BSI, “BS EN 1994-1-2:2005 Design of composite steel and concrete structures —Part 1-2: General rules — Structural fire design,” 2005.
[7] Aminudin, E., Md Din, M.F., Hussin, M.W., Abdullah, A.H., Iwao, K., Ichikawa, Y. Properties of agro-industrial aerated concrete as potential thermal insulation for building. MATEC Web of Conferences, 47, (2016), art. no. 04020.
[8] BSI, PD 7974-1: 2003. Application of fire safety engineering principles to the design of buildings. 2003.
[9] BSI, “BS 476-20: Fire tests on building materials and structures —,” 1987.
[10] ISO, “ISO 834 Fire - Resistance Tests - Elements of Building Construction - Part 1,” 1999.
[11] O. C. Zienkiewicz, The Finite Element Method. McGraw-Hill Book Company (UK) Limited, 1977.
[12] BSI, “BS EN 1993-1-1:2005 Design of steel structures - Part 1-1: General rules and rules for buildings,” 2005.
![Fig. 1 - Types of fire exposure used during experimental and numerical test program [1], [4]–[11]](https://thumb-us.123doks.com/thumbv2/123dok_us/8436994.1699859/2.595.306.538.488.641/fig-types-exposure-used-experimental-numerical-test-program.webp)
![Fig. 5 - Specific heat of steel [4]–[11]](https://thumb-us.123doks.com/thumbv2/123dok_us/8436994.1699859/3.595.57.291.102.454/fig-specific-heat-steel.webp)
![Fig. 6 - Thermal conductivity of steel [3]–[10]](https://thumb-us.123doks.com/thumbv2/123dok_us/8436994.1699859/4.595.69.280.77.197/fig-thermal-conductivity-steel.webp)