36
M. Rezaei et al. Journal of Medicinal and Chemical Sciences Original Article
J. Med. Chem. Sci. 2018, 1, 36-40 http://jmchemsci.com
Journal of Medicinal and Chemical Sciences 2018 (1) 36-40
J. Med. Chem. Sci.
RP-HPLC Method Development and Validation for the Quantitative Estimation of
Mirabegron in Extended-Release Tablets
Mehdi Rezaei, Ali Ramazani
*
Department of Chemistry, University of Zanjan, P.O. Box: 45195-313, Zanjan, Iran.
1.Introduction
he chemical name for Mirabegron (Fig. 1) is 2-(2-amino-1, 3 thiazol-4-yl)-N-[4-[2-[[(2R)-2-hydroxy-2-phenylethyl]amin-o]ethyl]phenyl]acetamide having a molecular formula of C21H24N4O2S and a molecular weight of 396.509 g/mol.1 Mirabegron is a beta-3 adrenergic agonist that is used for treatment of overactive bladder syndrome.2-4 It has not been implicated in causing liver enzyme elevations or clinically apparent acute liver injury. Its primary use is in the treatment of overactive bladder.5 Mirabegron dose-dependently increased cyclic adenosine 3', 5'-monophosphate (cAMP) concentrations in bladder tissues isolated from rats and showed a potent relaxant effect in isolated rat and human bladder strips precontracted with carbachol at low contraction tonus. Recently, Mirabegron was shown to relax in vitrohuman and rabbit prostate smooth muscle through activation of β3 adrenoceptor. The same group also showed that Mirabegron encourages smooth muscle relaxation by α1 adrenergic receptor blockade.
H N N H N S NH2 O OH
Fig. 1 Chemical structure of Mirabegron
Mirabegron is highly soluble in water, sparingly soluble in methanol, and practically insoluble in methylene chloride.6 Analytical method development and validation play important role in the discovery, development and manufacture of pharmaceuticals.7-8 A detailed literature survey reveals that only a few methods are reported previously to determine Mirabegron by isocratic RP-HPLC9-12 and UV13 spectrophotometry. LC-MS/MS is method for determination of Mirabegron in biological fluids and pharmaceutical dosage forms.14-16
Hence there is a need to develop an RP-HPLC method for the estimation of Mirabegron in Extended-Release tablets. The present work reveals that RP-HPLC method is a simple, precise, accurate, rapid and economical for the assay of Mirabegron in Extended-Release tablets.
2.Results and discussion
2.1. System suitability study
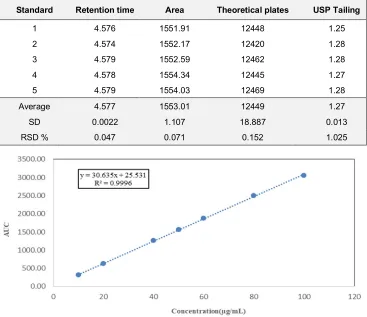
The chromatographic parameters, such as peak area, retention time, theoretical plates and tailing factor were calculated. The peak symmetries were <1.5 and these values are according to the United States Pharmacopeia. Five replicates of a standard solution were injected to check the system suitability. All of the results are presented in (Table 1) and (Fig. 2).
2.2. Method Validation
All of the analytical validation parameters for the proposed method were determined according to the International Conference on Harmonization (ICH) guidelines. Validation of method was divided into linearity and rang, precision, recovery, selectivity, robustness, limit of detection (LOD) and limit of quantification (LOQ) studies. The details of each section were followed.
2.3. Linearity and range
Linearity was checked by preparing standard solutions at seven different concentration levels of Mirabegron. A linear response was obtained in the concentrations 10, 20, 40, 50, 60, 80 and 100 µg/mL. The linear regression line was used to determine the linearity and concentration of the samples.
The calibration curve was developed by plotting concentration of Mirabegron on X-axis and their respective area under the curve (AUC) on Y-axis. The calibration curve is shown in (Fig. 3)
A R T IC L E IN F O A B S T R A C T
Article history:
Received 3 June 2018 Revised 22 June 2018 Accepted 23 June 2018 Available online 26 July 2018
In this study, we describe and validate a rapid and sensitive method for constitution of Mirabegron in the Extended-Release tablets by RP-HPLC. The assay method by HPLC was found to be linear in the concentration range of 10 to 100 µg/mL. Successful separation was achieved by isocratic elution on a Restek C18 column (250 mm × 4.6 mm, 5μm). The mobile phase was composed of buffer pH: 7.0 potassium dihydrogen phosphate and acetonitrile (60:40 v/v) at the flow rate of 1 mL/min using UV detection at 249 nm, column oven temperature 45ºC and injection volume 10 L. The analytical results were validated by recovery studies. The percentage recovery method was found to be 99.00-101.17%. The LOD and LOQ were found to 0.015 μg/mL and 0.049 μg/mL. All the parameters of validation were in the acceptable range. This developed method was successfully applied for estimate the amount of Mirabegron in the tablets.
Keywords: Mirabegron Validation RP-HPLC Method Development
T
* Corresponding Author:
37
M. Rezaei et al. Journal of Medicinal and Chemical Sciences Original Article
J. Med. Chem. Sci. 2018, 1, 36-40 http://jmchemsci.com
Fig. 2 System suitability chromatogram
Table 1 System suitability parameters of standard chromatogram obtained to Mirabegron
Fig. 3 Calibration curve for Mirabegron
2.4. Precision
The precision of the method was verified by repeatability and intermediate precision studies. Repeatability studies were performed by analysis of three different concentrations 40, 50 and 60 μg/mL for Mirabegron three times on the same day. The intermediate precision of the method was checked by repeating studies on three different days (Table 2).
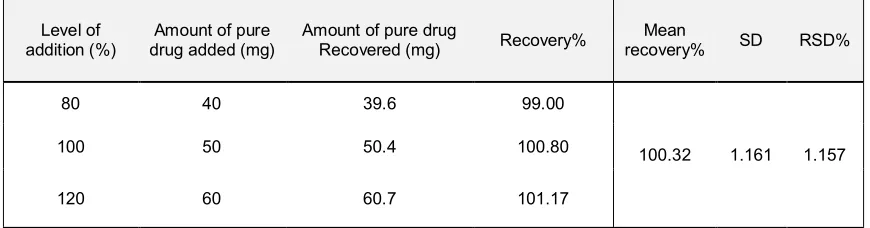
2.5. Recovery studies
Recovery of analytical procedure refers to the closeness of a measured value to a standard or known value. The recovery was
analyzed at the three different levels (80%, 100%, and 120 %) in triplicate by the explained method. The recovery studies were carried out by adding a known amount of pure drug Mirabegron at three different levels to placebo. From the amount of Mirabegron found, percentage recovery was estimated. The results obtained are shown in (Table 3).
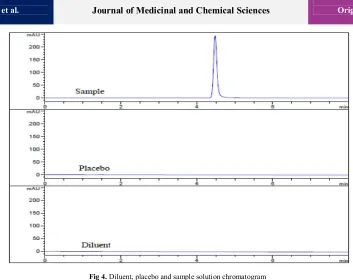
2.6. Selectivity
Its ability to accurately and specifically measure the analyte of interest without interferences from the blank and other ingredients in the matrix was defined. Fig. 4 shows the noninterference excipients with Mirabegron peak.
Standard Retention time Area Theoretical plates USP Tailing
1 4.576 1551.91 12448 1.25
2 4.574 1552.17 12420 1.28
3 4.579 1552.59 12462 1.28
4 4.578 1554.34 12445 1.27
5 4.579 1554.03 12469 1.28
Average 4.577 1553.01 12449 1.27
SD 0.0022 1.107 18.887 0.013
38
M. Rezaei et al. Journal of Medicinal and Chemical Sciences Original Article
J. Med. Chem. Sci. 2018, 1, 36-40 http://jmchemsci.com 2.7. Detection and quantitation limits
The detection limit of an individual analytical procedure is the lowest amount of substance in a sample that can be distinguished but not necessarily quantified as an exact value. The quantitation limit of an individual analytical the procedure is the lowest
amount of substance in a sample that can be quantitatively determined with acceptable precision and accuracy. Signal-to-noise ratios were of 3:1 and 10:1 was obtained for the LOD and LOQ. The LOD and LOQ were found to be 0.015 μg/mL and 0.049μg/mL.
Table 2 Intermediate precision on three different days
Concentration (µg/mL) 40 50 60 Day 1
Mean peak area 1236.51 1553.17 1825.59
SD 0.80 0.38 0.38
RSD % 0.06 0.02 0.02
Day 2
Mean peak area 1237.47 1554.04 1825.28
SD 0.45 0.49 0.53
RSD % 0.04 0.03 0.03
Day 3
Mean peak area 1239.87 1556.23 1827.46
SD 1.35 1.78 0.35
RSD % 0.11 0.35 0.02
Table 3 Determination of percentage recovery method (n=3)
3. Conclusion
The aim of this study was to carry out development and validation of Mirabegron by RP-HPLC method in the Extended-Release tablets. The proposed HPLC method is rapid, sensitive, precise, simple and accurate for the determination of Mirabegron. It can be reliably adopted for routine quality control analysis in the bulk and tablet dosage forms. All of the analytical validation parameters for the proposed method were determined according to the International Conference on Harmonization (ICH) guidelines.
4. Materials and Method
4.1. Reagents and chemicals
The standard of Mirabegron (purity, 99.7%) was obtained from Zhejiang Pharmaceutical Company, CHINA. Tested samples with brand name BetmigaTM belonged to the Astellas Pharma Europe and LC-grade water has been used by the Puris instrument. Acetonitrile and potassium dihydrogen phosphate analysis grade were purchased from Merck Company.
4.2. Instrumental and Analytical conditions
The Reversed Phase-High Performance Liquid Chroma-tography (RP-HPLC) method was developed on an HPLC system. The HPLC analyses were carried out on Agilent 1260 Infinity Quaternary LC equipped with an auto sampler. The separation carried out on Restek C18 column (250 mm × 4.6 mm, 5μm).
Data were analyzed by using Chemstation software. The analysis was monitored with UV/VIS detector at 249 nm. The HPLC was operated in an isocratic elution mode with the mobile phase consisting of buffer pH: 7.0 potassium dihydrogen phosphate and acetonitrile (60:40 v/v). This analysis was done at the 45ºC. The flow rate of elution was 1.0 mL/min. An ultrasonic was used for the sonication of the mobile phase, standard solution, and sample solution.
4.3. Preparation of Solutions
Preparation of solution section is divided into the preparation of mobile phase, standard solution, and sample solution. The details of each section were followed.
Level of addition (%)
Amount of pure drug added (mg)
Amount of pure drug
Recovered (mg) Recovery%
Mean
recovery% SD RSD%
80 40 39.6 99.00
100.32 1.161 1.157
100 50 50.4 100.80
39
M. Rezaei et al. Journal of Medicinal and Chemical Sciences Original Article
J. Med. Chem. Sci. 2018, 1, 36-40 http://jmchemsci.com
Fig 4. Diluent, placebo and sample solution chromatogram
Table 4 Robustness testing (n=5)
4.4. Buffer preparation
Dissolved 1.36 g potassium dihydrogen phosphate in 1000 mL of water. Adjusted the pH to 7.0 with sodium hydroxide solution. Filtrated this solution through 0.45 µm nylon membrane and degas it.
4.5. Preparation of Standard solution
Accurately weighed and transferred about 25.0 mg of Mirabegron reference standard into a 50 mL volumetric flask. Dissolved and diluted to volume with mobile phase. Pipetted out 2mL of this solution into a 20 mL volumetric flask and make up to mark with the mobile phase. Filtrated this solution through 0.45 µm PTFE filter.
4.6. Sample preparation
Twenty tablets were weighed and powdered. Tablet powder equivalent to 25.0 mg of Mirabegron was weighed and transferred to 50 ml volumetric flask and diluted with mobile
phase. Sonicated for 15 minutes and filtered so as to get solution having concentration 500 μg/mL. 2 mL this solution was further diluted with the mobile phase to get the final concentration 50 μg/ml of Mirabegron. Filtrate this solution through 0.45 µm PTFE filter.
Acknowledgments
This work is financially supported by the University of Zanjan of Iran. Thank Tekaje pharmaceutical company for providing sample.
References
1. E. Sacco, R. Bientinesi, Therapeutic advances in urology. 2012, 4,
315-324.
2. K. Konishi, D. Tenmizu, S. Takusagawa, European journal of drug
metabolism and pharmacokinetics. 2017, 43, 1-9.
Parameters Area Retention time Theoretical plates Tailing factor A: Flow rate (mL/min)
0.8 1947.96 5.780 14173 1.28
1.2 1299.67 3.861 11370 1.22
B: Temperature (ºC)
40 1563.07 4.682 12140 1.25
50 1565.77 4.612 13391 1.21
C: Mobile phase pH
6.8 1562.95 4.494 12472 1.29
7.2 1554.02 4.793 12869 1.28
D: % of Acetonitrile
39.2 1557.39 4.782 12696 1.26
40
M. Rezaei et al. Journal of Medicinal and Chemical Sciences Original Article
J. Med. Chem. Sci. 2018, 1, 36-40 http://jmchemsci.com
3. T. Takasu, M. Ukai, S. Sato, T. Matsui, I. Nagase, T. Maruyama, M.
Sasamata, K. Miyata, H. Uchida, O. Yamaguchi, Journal of
Pharmacology and Experimental Therapeutics. 2007, 321, 642-647.
4. C. Von Pirquet, Munchen Med Wchnschr. 1906, 53, 1457-1458.
5. V.W. Nitti, S. Auerbach, N. Martin, A. Calhoun, M. Lee, S.
Herschorn, The Journal of urology. 2013, 189, 1388-1395.
6. W. Krauwinkel, J. van Dijk, M. Schaddelee, C. Eltink, J. Meijer, G.
Strabach, S. van Marle,V. Kerbusch, M. van Gelderen, Clinical
therapeutics. 2012, 34, 2144-2160.
7. P.D. Kalariya, M. Sharma, P. Garg, J.R. Thota, S. Ragampeta, M.K.
Talluri, RSC Advances. 2015, 5, 31024-31038.
8. F. Zhou, Y. Zhou, Q. Zou, L. Sun, P. Wei, Journal of
chromatographic science. 2015, 53, 1361-1365.
9. C.N. Bhimanadhuni, D.R. Garikapati, Am J Pharm Tech Res. 2012, 2,
565-571.
10. G.R. Paisa, Journal of Pharmacy Research. 2017, 11, 682-685.
11. R. Spandana, R.N. Rao, L.S.S. Reddy, Indo American Journal of
Pharmaceutical Research. 2016, 6, 6880-6887.
12. G.R. Babu, G.V. Kumar, M. Kalyani, M. Roshna, P.J. Rani, P.V.
Kumar, S. Ajay, World Journal of Pharmacy and Pharmaceutical
Sciences. 2017, 6, 912-925.
13. P. Ravisankar, S. Vidya, D. Nithya, P.S. Babu, Der Pharmacia Lettre.
2016, 8, 96-103.
14. S. Parsha,Y. Ravindra Kumar, M. Ravichander, L. Prakash, B.
Sudharani, Journal of Liquid Chromatography & Related
Technologies. 2016, 39, 178-194.
15. N. Rjan, K. Anverbasha, American Journal of Pharmatech Research.
2014, 4, 2249-3387.
16. R. Van Teijlingen, J. Meijer, S. Takusagawa, M. Van Gelderen, C.
Van Den Beld, T. Usui, Journal of Chromatography B. 2012, 887,
102-111.
How to cite this paper: M. Rezaei, A. Ramazani, RP-HPLC Method Development and Validation for the Quantitative Estimation of Mirabegron in
Extended-Release Tablets. J. Med. Chem. Sci.2018, 1, 36-40.