S ta tistic a l M odelling o f Colour
D ata and M odel S electio n for
R egion T racking
D a n iel A lexan der
Submitted in partial fulfilment of
the requirements for the degree of
Doctor of Philosophy from
University College London.
1997
UCL
Department of Computer Science
UCL,
All rights reserved
INFORMATION TO ALL USERS
The quality of this reproduction is dependent upon the quality of the copy submitted.
In the unlikely event that the author did not send a complete manuscript
and there are missing pages, these will be noted. Also, if material had to be removed,
a note will indicate the deletion.
uest.
ProQuest 10017409
Published by ProQuest LLC(2016). Copyright of the Dissertation is held by the Author.
All rights reserved.
This work is protected against unauthorized copying under Title 17, United States Code.
Microform Edition © ProQuest LLC.
ProQuest LLC
789 East Eisenhower Parkway
P.O. Box 1346
Abstract
This thesis is concerned with the question o f how best to model naturally occurring distributions
o f digital colour camera data so that objects may be characterised in terms o f such data and thus
tracked through sequences o f images. By use o f a physical model o f the processes by which
colour data is obtained, several statistical models, based on directional statistics, are proposed as
alternatives to the standard multivariate Gaussian distribution. Various types o f algorithm are
discussed that can use these statistical colour models for tracking regions o f interest through
sequences o f images. One such region tracking technique, the active region model or statistical
snake, is investigated in detail and some improvements to the original model are suggested.
In order to decide which o f a set of candidate statistical models and which o f a set of
region tracking algorithms is the best, a methodology for measuring the performance o f these
algorithms in terms of pixel classification is developed. This methodology is used to optimise
the internal parameter settings o f several region tracking algorithms and to compare their overall
performance. For the connected, compact regions o f interest in the test set, active region models
are shown to outperform simpler thresholding and region growing algorithms in terms o f pixel
mis classifications. Some o f the suggested alterations to the existing active region model
implementations are shown to increase performance. However, it is also found that the
introduction o f some desirable properties, such as stability and convergence, can increase
susceptibility to local minima and reduce overall classification performance.
The set o f candidate SCMs are compared over two data sets, representative o f two
separate applications, by comparing the performance o f region tracking algorithms using each
candidate model. It is shown that in controlled environments directional models are superior to
Gaussian models. However, for imagery obtained in less constrained daylight environments,
generalisation o f the directional models is found to be poor and the Gaussian model proves to be
For his invaluable input to the work documented in this thesis and his unceasing encouragement
and enthusiasm, I would like to thank my supervisor, Bernard Buxton. I would also like to thank
B en Southall, Ismail Ismail and Chris Harris for their thoughts on various parts o f various drafts
o f this thesis. M y second supervisor, Simon Arridge, from UCL, Jon Crowcroft, also from UCL,
W ill Hallinan, DERA Chertsey, and Jon Savage, also at DERA Chertsey, also deserve thanks
for general advice and input during the extent o f this project.
Special thanks go to Roheena Anand for her continual support and tolerance,
particularly over the last few months, and to Lee Wright for his gracious acceptance o f the
usurpation o f his printer.
Further acknowledgements go to Jim Ivins, currently working in the Artificial
Intelligence and Visual Research Unit at the University o f Sheffield, for the kind donation o f his
statistical snake code. Similarly, to John Kent, at the University o f Leeds, and Christopher
Bingham, University o f Chicago, for their code used to perform maximum likelihood estimation
for the parameters of the Bingham distribution.
This project was funded by an EPSRC CASE studentship supported by DERA
Contents
CONTENTS... 4
LIST OF FIGURES...9
LIST OF TABLES...13
CHAPTER 1 INTRODUCTION... 14
1.1 Useful So u r œ sof In fo r m a t io n...14
1.2 Thesis Pl a n... 17
1.3 Contributionsa nd Acco m plish m e n t s... 19
CHAPTER 2 COLOUR...21
2.1 Physical Modelsof Digital Colour Da t a... 21
2 .1.1 The Dichromatic Reflection Model...21
2.1.2 Sensor model...24
2.1.3 Modelling mi, and m^... 25
2 .1.4 Applicability o f Reflection Models...26
2.1.5 Multiple Illuminants and Daylight... 2 7 2.1.6 Bi-directional Reflection Distribution Functions...2 9 2.1.7 Linear Models and Colour Constancy...2 9 2 .2 Colour Spacesand Fe a t u r e s...32
2.3 The Useof Colourin Machine Vis io n... 34
2.3.1 Segmentation...34
2.3.2 Object Recognition...37
2.3.3 Tracking...41
2.3.4 Content-Based Image Retrieval...43
2.3.5 Other Uses...44
2.4 Dis c u s s io n...45
CHAPTER 3 STATISTICAL MODELLING... 48
3.1 Statistical Colour Mo d e l s...51
3 .2 Ga u ssia nmodelsofcolourd a t a... 52
3.3 Modellingthe Chromaticity Co m po nent... 54
3.3.1 Gaussian Models in the Unit Plane...56
3.3.2 Oriented Planar M odels...5 7 3.3.3 Thu and Yuille's SCM...58
3.3.4 The Angular Normal Distribution...60
3.4.1 U niform Intensity M o d e l...6 7
3 .4.2 G aussian Intensity M odel...6 7
3 .4 .3 E xploiting Shape K n ow ledge...6 8
3.5 Other Mo d e l s... 72
3 .5 .1 M u ltivariate t m o d e ls... 72
3.5 .2 K e n t’s d istribu tion...73
3 .5 .3 The A n gular C entral G aussian distrib u tio n...73
3 .5 .4 P oisson Intensity M o d e l...74
3.6 Lim it a t io n s...74
3.6.1 Surface R eflection...74
3 .6 .2 C olou r C on stan cy...74
3 .6 .3 Lighting com ponents...75
3.6 .4 Intensity D ependent C h rom aticity...75
3 .6 .5 D ependence o f Intensity on Viewing D ir e c tio n... 75
3 .6 .6 M u lti-M o d a lity...76
3.7 Su m m a r y...76
3.8 Co n c l u s io n s... 76
CHAPTER 4 REGION SEGMENTATION AND TRACKING ...80
4.1 De f in it io n s...80
4 .2 Th re sh o l ding...81
4.3 Region Gr o w ing...82
4.4 Active Co ntour Mo d e l s... 83
4.4.1 O riginal F orm u lation...S3 4.4.2 Common D raw backs...8 6 4.4 .3 Variations o f the Energy Function...86
4 .4 .4 A ltern ative E nergy M inim isation Schem es...90
4 .4 .5 A ltern ative R ep resen ta tio n s...92
4 .4 .6 A C M s a n d C olour...94
4 .4 .7 G eneral C om m ent....94
4.5 Active Region Mo d e l s...95
4.5.1 The statistical snake...96
4.5 .2 The A n ticipating S n ake...98
4.5 .3 Region C o m petition...99
4 .5 .4 O ther A R M s...99
4 .6 Shape Co n st r a in t s...100
4.7 Dyna m ic Mo d e l s... 101
5.1 Th resho lded Likelihoodim a g e s... 104
5 .2 Reg io n Gro w ing... 106
5.3 Active Region Mo d e l s... 108
5.3.1 P ro b le m s...110
5 .3 .2 D e a d lo c k...110
5 .3 .3 C o n ve rg en ce...I l l 5 .3 .4 The Variational A pproach...112
5 .3 .5 The E nergy F u n ction...115
5 .3 .6 A ltern ative E nergy M inim isation Schem es...118
5.4 Su m m a r y... 126
CHAPTER 6 PERFORMANCE CHARACTERISATION...128
6.1 Perfo rm a nce Characterisationin Computer Vis io n...128
6.2 Existing Segm entation As sessm en t Sch em es... 129
6.2.1 P ros an d C on s...130
6.2.2 O th er M ethods...131
6.3 Empirical Discrepancy Me t h o d s...132
6.4 Other Co n sider ation s...134
6.4.1 G round T ru th...134
6.4.2 Lim its o f A ccu ra cy...135
6.5 Perfo rm a nceof Cl a ssih c a t io n Sy st em s... 135
6.5.1 P ro b a b ility o f E rro r a n d B ayes R isk...135
6.5.2 R e ce ive r O perating C h aracteristic (RO C) A n a ly sis...136
6.5.3 D oubt-M isclassification C u rv e s...138
6.6 A Me a su r eof Pe rfo rm a nce... 139
6.7 Experim ental Pr o toc o l...139
6.7.1 Internal P a ra m eter O p tim isa tio n...139
6.7.2 Training, testing an d v a lid a tio n...140
6.7.3 S u m m ary...140
6.8 Dis c u s s io n...141
CHAPTER 7 EXPERIMENTS AND RESULTS... 144
7.1 Da t a s e t s... 144
7.1.1 C lothes s e t...144
7.1.2 Tracks S et...145
7 .2 General Co n s id e r a t io n s... 146
7.3.2 R egion G rowing A lgorith m...152
7.3.3 A R M s...153
7.3.4 C om parison...158
7.4 Com parisonof SCMs...160
7.4.1 A R M s...160
7.4.2 Thresholded L ikelih ood Im ages...165
CHAPTER 8 CONCLUSIONS... 170
8.1 Region Tracking Algorith m s... 170
8.2 Active Region Mo d e l s... 170
8.2.1 G en eral C on clu sion s...175
8.3 Statistical Colour Mo d e l s...176
8.3.1 Clothes D ata S e t...177
8.3.2 Tracks D ata S e t...180
8.3 .3 G eneral C on clu sion s...182
8.4 Perform ance Ch aracterisation Me t h o d o l o g y...183
CHAPTER 9 ACHIEVEMENTS AND FUTURE WORK... 186
9.1 Colour Mo d e l l in g... 186
9.1.1 A chievem ents...186
9.1.2 Further Work...187
9.2 R e g io n T r a c k in g ...188
9.2.1 A chievem ents...188
9.2.2 Further Work...189
9.3 Perform ance Ch a r a c t e r isa t io n...191
9.3.1 A chievem ents...191
9.3.2 Further W ork....191
9.4 Other Possible Directions... 192
REFERENCES... ..1 94 APPENDIX A MULTI-MODE SCMS...204
A .l Cl u s t e r in g... 206
A .2 Statistical Mo d e ll in g... 210
A .3 Preliminary Re s u l t s... 212
A .4 Dis c u s s io n... 215
APPENDIX B ALGORITHMS... 217
B.2.1 Black Pixels...218
B.2.2 Look-up Tables...219
B.2.3 Computation Tim es...219
B .3 Clustering Procedure... 220
B.3.1 Histogram Storage...221
B.3.2 Histogram Resolution...221
B.3.3 Pruning... 222
B .4 Region Gr o w in g... 223
B .5 Co m puting Go o dness In t e g r a l s...223
B.5.1 Line Integrals...224
B.5.2 Extended Line Integral...2 2 5 B.5.3 Surface Integrals...226
B.5.4 Extended Surface Integral...228
APPENDIX C RECEIVER OPERATING CHARACTERISTIC ANALYSIS...232
C .l The ROC c u r v e... 232
C .2 System Mo d e l... 234
C.3 Perfo rm ance Me a su r e sfrom ROC c ur ves... 237
C .4 Operating Point Selectio n... 238
C.5 Pro b le m s...238
APPENDIX D FURTHER RESULTS... 240
D. 1 Clothes Training Se t, Intensity Model Co m p a r iso n... 240
D .2 Clothes Training Se t, Chromaticity Model Co m p a r is o n... 241
D.3 Tracks Training Se t, Intensity Model Co m pa r iso n...243
Figure 1 Geometric picture of a typical viewing scenario. 22 Figure 2 Models for the shape of the distributions of SPDs of light reflected from a convex body
under a single illumination. 23
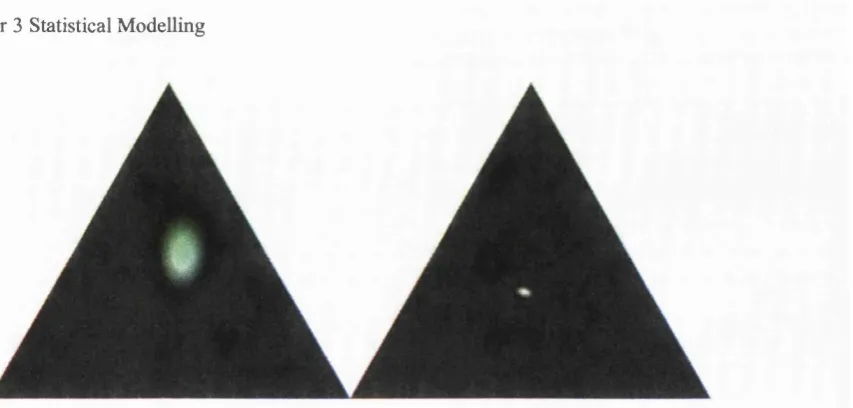
Figure 3 Two images containing regions of interest that need to be characterised by a SCM. The
seed region is outlined in each image. 48
Figure 4 RGB cubes showing the occurrence histograms of data in (top) the seed regions and (bottom) the regions of interest as a whole throughout the sequences of Figure 3. 49 Figure 5 Gaussian models constructed from the sample distributions shown in Figure 4. 53 Figure 6 Directional chromaticity, uniform intensity SCMs constructed from the sample
distributions shown in Figure 4. 55
Figure 7 Sample (top) and parent (bottom) chromaticity distributions, from the images of Figure 3,
shown in the unit plane. 55
Figure 8 Gaussian chromaticity models in the unit plane. 56
Figure 9 Demonstrates how tighter models of directional distributions can be constructed by choosing a plane perpendicular to the mean of the distribution. 57 Figure 10 Gaussian chromaticity models in planes oriented with the mean of the sample
distributions. Shown in the unit plane. 58
Figure 11 ZYCUI models constructed from the sample distributions shown in Figure 4. 59 Figure 12 Angular normal chromaticity models depicted in the unit plane. 61 Figure 13 Bingham chromaticity models depicted in the unit plane. 63
Figure 14 Robust Bingham models depicted in the unit plane. 64
Figure 15 Disparity of directions of lines from the origin caused by uncertainty in the absolute
position of a data point. 64
Figure 16 Chromaticity models constructed using Healey’s approach, depicted in the unit plane. 65 Figure 17 BCGI models (top) and ZYCGI models (bottom) constructed from the sample
distributions shown in Figure 4. 68
Figure 18. Rough surface illuminated and viewed from fixed directions 69 Figure 19 Sample (top) and parent (bottom) distributions of intensities from the objects in Figure 3
with uniform, Gaussian and planar intensity models. As usual, the pictures on the left
correspond to the green shorts and those on the right to the track. 71 Figure 20 Grey level likelihood images generated from a Gaussian SCM, with the tolerance
parameter, k, set to a moderate value of 3.0, applied to the images in Figure 3. 105 Figure 21 Region segmentations generated by thresholding the two grey scale likelihood images in
Figure 20 at a value of 120. 105
Figure 22 The effects of binary mathematical morphology on the region segmentations shown in Figure 21. A morphological closure is performed followed by an opening using a circular
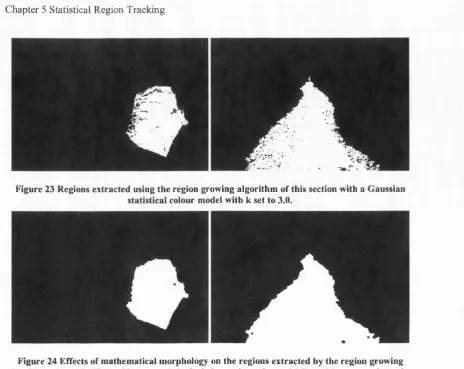
Figure 23 Regions extracted using the region growing algorithm of this section with a Gaussian
statistical colour model with k set to 3.0. 107
Figure 24 Effects of mathematical morphology on the regions extracted by the region growing algorithm, shown in Figure 23. A morphological closure is performed followed by an opening using a circular structuring element of diameter 9 pixels. 107 Figure 25 The four subsequent region segmentations for the track sequence following those in
Figure 23 (top - no morphology) and Figure 24 (bottom - morphological post-processing). 107 Figure 26 Typical region segmentations obtained from an ARM applied to the images of Figure 3.
109 Figure 27 Evolution of two ARMs one (top) using Ivins and Porrill’s collision resolution strategy
and one (bottom) using element deletion. I l l
Figure 28 Various confîgurations of a variational ARM having reached the desired image
boundary. 113
Figure 29 Typical graphs of the average force magnitude versus iteration number, a is fixed at 1.0 and P and p (the image energy coefficient) have the values given in the legend. 114 Figure 30 AFM versus iteration number for CID and DAG ARMs with identical parameter settings
applied to the first image of the track sequence. 117
Figure 31 Three elements of a contour, u, on an image are shown as is the set of candidate new positions for the middle element. The triangles that would be included (or excluded) by one of
these moves are shown. 119
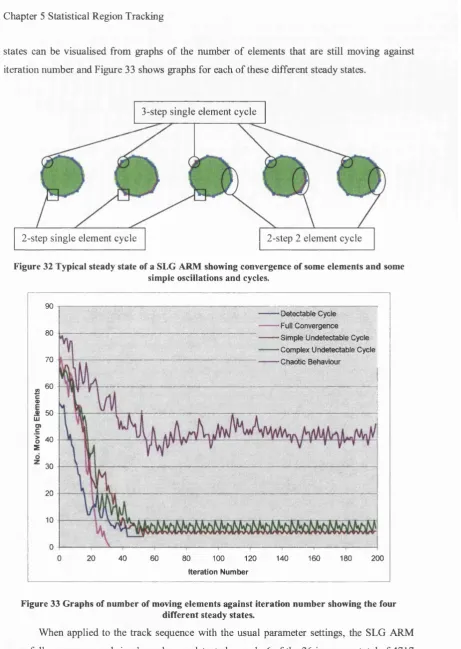
Figure 32 Typical steady state of a SLG ARM showing convergence of some elements and some
simple oscillations and cycles. 121
Figure 33 Graphs of number of moving elements against iteration number showing the four
different steady states. 121
Figure 34 Shows the situation on the subsequent iteration to that shown in Figure 31, when the middle element has been moved up one pixel, but the other two remained fixed. 122 Figure 35 Contours extracted by DAG (top) and MLG (bottom) ARMs from the images of Figure 3. 125 Figure 36 Contours extracted by the MLG ARM with k increased to 3.5. 126 Figure 37 Ground truth data for the two images shown in Figure 3. 135 Figure 38 Illustration of the common algorithm model used in ROC analysis 137 Figure 39 The first image of each sequence from the clothes data set. The seed regions are
superimposed on each region of interest 145
Figure 40 The first image of each sequence from the tracks data s e t The seed region is
superimposed on each. 146
Figure 41 ROC curves from hand region segmentations. 150
Figure 42 Plot of performance of the thresholded likelihood image algorithm over the tracks training set as the diameter of the structuring element is varied. 151 Figure 43 Plot of performance of the region growing algorithm over the tracks training set as the
Figure 45 Performance measures obtained from each ARM over the tracks training set. 156 Figure 46 Plot of the ARM performances over the tracks test set. 157 Figure 47 ROC curves obtained for each ARM over the tracks test s e t 158 Figure 48 ROC curves from the best algorithm of each type generated over the tracks test set using
a Gaussian SCM. 159
Figure 49 ROC curves generated by the ARM over the clothes test set using various intensity
models 161
Figure 50 ROC curves obtained from the ARM over the clothes test set using various chromaticity
models. 162
Figure 51 Plot of ARM performances using various statistical colour models over the clothes test
set. 163
Figure 52 ROC curves generated by the ARM over the tracks test set using various intensity
models. 164
Figure 53 ROC curves obtained from the ARM over the tracks test set using various chromaticity
models. 165
Figure 54 Plot of ARM performances using various statistical colour models over the tracks test set. 166 Figure 55 ROC curves obtained from thresholded likelihood images, with no morphological post
processing, over the clothes test s e t 167
Figure 56 Plot of thresholded likelihood image performance over clothes test set for various SCMs. 168 Figure 57 ROC curves obtained from thresholded likelihood images, with no morphological post
processing, over the tracks test set. 168
Figure 58 Plot of thresholded likelihood image performance over tracks test set for various SCMs. 169 Figure 59 An example illustrating how low measures of performance arise for the OIP ARM
(shown in purple), which is compared to the CID ARM (shown in blue). 171 Figure 60 Evolution of a DAG ARM, over the first four frames of a sequence - from left to right,
top to bottom, with (in red) and without (in blue) the termination condition applied. 173 Figure 61 An example of a MLG ARM (shown in purple) getting stuck at a local energy minimum
position, which is passed over by the DAG ARM (shown in blue). 174 Figure 62 An unstable final confîguration caused by the fixed topology of the ARM (shown in blue). 176 Figure 63 Likelihood images obtained, from the shorts image of Figure 3, using uniform (left) and
Gaussian (right) intensity models and a directional (Bingham) chromaticity model. 178 Figure 64 Likelihood images obtained, from the shorts image of Figure 3, using Gaussian
Figure 65 Likelihood images obtained, from the shorts image of Figure 3, using Healey’s model
(left) and an angular normal model (right). 178
Figure 66 Likelihood images obtained, from the shorts image of Figure 3, using a trivariate
Gaussian model (left) and a Zhu and Yuille SCM (right). 180
Figure 67 Likelihood images obtained, from the tracks image of Figure 3, using uniform (left) and planar (right) intensity models and a directional (Bingham) chromaticity model. 181 Figure 68 Likelihood images obtained, from the tracks image of Figure 3, using Healey’s
chromaticity model (left) and a linearly down-weighted Bingham model (right), both with
planar surface intensity models. 181
Figure 69 Likelihood images obtained, from the tracks image of Figure 3, using a trivariate Gaussian SCM and Zhu and Yuille’s chromaticity model with a planar surface intensity
model. 181
Figure 70 A multicoloured object under a single illumination (left) on a cluttered background. 205 Figure 71 Occurrence histograms of colour data showing the sample (left) and parent (right)
distributions from the object of interest in Figure 70. 205
Figure 72 Single mode Gaussian (left) and BCUI (right) models constructed from the seed region
shown in Figure 70. 206
Figure 74 Multimode statistical colour models for the region of interest in the image shown in
Figure 70. 213
Figure 75 Sample (left) and parent (right) chromaticity distributions from the region of interest in
Figure 70. 213
Figure 76 Single mode (left) and multi-mode (right) Bingham chromaticity models for the region of
interest in Figure 70. 213
Figure 77 ROC curves for single mode and multi-mode Gaussian models. 214 Figure 78 ROC curves for single mode and multi-mode BCUI models. 214 Figure 79 ROC curves for single mode and multi-mode BCGI models. 215 Figure 80 The atomic sub-pixel regions over which expressions for the surface integral are
required. 227
Figure 81 Typical triangle over which the surface integral might be required shown on a 2D image
grid. 229
Figure 82 The sixteen ways in which one of the edges of the triangle can intersect a consistent
square. 231
Figure 83 Examples of ROC curves. 233
Table 1 Summary of directional chromaticity models. * indicates that a chromaticity model has not been used previously and so is an original contribution of this thesis. 50 Table 2 Summary of intensity models. * indicates that an intensity model has not been used
previously and so is an original contribution of this thesis. 51 Table 3 Summary description of ARM implementations used in this work. * indicates that the
ARM is new and so is an original contribution of this thesis. 103 Table 4 Lists the end points of the lines joining to the previous and next elements of the contour,
along which the goodness is averaged to ensure single step consistency of the image energy
change approximation. 123
Table 5 Calculation of operating points. 148
Table 6 Operating points (values of k) used for each ARM using a Gaussian SCM over the tracks
data s e t 154
Table 7 Optimal parameter settings for each ARM found on the tracks training set. 156 Table 8 Performance measures obtained for each ARM over the tracks test s e t 156 Table 9 Performance measures for each region tracking algorithm generated over the tracks test
set using a Gaussian SCM. 159
Table 10 ARM optimal parameter settings and performance measures obtained for each intensity
model over the clothes training and test sets 161
Table 11 Optimal parameter settings, maximum performance over clothes training set, and final performance over clothes test set for the ARM using various chromaticity models. 162 Table 12 ARM optimal parameter settings and performance measures obtained for each intensity
model over the tracks training and test sets. 164
Table 13 Optimal parameter settings, maximum performance over tracks training set, and final performance over tracks test set for the ARM using various chromaticity models. 165 Table 14 Performance of the thresholded likelihood image algorithm over the clothes test set using
various SCMs. 166
Table 15 Performance of the thresholded likelihood image algorithm over the tracks test set using
various SCMs. 167
Table 16 Values of z(A) found for each model. 212
Table 17 Processor times for likelihood image construction using various SCMs. All times are
Chapter 1 Introduction
Chapter 1 Introduction
The work reported in this thesis is an investigation into the statistical m odelling o f naturally
arising distributions o f digital colour data. The purpose o f the investigation is to determine how
best to characterise objects in terms o f the colour image data that corresponds to them. Such a
model can be useful for a number o f automatic visual tasks such as the identification and
location o f objects in a scene; extraction o f the image region that corresponds to a particular
object; and tracking o f such regions o f interest through sequences o f images. The application
motivating this investigation is tracking and, in particular, tracking country roads and lanes to
assist the navigation of cross-country autonomous land vehicles.
1.1 Useful Sources of Information
There are several sources o f information that might be useful to a system that performs region
tracking tasks o f this type. Grey-level pixel intensity data can be used to provide som e degree o f
discrimination between different regions in an image and many image processing techniques,
such as those discussed later in Chapter 4, often use grey-level data directly. However, when
only the grey-level intensity is available, it can often be hard to distinguish separate objects
from one another. The use o f edge information, typically derived from an image by application
o f a differential or morphological filter, can greatly assist the task o f extracting distinct regions
particularly when some knowledge of the shape o f the region o f interest is held. A ctive
contours, also discussed in Chapter 4, have proved to be an effective way of exploiting grey
level data in this way and have becom e a popular tool for tracking.
Multiband imagery arises when a scene is viewed simultaneously by a number of
different registered sensors. Colour images typically have three bands corresponding to three
sensors with different response functions - one with its peak in the red part o f the visible
spectrum, one in the green part and one in the blue. Other sensors may have response peaks
elsewhere in the electromagnetic spectrum, e.g., infrared cameras, radar or X-ray machines, and
so can provide alternative or extra bands. Each separate band yields a simple intensity image
like those discussed in the previous paragraph.
The extra dimensionahty in data from multiband images allows a much greater degree
o f discrimination between different regions in an image than can be provided by single band
intensity imagery. For this reason, together with the gradual increase in available computer
power making computations involving large amounts o f data more feasible, multiband imagery
is beginning to be preferred for many applications. In particular, colour image data has proved
useful for tracking roads and lanes in the past. Crisman, [Cri92], used colour image data to
through sequences of images. Her approach, which is an extension o f the colour component o f
the road tracking system presented by Thorpe, et al, [THK88], is further discussed in Chapter 5.
A more general review o f the u se o f colour data in computer vision related applications is given
in Chapter 2.
Other information sources that can be useful for tracking include range data, which can
be obtained directly from range scanners or can be inferred from camera data either by using a
stereo pair o f cameras or by analysing discrepancies between consecutive frames o f image
sequences. In the DROID system, developed by Harris, et al, [Har92], range data, generated by
associating corner features between consecutive frames o f an image sequence and analysing the
motion from frame to frame, is used to generate a topological map o f the environment. This
map can be used to find roads, or drivable regions, by looking for horizontal planar regions in
that map; it is particularly useful, however, for obstacle detection. The motion o f corresponding
points between consecutive frames o f image sequences can also be used directly to differentiate
between image regions corresponding to different objects. Smith, [Smi95], exploits this
information, by grouping together regions containing points with similar motion, to find and
track moving vehicles in road scenes. Smith’s system is shown to work w ell on a range of
imagery and it has also been used, in conjunction with a fixed calibrated camera, to track cars
on a motorway and calculate their speed. Stereo matching algorithms provide range information
by analysing the disparity o f associated features in the pair of images and so can be used in a
similar way, as in the navigation system for planetary rovers developed by Matthies, [Mat92].
Another rich source o f information is image texture. Texture measurements are
typically made by convolving several filters with raw image data to produce a number o f texture
images, which together can be regarded as a multi-band image. This multi-band data can be
dealt with in a similar way to colour imagery, for example, by using statistical methods as in
this work. A popular set o f filters for differentiating between different image textures, suggested
by Turner, [Tur86], is derived from the family of Gabor functions. In earlier work due to Laws,
[Law79], an optimal set o f filters for discriminating between a number o f real-world textures
were suggested which turned out to be approximations to filters constructed from 2D Gabor
functions. Ivins and Porrill, [IP95], use a multivariate Gaussian statistical model to characterise
the distribution o f Laws texture measurements arising in an image region corresponding to an
object o f interest. Using this model, their algorithm, described later in Chapter 4, is shown to
separate two differently textured regions in a single image with reasonable accuracy. W eldon
and Higgins, [W H96], also use statistical methods to analyse texture measurements, em ploying
a Rician model o f the distribution o f Gabor filter responses corresponding to a single textured
region. Again, limited results are presented in which a single image is separated into regions o f
different texture. Another popular method for modelling texture information is by use o f a
Chapter 1 Introduction
a texture model o f this type for identifying drivable regions, such as roads, in images. In a single
example, their algorithm shows limited success in classifying each pixel as road, grass, foliage
or brick. Campbell, et al, [CMT97] use a neural network model o f combined colour and texture
data for similar purposes. Their results are more comprehensive, showing good rates o f pixel
classification, and are discussed in the next chapter.
Despite a common lack o f comprehensive empirical testing and evaluation, all the work
discussed above suggests that tasks such as tracking can be achieved with som e success by
properly exploiting any o f these sources o f information. A higher level o f performance and
robustness, however, would almost certainly be achieved by com bining analyses o f all the
available information. Crowley and Berard, [CB97], have developed such a system for tracking
faces through sequences of images. Colour information, motion detection and frame to frame
correlation are all used to pinpoint the location o f the face; the different visual processes are
supervised by a blackboard architecture. The resulting system is reported to be much less likely
to loose track o f the object o f interest than a system that exploits just one of these
complementary sources o f information. The road follow ing system o f Thorpe, et al, [THK88],
exploits both colour and texture information, together with a simple model o f the shape o f the
corresponding image region, to find the road. 3D data from a laser range finder is also used to
detect obstacles. Although the system is quite slow, Crisman quotes 6 seconds per image on a
sun4, the tracker is reported to be very reliable. There are many issues o f concern when
constructing systems that fuse information from different sources and Abidi and Gonzales,
[AG92], provide an extensive general discussion o f these issues. One clear guideline is that to
m aximise the performance o f any system that fuses information from several sources, each
contributory information source must be well understood so that it can be fully exploited. To
this end, the work in this thesis concentrates solely on colour data and investigates how best to
use it for tasks such as region tracking.
Potential applications for robust, reliable tracking systems are wide and varied. As
mentioned, tracking o f roads or paths through sequences o f images is an important step toward
autonomous guidance o f vehicles or robots. Face tracking systems, such as that o f Crowley and
Berard, can be useful for video conferencing as the amount o f data that has to be transmitted can
be reduced if the region of interest in the image is known. Algorithms for tracking lips and other
facial features, see for example the work o f Terzopoulos and Szeliski, [TS92], could be a crucial
component in a system for automatic lip-reading or facial expression interpretation. Similar
algorithms for tracking hands and other body parts can be used in gesture recognition systems,
as in the work o f Heap, [Hea95], which might be used in future user interfaces. System s for
tracking people have also been developed, for example by Baumberg and Hogg, [BH94]. Such
systems could be useful for surveillance, or applications like the Smart Kiosk o f Rehg, et al,
sales pitches. Both people tracking and gesture recognition systems have been em ployed in
interactive virtual environments such as the KIDSROOM, developed by Bobick, et al, [BDI96,
IDB97].
Tracking systems also have agricultural and biological applications. Systems capable o f
tracking stationary crops from a moving vehicle, such as the system described by Reynard, et al,
[RW B96], are useful for autonomous agricultural vehicles, both for navigation along rows o f
crops and to pinpoint individual plants to be watered or fed. Marchant and Onyango, [M 09 5],
developed a system for tracking pigs in scenes, and a similar system has been used, by
McFarlane and Tillet, [MT97], for tracking fish. Such systems provide useful monitoring o f
livestock, which can be used to judge feeding requirements and the timing o f grading and
harvesting. W hile working towards the development o f a robot livestock herder, Sumpter, et al,
[SBT97], used a tracking system to generate data used to analyse the behaviour o f herds o f
animals. Leymarie and Levine, [LL93], developed a system to track cells through sequences o f
microscopic images in an attempt to automate analyses o f cell motion, which is o f great
importance in some areas of biological research.
Sequences of images through which a region must be tracked are not necessarily
temporal and a common medical apphcation of tracking systems is for volume rendering. Given
a series of slice images through the brain, for example, a region corresponding to a particular
part o f the brain might be tracked through the series of slices to yield the 3D shape o f that
region. An example of this type o f application is the work o f Ivins and Porrill, [IP94a].
1.2 Thesis Plan
The problem motivating the work reported in this thesis is that o f tracking regions o f interest
through sequences o f images. The intended contribution to that problem is to learn how best to
exploit one particular source o f information - colour im age data - in a system that performs
tracking tasks. Attention is therefore focussed on the development o f a tracking system based
solely on colour data, although future inclusion of other types o f data is hom e in mind. During
the course o f this investigation, three main questions arise:
• H ow is an object best modelled in terms o f the colour data that corresponds to it?
• Once an object has been modelled in terms of that data, how is that model best exploited in
order to track the object through a sequence of images?
• H ow can “best” be defined?
These questions are addressed in the remainder o f the thesis, in roughly the order given above.
Chapter 2 contains background on the use o f colour in machine vision. In order to
model distributions o f colour data effectively, it is necessary to understand the physical
Chapter 1 Introduction
are presented and discussed. Given a distribution o f colour data that corresponds to an object o f
interest, there are several modelling techniques available for characterising the object in terms
o f that data. Chapter 2 goes on to review the use o f colour data for common machine vision
tasks with emphasis on the modelling techniques used in those applications.
The m odelling technique investigated in this thesis is the use o f parametric statistical
models and in Chapter 3 a number o f statistical models for colour data are presented. A simple
model o f the reflection processes that give rise to colour data is adopted and used to infer the
shape o f the statistical models. This model implies that the data can be divided into two
independent components - a directional chromaticity component and an intensity component
corresponding to the magnitude of the combined sensor responses. Directional models for
colour data, based on a similar physical model, have been used in the past and previous attempts
at modelling distributions o f colour data in this way are reviewed. U sing established directional
statistical theory, however, some alternative, less ad-hoc, directional chromaticity models are
proposed. Although statistical models of the distribution o f intensity data comprising regions o f
interest have been investigated to some extent in the past, to the author’s knowledge these have
not been incorporated into statistical models for colour data. Existing models for intensity data
are reviewed and a novel model for roughly planar surfaces is proposed. The chapter concludes
by beginning to address the third question above with some discussion o f how the most
appropriate model for a particular distribution of data might be identified.
The first of the three questions at the start of this section, that of how best to
characterise an object in terms of colour data, is addressed in Chapter 2 and Chapter 3. Chapter
4 and Chapter 5 are concerned mainly with the second - how to exploit such models in order to
track objects in scenes. Chapter 4 provides background and review o f techniques available for
tracking regions o f interest through sequences o f images and in Chapter 5, the algorithms that
are used in this work are detailed. The review in Chapter 4 shows a wide diversity o f different
approaches to region tracking but also highlights the lack of empirical comparison between the
different techniques. This deficiency makes selection o f the most appropriate technique
somewhat difficult, but, as a starting point, three different algorithms are used. The first
algorithm is a simple thresholding technique, the second is a region grower and the third is
based on the active region model proposed by Ivins and Porrill, [IP94, Ivi96] - the “statistical
snake”. Som e problems with the original implementation o f the active region model arose
during the course o f the work and these problems and suggested solutions are the main subject
o f Chapter 5. Several alternative implementations o f the active region model are developed in
order to overcom e these problems.
The question o f which statistical colour model, or which region tracking technique is
appropriate in different situations. Within a particular application domain in which an algorithm
exploits a statistical model to perform some task, however, the best statistical model might
reasonably be defined to be the one that maximises the performance o f the algorithm. This is
how the third question, how to define “best”, posed at the beginning o f this section is answered
here. The best statistical colour model is identified by applying a region tracking algorithm to
data representative o f certain appUcations, using a set o f candidate models, and choosing the
model that produces the highest performance o f the algorithm. In Chapter 6, the problem o f how
to measure the performance o f such algorithms is addressed. Existing methods for obtaining
performance measures o f similar algorithms are reviewed and, by considering the objectives of
both the algorithm and the performance characterisation itself, a suitable performance measure,
based on receiver operating characteristic analysis, is identified. The experimental protocol, by
which the statistical colour models and different region tracking algorithms are to be compared,
is also outlined in Chapter 6.
The statistical colour models developed in Chapter 3 are compared over two sets o f data
representing two separate applications. The first set is comprised o f sequences o f images
obtained under conditions that approximate the assumptions inherent in the simple reflection
model used to develop the directional statistical colour models. However, an off-the-shelf
camera and illumination source, and real-world objects o f interest (items o f clothing), are used
throughout. The second set consists o f sequences o f images containing roads and tracks taken in
daylight scenes, again using an off-the-shelf imaging device. Experiments and results are
described and presented in Chapter 7. From these results comparisons o f the performance of
various statistical colour models, the three different types o f region tracking algorithm and
various alternative implementations o f the active region model are derived.
Conclusions are drawn in Chapter 8 and Chapter 9 contains some discussion o f the
achievements of the work presented in this thesis and som e possible directions for the future.
1.3 Contributions and Accomplishments
This section summarises the original contributions o f the work reported in this thesis.
• Analysis and development o f statistical models for distributions o f colour camera data.
• Analytic comparison o f existing methods for representation o f directional
chromaticity data.
• U se o f established directional models, in particular the Bingham distribution, for
m odelling distributions o f chromaticity data.
• Developm ent o f a new, non-Gaussian model for the distribution o f intensity data
Chapter 1 Introduction
• Combination o f chromaticity and intensity models to produce full RGB data
models.
• Developm ent o f active region models with consistent enough behaviour to enable their
performance to be characterised reliably.
• Identification and amelioration o f a significant mode o f failure o f existing active
region model algorithms - the tanghng effect.
• Apphcation o f greedy energy minimisation techniques to active region models in
order to increase stability and convergence properties.
• Framework for performance characterisation o f region tracking algorithms over sets o f data
representative o f particular applications.
• Comparison o f the performance o f active region models with simpler thresholding
and region growing techniques.
• Comparison o f the performance o f different implementations of the active region
model.
• System -level comparison o f the performance o f the statistical colour models used to
Chapter 2 Colour
The extra information contained in colour images compared to single band intensity images
potentially provides much greater degrees o f discrimination between different im age regions.
Accordingly, the use o f colour data in systems performing machine vision tasks is becoming
increasingly popular. However, the extra dimensionality brings added com plexity and before
colour data can be exploited properly, some investigation o f its particular properties is required.
In order to give som e insight into the shape and structure of distributions o f colour data, in this
chapter the physical processes that give rise to and affect these distributions are examined and
com monly used models o f these processes are reviewed. Representation o f colour data is then
discussed, followed by a review o f the uses to which colour has been put within the field of
machine vision. The emphasis o f the review is on the variety o f techniques by which
distributions o f colour data can be modelled to characterise objects o f interest in scenes and the
chapter concludes with some discussion o f these options and their appropriateness for the
applications o f interest here.
Luong, [Luo93], also provides a review o f colour machine vision. He reviews
representation of colour data and colour constancy more thoroughly and places less emphasis on
modelling aspects. Further reviews of the representation o f colour data can be found in the
books by W yszecki and Styles, [W S67], and Foley, et al, [FVF90].
2.1 Physical Models of Digital Colour Data
In order to exploit complex multi-dimensional data, such as colour data, to its full potential, the
data and the processes that give rise to that data must be well understood. To this end, some
models o f the physical processes that combine to give rise to the digital colour data found in
colour images are discussed in this section.
2.1.1 The Dichromatic Reflection Model
The dichromatic reflection model (DRM) was introduced by Shafer, [Sha85], to describe the
way that light interacts with surfaces o f non-homogeneous dielectric materials and it is now
w idely used in machine vision applications when analysing colour data. According to the
model, light from a single illuminant reflected by a surface has two components - surface
reflected light and body reflected light.
Surface reflected light is reflected at the interface o f the surface with the atmosphere
and is the component that dominates in highlights or specularities in a scene. The direction of
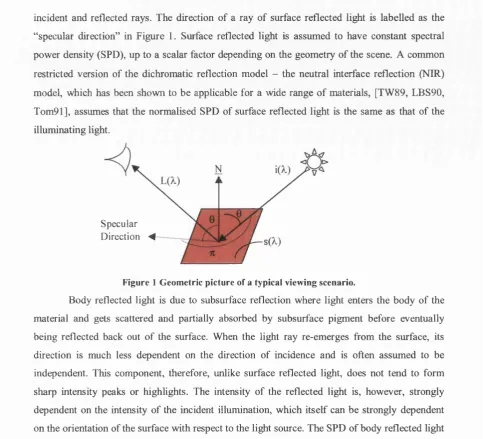
the reflected light ray depends only on the direction o f the incident ray, see Figure 1, and the
Chapter 2 Colour
incident and reflected rays. The direction o f a ray o f surface reflected light is labelled as the
“specular direction” in Figure 1. Surface reflected light is assumed to have constant spectral
power density (SPD), up to a scalar factor depending on the geometry o f the scene. A common
restricted version o f the dichromatic reflection model - the neutral interface reflection (NIR)
model, which has been shown to be applicable for a wide range o f materials, [TW89, LBS90,
Tom91], assumes that the normalised SPD o f surface reflected light is the same as that o f the
illuminating light.
Specular
D irection
M-Figure 1 G eom etric picture o f a typical view ing scenario.
Body reflected light is due to subsurface reflection where light enters the body o f the
material and gets scattered and partially absorbed by subsurface pigment before eventually being reflected back out o f the surface. When the light ray re-emerges from the surface, its direction is much less dependent on the direction o f incidence and is often assumed to be
independent. This component, therefore, unlike surface reflected light, does not tend to form sharp intensity peaks or highlights. The intensity o f the reflected light is, however, strongly
dependent on the intensity o f the incident illumination, which itself can be strongly dependent on the orientation o f the surface with respect to the light source. The SPD o f body reflected light
is assumed to be, agam up to a scalar factor depending on scene geometry, the product o f the illuminant SPD and the reflectance SPD o f the reflecting surface. From a surface patch with
fixed reflectance SPD, s(X), lying in a scene illuminated by a single illuminant with SPD i(X),
the SPD o f the reflected light, or scene radiance, L, assuming the DRM and NIR, is given by
L ( K g) = mg (g)i(k) + my (g)s(k)i(A.),
where X parametrises the wavelength o f electromagnetic radiation; nis(g) and mb(g) are the non negative scalar coefficients o f the surface and body reflection components, respectively, which
depend on the scene geometry, g, which incorporates not only 0 in Figure 1, but also the angles
made by the viewing direction with the incident and surface normal directions. L is therefore
constrained to lie on the positive subset o f the plane spanned by i(X) and s(X,)i(X,) in the infinite dimensional space o f spectral power densities (SPDs).
Assumptions about the distribution of surface patch orientations and incident light
et al, [K1193, KSK90], consider the case o f smooth, single coloured surfaces under a single, fixed, collimated light source. They argue that under these conditions, the range o f orientations
o f surface patches from which a non-negligible amount o f surface reflected light is received at a
fixed sensor position is highly restricted, giving rise to sharp highlights. The value o f nib(g), and
hence the intensity o f the body reflected hght componait, for surface patches corresponding to highlights is roughly constant. The SPD o f light reflected from non-highlight regions is
constrained to move on a line passing through the origin in a direction given by s(A.)i(A,).The
value o f ms(g), which varies much more quickly than mb(g), can take a range o f values over a
highlight region o f the image and thus the SPD o f light from a highlight region is constrained to move on a line starting at some point on the non-highlight line, heading in a direction parallel to
i(X). The overall distribution o f reflected light SPDs over the surface then assumes a skewed-T
shape, [Kli93, KSK90].
Bajcsy, et al, [BLL96], generalise this model for rougher surfaces or slightly non
collimated light sources by allowing nib(g) to vary over the range o f g for which ms(g) is non-negligible. For surfaces like this, the highlight line of the skewed-T shape distribution widens to
produce a shape more like a skewed-P. Figure 2(a) depicts the skewed-T shape o f the distribution of reflected light SPDs from a smooth surface, predicted by Klinker, et al, and Figure 2(b) shows the slightly more general skewed-P shaped distribution obtained for rougher
surfaces.
H ighlight
N on -H igh ligh t
s(A.)i(X) s(X)i(X)
(a) (b)
Figure 2 M odels for the shape o f the distributions o f SPD s o f light reflected from a convex body under a single illum ination.
If the surface shape is more complex (i.e., non-convex) and the light source is proximal,
although there is still just one body reflection line, there may be multiple highlight lines or clusters.
Often, as argued for example by Matas, et al, [MMK94], and Zhu and Yuille, [ZY96],
because o f the sparse nature o f data with appreciable surface reflection component, it is reasonable to consider only the body reflection component so that:
L (k,g) = m y(g)s(i)i(X ) . ^2)
With this very simple, unichromatic, reflection model, the reflected light SPD is constrained to
Chapter 2 Colour
2.1.2 Sensor model
A light sensor, or camera, samples the SPD o f the light entering the camera, or image irradiance,
to produce its response. This process is w ell modelled by a spectral integration:
X = J
r(X )L (l)d ^ ,(3)
X
where x is the sensor (greylevel) response and r(X,) is the sensor response function. A
multispectral sensor has a number, n say, o f linearly independent channels, each o f which has a
separate response function, ri(A,), where i = l ... n, giving rise to a separate response
Xi = Jrj(X)L(A.)dA.. (4)
A.
For colour sensors, n is usually 3, with the three sensor response functions having peaks in the
red, green and blue parts o f the visible spectrum. This gives rise to three separate measurements,
loosely corresponding to the amounts of red, green and blue light contained in the input signal.
A substitution into (4) can be made from equation (1) to give
X j = m , (g )j r; ( X y ( X ) d X + m^ (g )jq { X ) s { X } { X ) d X. (5)
X X
The scalar geometric factors ms(g) and nib(g) are assumed to be independent o f wavelength, X, and therefore are the same for each channel. The separate grey level response values, Xi, are
grouped into a response vector, x, at each location in the image grid. It is easily verified, see
[Sha82], that equation (4) describes a linear transformation between the infinite dimensional
SPD space and the n-dimensional response space. This linearity ensures that, assuming the
DRM, the distributions o f data found in the response space, like distributions of reflected light
SPDs, are also planar and are parametrised by response vectors corresponding to pure body and
surface reflected light. For this to be true, it must also be assumed that the camera itself is linear
in terms o f the mapping it makes from the incoming light intensity to the image intensity, which
has been shown empirically, by Beyer, [Bey92], to be a reasonable approximation for CCD
cameras. From (5) it can be seen that as the scene geometry varies, the response vector, x, is
constrained to m ove in the positive quadrant o f a plane that passes through the origin and is
parametrised by the vectors
(6)
j T i { X } { X ) d X |q(X)s(X)i(A,)d>.
X® = and x^ =
U
J
j r n ( X X X } { X ) d X
U
J
Thus, from (5) and (6),
The sensor response is therefore also constrained to lie in the positive subset o f a plane. When
there is no surface reflection component, as in the unichromatic model o f equation (2), x is
constrained to just the Une passing through the origin in the direction of x’’. Although the actual
colour of body reflected light is not fixed as its intensity may vary arbitrarily, the direction o f x*’
is fixed. This direction depends only on shape o f the surface reflectance and illumination SPDs,
and so is fixed for a surface with constant surface reflectance under a fixed illumination.
Moreover, responses that he on the same line, if the effects of sensor noise are ignored for now,
can only have arisen from surface patches with the same chromatic properties (i.e., a metameric
surface reflectance SPD). Lines radiating from the origin o f the sensor response space may
therefore be considered to be chromaticity equivalence classes and the chromatic properties of a
surface under a fixed illumination be characterised by a unit vector x in the direction o f x.
When there is a surface reflection component, the response from a single surface patch
is no longer restricted to a line. However, as discussed in the previous section, assumptions
about the imaging conditions can further constrain the range over which the sensor response can
vary. In such situations, again by linearity o f the transformation made by the sensor, the
distributions o f colour sensor data corresponding to a single surface take on the skewed-T or
skewed-P shapes shown in Figure 2. Examples o f distributions o f colour data taken from real
images that exhibit these shapes can be found in [KH93] and [BLL96].
2.1.3 Modelling my and nis
Lambert’s law states that the intensity o f the light incident on a point of a surface is related to
the intensity o f the illumination by the cosine o f the angle o f incidence o f the illumination on
the surface, 0 in Figure 1. Using this simple geometric statement, a common model, used for
exam ple by Novak and Shafer, [NS94], for the body reflection coefficient, my o f equation (1), is
given by
m y = C c o s ( 0 ) , (8)
where C is a constant. This model makes the additional assumption that the intensity of the
scene radiance is directly proportional to that of the light incident on the surface and so does not
depend on viewing direction. If the shape o f a surface is known then restrictions on the
distribution o f 0 can be inferred and, assuming the model for my given by (8), this can allow
further restrictions on the expected distribution o f colour data to be placed.
Although appealing because o f its simplicity, this model for my can be inaccurate,
particularly when illumination and/or viewing directions are close to grazing, because o f surface
roughness causing local vignetting. Vignetting is the masking effect caused by surface points
being shadowed by other points o f the same surface and it affects both the intensity o f the
Chapter 2 Colour
Koenderink and Van Doom , [KV96] discuss these effects in detail, W olff, [W ol96], contests the
sim ple model given by (8) even for smooth objects for which vignetting effects are minimal. He
shows from first physical principles that the inherent assumption in (8) that the intensity o f body
reflected light is independent of viewing direction does not hold in general. An alternative, but
more com plex, model is derived which is shown to correspond more closely to observed data.
The difference in the models however occurs mainly when the angle of incidence with respect
to the view ing direction is large and W olff suggests that when this angle is less than about 50°,
(8) is a reasonably accurate model.
Various models for the surface reflection coefficient, mg, also exist in the literature. A
com monly used model in computer graphics, which produces realistic looking highlights but is
not based on any real physical model, is that o f Phong, see [FVF90]. A significantly more
com plex model, derived from basic physical principles and a surface model incorporating
roughness and local vignetting, is proposed by Torrance and Sparrow, [TS67]. They show that
their model predicts the observed phenomenon o f off-specular peaks in scene radiance when
view ing and illumination angles are close to grazing.
2.1.4 Applicability of Reflection Models
The DRM is designed for inhomogeneous dielectric materials. Homogeneous materials, like
metals and crystals, do not exhibit body reflection; surface reflection dominates for these
materials. This surface reflection may be diffuse if the surface is rough and may also be tinged
with the intrinsic colour o f the material. Although the NIR assumption may be violated for these
materials, as long as the shape of the SPD o f the reflected light does not change with the
view ing and illumination geometries, the chromatic properties are constant and so a
unichromatic reflection model still applies. A model, such as that expressed by equation (2) can
be used when there is a single illuminant, as the distribution of sensor responses is one
dimensional. Healey, [Hea88], shows empirically that a unichromatic reflection model fits real
data obtained from a number o f both coloured, e.g., copper and gold, and white, e.g., aluminium
and silver, metals.
Other materials can exhibit body reflection but still tinge surface reflected hght. Again,
the dichromatic model still applies but the NIR assumption does not and equation (2) is still
valid in the absence o f a significant surface reflection component. Translucent and/or luminous
materials are not modelled w ell by the dichromatic model, however, as there are additional
components to the scene radiance. Klinker, [Kli93], provides some further discussion o f the
range o f different types of material in terms of reflection properties.
Tominaga and Wandell, [TW89, Tom91], and Lee, et al, [LBS90], performed empirical
studies to show that the DRM, with NIR, provides a good approximation to the reflective