Mayank D. Patel et al., IJSRR 2019, 8(2), 1426-1436
IJSRR, 8(2) April. – June., 2019 Page 1426
Research article Available online www.ijsrr.org
ISSN: 2279–0543
International Journal of Scientific Research and Reviews
“Implementation of Taguchi Method and ANOVA analysis for
optimization of machining process”
Mayank D. Patel
1*and Gajanan Shankarro Patange
21*
PG Student, Mechanical Engineering, C. S. Patel Institute of Technology, CHARUSAT, Anand, Gujarat, India, [email protected]
2
Department of Mechanical Engineering, C. S. Patel Institute of Technology, CHARUSAT, Anand, Gujarat, India Email: [email protected]
ABSTRACT
In present condition in precise component manufacturing organization, quality and cost of
product play a vital role. Reduction of cost in mass production can be done by minimization of
waste. The higher production rate can be achieved with the help of process parameter optimization.
In this paper, the Taguchi method is used to get the optimal value of depth of cut, spindle speed, feed
rate. To conduct experiment universal machining center (UMC) was used. The material selected was
aluminum (Al) – 6061. From the ANOVA analysis, it was found that the most favorable combination
has been established.
KEYWORDS:
ANOVA analysis, Taguchi Method, CNC milling, Cutting Parameters, MRR, Aluminum.*Corresponding author:
Mayank D. Patel
PG Student, Mechanical Engineering,
C. S. Patel Institute of Technology,
CHARUSAT, Anand, Gujarat, India,
Mayank D. Patel et al., IJSRR 2019, 8(2), 1426-1436
IJSRR, 8(2) April. – June., 2019 Page 1427
1] INTRODUCTION
The conventional machines are taking higher timing to make one or many components and as
well as needs one man for supervision. As a result, the product produced both expensive and
qualitative, depending on the expertise of that machine. This is not possible in those competitive
climates. The challenging things of current machine industry are mainly focusing on the highest
achievable quality in the terms of, higher production rate, the accuracy of the workpiece, surface
finish factor, etc. But the main two contradictory criteria are Quality and productivity in all
machining operations. To ensure high productivity, the quality level must be compromised. The
Surface roughness and the material of metal removal rate (MRR) play an excellent role in more than
one area. UMC machine is capable of achieving the desired milling operation by higher accuracy and
as well as having very low process timing. The CNC machine is many mathematical models
described by some researchers have been formulated based on statistical regression for proper
selection of cutting parameters and cutting performance in milling operations. This method is used
for the new approach to finding out the best cutting parameters more competently. This research has
selected three main parameters including rate of feed, speed of cutting and deepness of cut for the
optimize the MRR during milling processes, which further can be assess by the cost of the
manufactured product, productivity or some other criterion 1, 2, 3, 4.
2] LITERATURE REVIEW
Following literature is related to defined problem.
1] The Taguchi design of experiment can be used efficiently in the cumulation of machining
specification in the turning process. The significant factors concluded that the effect of feed rate as
well as cutting speed is more on the quality characteristic. The depth of the cut parameter has more
effect on the machining process that led to maximum surface roughness followed by cutting speed.
The analysis has demonstrated that Taguchi parameter design can, fortunately, justify the optimum
cutting specification. This experiment has been carried out for the smaller better Taguchi approach.
After analysis, it results to know about LM4 machining characteristics and its scope in the industries.
(Ankit Kumar Saxena, et. Al 5)
2] The Surface roughness is mainly affected by feed rate, depth off cut and spindle speed. If feed rate
value will be increased then the surface roughness value is also increasing, as the value of depth of
cut increases the value of roughness is firstly increased then after it will decrease and as the value of
spindle speed increased thus the value of surface roughness is decreased. From ANOVA analysis,
the new result that effect of this paramere is not affected as surface roughness value effect. The
Mayank D. Patel et al., IJSRR 2019, 8(2), 1426-1436
IJSRR, 8(2) April. – June., 2019 Page 1428
value of percentage error in those both experimental results as well as in predictable result is 6.83%.
(Narendra Kumar Verma 6)
3] A machine device dynamometer is a multi-part dynamometer that is used to gauge powers amid
the utilization of the machine apparatus. With the advancement of innovation, machine device
dynamometers are progressively utilized for accurate measurement of powers and for enhancement
of the machining procedure parameters. The target of this paper is to represent the methodology
embraced in using Taguchi Method to a machine turning task. The profundity of cut, Spindle speed,
Feed rate, and Tool Material was utilized as the procedure parameters whereas the Cutting power,
Feed power, and Thrust drive are chosen as execution characteristics. The level of influence of each
procedure parameter on individual performance trademark was broke down from the exploratory
outcomes obtained using Taguchi Method with the assistance of Minitab programming. (Mathiselvan
G et. Al.) 7)
4] Taguchi Method is a measurable way to deal with streamline the procedure parameters and
improve the nature of parts that are fabricated. The goal of this investigation is to represent the
system received in utilizing the Taguchi Method to a machine confronting task. The symmetrical
cluster, motion to-clamor proportion, and the investigation of fluctuation are utilized to consider the
execution qualities on confronting task. In this examination, three factors in particular speed; feed
and profundity of cut were considered. Appropriately, a reasonable symmetrical exhibit was chosen
and tests were led. In the wake of directing the trials the surface harshness was estimated and Signal
to Noise proportion was determined. With the assistance of charts, ideal parameter esteems were
gotten and the affirmation tests were done. These outcomes were contrasted and the consequences of
full factorial strategy. ( Srinivas Athreya et Al.8)
5] Plan of Experiment (DOE) is one of the widely utilized strategies for test investigation of many
assembling forms in the building. DOE is a factual methodology in which a numerical model is
created through exploratory runs. Hence, conceivable yield can be anticipated dependent on the
information parameters of the trial setup. The present examination audits current writing on DOE
procedures that have been utilized for different welding forms with specific accentuation on the
utilization of Taguchi technique on combination circular segment welding forms to be specific, gas
tungsten curve welding and plasma bend welding. ( S. P. Kondapalli et. Al.) 9)
6] In this paper the cutting of Inconel 718 material utilizing machine by Taguchi approaches.
Taguchi advancement approach is connected to advance cutting parameters in turning Inconel 718
material with carbide tipped instrument under dry conditions. The machine is utilized to lead tests
Mayank D. Patel et al., IJSRR 2019, 8(2), 1426-1436
IJSRR, 8(2) April. – June., 2019 Page 1429
symmetrical cluster flag to commotion proportion (S/N) and examination of fluctuation was utilized
to locate the base surface unpleasantness. Ideal outcomes are at long last confirmed with the
assistance of compliance tests. ( J.Chandrasheker) 10)
7] The improvement of surface unpleasantness in the turning of AISI 1045 was explored by utilizing
parameters as cutting rate, feed rate, and profundity of cut. These parameters are most in charge of
surface harshness and their working extent is set. Taguchi technique is utilized to gather the
exploratory information. Asymmetrical plan L-9, a flag to clamor proportion and investigation of
fluctuation were utilized to improve surface unpleasantness. Feed rate applied the higher impact on
surface harshness, observed by the profundity of cut. The surface harshness increments with
expanding feed rate, the profundity of cut and reduction with diminishing cutting velocity.
(Mohammed Irfaan et. Al.) 11)
3] PROBLEM DEFINITION AND OBJECTIVES
Problem definition
Process improvements through gradual reduction in the production time by a minimum of
10-20%
Objectives
1. At the corporate level, the goal is to improving customer satisfaction by meeting their
demands without adjusting quality.
2. To reduce waste.
3. Optimize the use of the technique.
4. Uses of the method of design of experiment.
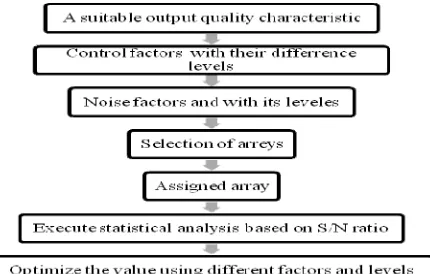
4] METHODOLOGY
Taguchi method has been used for a parameter design including these following steps:
Mayank D. Patel et al., IJSRR 2019, 8(2), 1426-1436
IJSRR, 8(2) April. – June., 2019 Page 1430
4.1 Performance Characteristic
Fundamentally, the performance characteristic in the analysis has been divided into main
three categories, namely 1) The nominal - the - better, 2) The smaller - the - better and 3) The higher
- the - better. According to S/N analysis, the S/N ratio has been calculated for individual level of
operation criterions. Moreover, the statistical analysis of ANOVA is defined to recognize process
parameter which is more remarkable. Taguchi method is also used for regulating the deviation
caused by the intractable factors, which are not included in the conventional design of experiment.
The number of controllable milling parameters during the experiment is based on the orthogonal
array, which evaluates the data and finally identifies the optimal condition. S/N ratio described as a
preferred signal ratio for the unwanted random noise. A large rate of S/N ratio means the signal is
enough superior to the unplanned reaction of noise aspect. The three divisions of quality tendency
during the analysis of S/N ratio are 12, 13:
1. Nominal – the – better (NB): The value is more appropriate when it's near to target.
2. Lower – the – better (LB): The predicted value includes some defects such as unwanted
allowances, turbulence diameter, etc.
3. Higher – the – better (HB): In this aspect, the output will be desire as having a higher bond of
two material strength, the value of material removal, etc.
In Taguchi method, an orthogonal array has been designed to compute the main parameters
placed at different rows influence on the result and synergy effects through the merest numbers of
experimental trials. From the above categories the larger – to – the – better is used for the calculation
of the S/ N ratio for mainly material removal rate as according to the below equation:
= − 10 ( ∑ 2)………..………..…...(1) 14
Here, n is no. of trail value during the experiment.
4.2 Details Of Experiment
Here are the experimental details of the given experiments. The material removal rate shows
a meaningful role during the milling operation. The productivity of a product can be increased by
increasing material removel rate (MRR).
Table 1: Practical Details
Details Variable Constants
Machine used: UMC 750 Work-piece material: Al 6061
The density of material: 2700.00 kg/m3
Workpiece Dia: 30 mm Hardness: 23.1 HRC
Speed ( RPM ) Feed ( mm / min ) Depth of cut ( mm )
Workpiece: Al Cutting condition
Mayank D. Patel et al., IJSRR 2019, 8(2), 1426-1436
IJSRR, 8(2) April. – June., 2019 Page 1431
4.3 Selection Based on the Cutting Parameters and Their Levels
The milling experiment has been done on steel material on the UMC 750 machine. The
initial cutting parametershave been taken in an experiment as 1000 RPM cutting speed, 150 mm/min
feed and 0.5 mm depth of cut. The parameters and their levels of this experiment are displayed in
Table 2.
Table 2: Cutting Parameters with there levels Details of
parameter
Indication Unit Level I Level II Level III
Feed rate A (mm / min) 150 200 250
Depth offcut B (RPM) 0.5 1.0 1.5
Cutting speed C (mm) 1000 1500 2000
4.4 Orthogonal Array Experiment
The degree of freedom can be formalized by measuring between the process parameters to
be completed to find out which level is better from others and how much it is. For example, consider
that the 3-level process paramere having two degrees of freedom. So the combination of the two
process parameter is to be interacted and regulated by the multification of that 2 processes. In this
paper, the reciprocal action between two process parameters has been undervalued. After we get a
degree of freedom and our next step would be the selection of perfect orthogonal for the perfect task.
Normally, the value of degrees of freedom is always more than process parameter and it may be
more than that value. In this, an L9 orthogonal array has been used to handle this three process
parameter having six degrees of freedom (DOF = 3 × (3-1) = 6). The column is a cutting parameter,
so the available value of the cutting parameter is 9. So, Using L9 orthogonal array we get will study
only 9 practical 15, 16.
4.5 Analysis Of The Signal-To-Noise (S/N) Ratio
The S/N ratio is called the ratio of mean value to value of standard deviation. In Taguchi
method, S/N ratio is used for the measurement of quality of the characteristic differing from the
desired output. Machining time required to reduce the diameter of aluminum from 30 mm to 27 mm
for each experiment has been observed and materials removed has been calculated as 17.58 gm for
each experiment. Before making operation and after machining operation, the MRR value could be
calculated using the below equation.
MRR= W1 – W2 / T * …..………... (2) 17
Where, W1 = weight of initial W.P. (grams)
Mayank D. Patel et al., IJSRR 2019, 8(2), 1426-1436
IJSRR, 8(2) April. – June., 2019 Page 1432
T = maching time during process (sec)
= density (grams / mm3)
Table 3 shows the experimental results for MRR is calculated using Eq. (2) and of S/N ratio
is calculated using MINITAB.
Table 3: Experimental results of MRR and S/N ratio
Ex. No.
Spindle speed (rpm)
Feed rate(mm/mi
n)
Depth of cut (mm)
Cycle time for removing material (sec)
MRR
(gm/min) S / n ratio (DB)
1 1000 150 0.5 310 17.9713 28.0873
2 1000 200 1.0 105 15.8130 26.8932
3 1000 250 1.5 85 19.5321 28.6018
4 1500 150 1.0 143 10.2341 23.1891
5 1500 200 1.5 75 25.3051 30.6062
6 1500 250 0.5 125 12.5132 24.9144
7 2000 150 1.5 155 9.781 22.8007
8 2000 200 0.5 135 13.3011 25.4461
9 2000 250 1.0 165 15.2343 26.6299
The total avg S/N ratio = 26.3521 dB
After calculating S/N ratio, the sum of S/N ratio for cutting speed at different levels I, II, and
III could be calculated with help of by adding S/N ratio for given slot 1 – 3, 4 – 6, and 7 – 9. So, all
value can be calculated in this similar manner. Then the average S /N ratio for all cutting speed at
all levels I, II, and III could be calculated with avg. of S/N ratios for given experiments 1 - 3, 4 - 6,
and 7 - 9, which are denoted by MS1, MS2, and MS3. MS1 is given by 18.
MS1 = ∑ ratio for the first level of speed (rpm) = (26.0873+26.8932+28.6018)/3 = 27.86 dB
Similarly, the MS2 and MS3 are calculated and as shown in the below table. MF1, MF2, MF3
and MD1, MD2, MD3 are the ave. of S/N ratio for all factor as shown in the table, for three levels I,
II and III. The mean value of S/N ratio for all level of cutting parameters is calculated and presented
in Table 4.
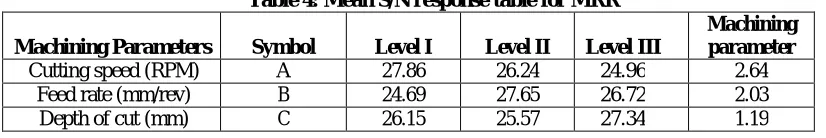
Table 4: Mean S/N response table for MRR
Machining Parameters Symbol Level I Level II Level III
Machining parameter
Cutting speed (RPM) A 27.86 26.24 24.96 2.64
Feed rate (mm/rev) B 24.69 27.65 26.72 2.03
Mayank D. Patel et al., IJSRR 2019, 8(2), 1426-1436
IJSRR, 8(2) April. – June., 2019 Page 1433
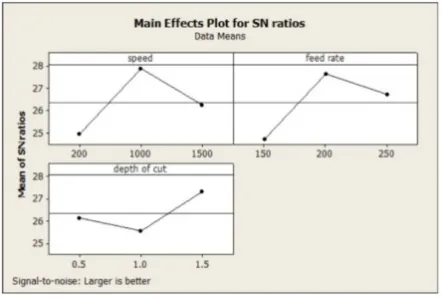
Figure 2 shows the mean S/N ratio corresponds to each level for MRR. From Table 4 and
Figure 2 we found that the highest combination of S/N ratio for highest MRR, MS2 - MF2 - MD2 is
the perfect combination, which is the suitable combination levels for the factors in milling
operation.
Figure 2: Main effects plot for SN ratio
5] DATA ANALYSIS AND DISCUSSION
The Process can glow by producing higher precisions and lower costing products. To
achieve this level, a experiments have been conducted for optimization process, machining
performance and surface roughness. S/N ratio has been calculated based on the MRR for each
experimental work.
Machining time required to reduce the diameter of steel from 30 mm to 27 mm for each
experimental run has been observed and MRR has been calculated. The experimental results can be
analyzed by computing the analysis of variance (ANOVA) table.
5.1 Analysis of Variance (Anova) for Mrr
The main purpose of the ANOVA process parameter has more impacts on performance
characteristic. Now, the total sum of the squared deviations (SST) calculated from equation 3.
m = ∑ ratio = (26.0873+26.8932+28.6018+23.1891+30.6062+24.9144+22.8007+25.4461+26.3299)/9 =
26.3521 dB
n
SST = ∑ (i - m) 2 ……….... (3) 19
i=1
Here, n = number of experiment
Mayank D. Patel et al., IJSRR 2019, 8(2), 1426-1436
IJSRR, 8(2) April. – June., 2019 Page 1434
The summation of square deviations of SST is divided into two parts: 1) the summation of the
square deviations SSD and 2) the summation of the square (error) SSE. The degrees of freedom =
no. of experiment - 1 = 9 – 1 = 8, and here degree of freedom for each factor = 3 – 1 = 2. Then,
F-value for each parameter has been computed by dividing the mean of one square deviation the mean
of square error.
k _
SSD = ∑ j (xj - m )
……….………(4)19
j=1
SSE = SST – SSS – SSF – SSD ………..……...
(5)19
Statically, there is a tool name F-test to evaluate which process parameters had a significant
role the performance characteristic has been used. F-test can be performed by computing the mean
of squared deviations SSD and then calculating the mean of squared deviation (MS) by dividing
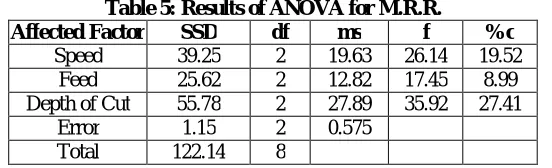
SSD/ degrees of freedom. Then F - value for each can be calculated as SSD/SSE. Table 5, Shows the
results of ANOVA analysis for MRR. The F-value and % C for feed rate is more in the table, which
indicates the feed rate is the most significant contribution to the performance of the machining
process.
Table 5: Results of ANOVA for M.R.R.
Affected Factor SSD df ms f %c
Speed 39.25 2 19.63 26.14 19.52
Feed 25.62 2 12.82 17.45 8.99
Depth of Cut 55.78 2 27.89 35.92 27.41
Error 1.15 2 0.575
Total 122.14 8
From table 3 and 5 it is clear that the optimal value is as bellows 1. Cutting speed: 1500
RPM, 2. Depth of cut: 1.5 mm and 3. Feed 200 mm/min for 2 micron tollerence. and F-test shows
that the depth of cut has the most significant factor than cutting speed.
7] RESULT IMPLICATION
This approch is benifical for used in precise manufacturing company products parts which
need high tolerence.
8] LIMITATION
The study was done for only three parameters, but it can be more than three parameters such
Mayank D. Patel et al., IJSRR 2019, 8(2), 1426-1436
IJSRR, 8(2) April. – June., 2019 Page 1435
9] FUTURE SCOPE
In this study, the Taguchi method was used but another similar method can also be used
such as full factorial method.
10] CONCLUSIONS
The paper identified the feasibility of processing on alluminum (Al) 6061 with titanium
carbide tool. For this, the Taguchi method and ANOVA analysis to get the optimum value of Metal
Removal Rate (MRR) in CNC milling. By, conductive experiment it is found that depth of cut was
most segnificant factor compare to feed rate.
Combinations established in this paper are suitable for higher tolerance of 2 micron.
11] REFERANCE
1. Taguchi G., Choudhary S., Wu Y. Taguchi’s Quality Engineering Handbook, John Wiley &
Sons Inc., New Jersey 2005.
2. Sanjit moshat, Saurav Data, Ashish Bandopaddhayay, Pradip kumar Pal. “Optimization of
CNC milling process parameters using PCA based Taguchi Method”, International Journal
of Engineering Science and Technology, 2010; 2(1): 92 – 102.
3. Yang W.H., Tarng Y.S. “Design optimization of cutting parameters for turning operations
based on the Taguchi method”, Journal of Materials Processing Technology, 1988; 84:
122-129.
4. Kadirgama K., Noor M.M., Rahman M.M., Rejab M.R.M., Haron C.H.C., Abou-EI-Hossein
K.A., “Surface Roughness Prediction Model of 6061-T6 Aluminum Alloy Machining Using
Statistical Method”, European Journal of Scientific Research 2009;25(2):250-256.
5. Alagarsamy, S. V., et al."Optimization of Machining Parameters for Turning of Aluminium
Alloy 5 Using Taguchi Method." International Research Journal of Engineering and
Technology 2016; 3(1): 316-322.
6. Verma, Narendra Kumar, and Ajeet Singh Sikarwar. "Optimizing Turning Process by
Taguchi Method Under Various Machining Parameters." International Research Journal of
Engineering and Technology 2015; 2(6): 307-312.
7. Lin, C. L. Use of the Taguchi method and grey relational analysis to optimize turning
operations with multiple performance characteristics. Materials and manufacturing
Mayank D. Patel et al., IJSRR 2019, 8(2), 1426-1436
IJSRR, 8(2) April. – June., 2019 Page 1436
8. Athreya, S., & Venkatesh, Y. D. Application of Taguchi method for optimization of process
parameters in improving the surface roughness of lathe facing operation. International
Refereed Journal of Engineering and Science, 2012;1(3): 13-19.
9. Kondapalli, S. P., Chalamalasetti, S. R., & Damera, N. R. Application of Taguchi based
design of experiments to fusion arc weld processes: A review. International Journal of
Business Research and Development, 2013; 4(3).
10.Awale, A. S., & Inamdar, K. H. Review on High speed machining of hard material. Int J
Emerg Technol Innovative Res 2015;2(3): 517-524.
11.Irfaan, M., Temesgen, A. D., & Tsegay, M. M. Application of Taguchi Method & Anova in
turning of AISI 1045 to improve surface roughness by Optimize cutting factor. Carbon, 100,
0-43.
12.Ahmet Murat Pinar, “Optimization of Process Parameters with Minimum Surface
Roughness in the Pocket Machining of AA5083 Aluminum Alloy via Taguchi Method”,
Arabian Journal for Science and Engineering 2013;38(3): 705-714.
13.Lok Y.K., Lee T.C., Processing of advanced ceramics using the wire-cut EDM process, J.
Mater. Process. Technology 1997; 63(1-3): 839-843.
14.Ross P.J. Taguchi Techniques for Quality Engineering, McGraw Hill Publishers, New York,
1988.
15.S. Thamizhmanii, S. Hasan, Analyses of roughness, forces and wear in turning gray cast
iron, Journal of Achievements in Materials and Manufacturing Engineering, July-August
2006; 17(1-2): 401-404.
16.Mustafa Kurt, EyupBagci and Yusuf Kaynak Application of Taguchi methods in the
optimization of cutting parameters for surface finish and hole diameter accuracy in dry
drilling processes," International J. Advanced Manufacturing Technology, 2009;40:458-469.
17.Sujit Kumar Jha, “Optimization of Process Parameters for optimal MRR during Turning
Steel bar using Taguchi Method and ANOVA”, International Journal of Mechanical
Engineering and Robotics Research 2014; 3(2): 231 – 243.
18.Abuelnaga A.M., EI-Dardiry M.A., “Optimization methods for metal cutting”, International
Journal of Machine Tool Design and Research 1984; 24(1): 11-18.
19.T. Sreenivasa Murthy, R.K.Suresh, G. Krishnaiah, V. Diwakar Reddy, Optimization Of
Process Parameters In Dry Turning Operation Of EN 41B Alloy Steels With Cermet Tool
Based On The Taguchi Method, International Journal of Engineering Research and