Vol. 3 Issue 7, July - 2017
Computer Aided Modeling For The Sequential
Development Of A Small Scale Palm Oil
Production Plant Using Re-Investment Method
*1Imoukhuede, K. A., 2Kareem B. and 2Adeyeri, M. K.
1Department of Mechanical Engineering Technology, Rufus Giwa Polytechnic Owo, Ondo State,
Nigeria.
2Department of Mechanical Engineering Technology. Federal University of Technology, Akure, Ondo
State, Nigeria.
*Email: [email protected]
Abstract—There are several reasons for the sequential development of a model in a palm oil industry using re-investment method. This research points up the justification and discusses the qualitative and quantitative techniques involved in the formulation of sequential model for a small scale palm oil production firm using re-investment method by considering the profit for the previous year, loan from bank, loan from Government, and loan from cooperative society. In Computer program (C++) was developed for the model to accommodate large data and analysis of complex-mixed model system where loans were introduced and allowed.
Araromi Obu palm oil mill, Hartman Palm oil mill and Fashanu oil mill in Ondo State were visited and data were collected to test the developed model.
Computer software for rapid implementation of the model for the sequential procurement of palm oil production facilities based on the expected capacity was developed. The results obtained shows that with the introduction of the loan from the Government, Bank and Cooperative Society, the expected capacity or demand were met in different periods respectively.
Keywords—Industry, model, palm-oil, re-investment, small-scale
I. INTRODUCTION
Manufacturing has always been the key to success among nations in the world economy. A responsive manufacturing system working in harmony with the rest of an enterprise has a major impact on its competitiveness; it plays a vital role in the successful introduction of new products or continuous improvement of existing products in response to demands of the market. According to Sharma [1], manufacturing is said to consist of a
series of interrelated activities and operations involving design, material selection, and quality assurance. Ogunkoya and Aderoba [2] defined small industrial units as industries with limited scale manufacturing operations, producing a product or few products with limited level of employment and investment. Reviewed literature also revealed that small-scale farmers dominate the oil palm industry in most West African countries. In Nigeria, over 70% of the annual production of palm oil are produced by small-scale processors [3,4,5].
The process of converting the verbal description and numerical data into mathematical expressions which capture the relevant relationships, goals and restrictions is known as modeling, and the resulting mathematical description is called model [6]. The study and analysis of physical processes (including most industrial process systems) have geared many researchers [7, 8, 9, 10, 11] towards model development in various areas of engineering field. It is worthwhile to report that such models have been found to give a very good representation of the various stochastic and deterministic conditions of the process/system been modeled.
to marketing to financing decisions, which will help in the development of the model. The decisions also involve material plant facilities, the in-house capabilities of company personnel and the effective use of capital assets such as buildings and machinery. The major task is the plan for the acquisition of equipment (fixed asset) that will enable the firm to produce products economically, and engineering economic decision involves the investment, which is usually made in a lump sum at the beginning of the project, and there is a stream of cash benefits that are expected to result from the investment over a period of future years.
In such a fixed asset investment, funds are committed in the expectation of earning a return in the future. In the case of a bank loan, the future returns takes the form of interest plus repayment of the principal which is known as the loan cash flow but in the case of the fixed asset, the future returns takes the form of cash generated by productive use of the asset. The representation of these future earnings along with the capital expenditures and annual expenses (such as wages, raw materials, operating costs, maintenance costs and income taxes) is the project cash flow. Businesses from time to time need to make substantial investments in plant, equipment or buildings. It is often the case that the returns from the new investment will be small relative to the size of the investment, such that several years may elapse before the returns can repay the investment. Thus, the knowledge of percentage returns on investment is essential to determine the most effective use of capital. Therefore a model was developed for sequential development of palm oil industry using re-investment method for a middle-scale production firm for sequential procurement of palm oil production based on the expected capacity or demand.
II. RESEARCH METHODOLOGY
This research work involve the use of a local palm oil production firm to formulate a model. From the perspective of palm oil production, the processes involved are purchasing of raw material (bunch reception), threshing (removal of fruits from the bunches), sterilization, digestion, pressing, clarification and storage. Though as technology advances, some of the processes and machines used are being modified. All these modifications were dealt with in the model
formulation of a palm oil production industry in a developing economy.
When considering the operation of the plant over a periods of time. It is expected that prices and demand of palm oil in various markets would fluctuate over the planning horizon. These fluctuations along with other factors such as new environmental regulations or technology obsolescence might necessitate the decrease or complete elimination of the production of some palm oil, while requiring an increase or introduction of others. Thus, there may be some additional new decisions variables such as capacity expansion of existing processes, installation of new processes, and shutdown of existing processes. Moreover, owing to the broadening of the planning horizon, the effect of discount factors and interest rates will become prominent in the cost and price functions, and thus the planning objective is clear to maximize the net present value instead of the short term profit or revenue.
A. Model Formulation
Looking at the problem in this assumption that is given .
Assuming a given network of processes and palm oil, and characterization of future demands and prices of the palm oil, operating and installation costs of the existing as well as potential new processes, An operational and capacity planning policy that would maximize the net present value can be found.
Indices
i = The set of number of processes (NP) that constitutes the network,
(i = 1--- NP).
j = The set of number of palm oil (NO) that interconnects the processes,
(j = 1 --- NO)
L = The set of number of markets (NM) that are involved
(L = 1 --- NM).
t = The set of number of time periods (NT) of the planning horizon.
(t = 1 --- NT).
m = The set number of machines being maintained (MM)
Vol. 3 Issue 7, July - 2017 K = The set number of raw material (RM) for the
process
(k = --- RM)
Notations
CMI = cost of machine introduced/installed CL = Cost of layout
CM = Cost of manpower
COM = Cost of operating machines CMM = Cost of maintaining machines COP = Cost of packaging
COT = Cost of transportation NLS = Number of litre sold CPL = Cost per litre
VOP = Volume of product produced NPV = Net present value
INVT = Cost of investment
OPER = Cost model for the operation SAL = SALES
PURC= Purchase made
COL = Cost of having layout => fixed
COR = Cost of raw
material.
NOTE:- CPL :- cost per litre varies depending on the demand
Variables
Eit = units of expansion of process i at the beginning of period t.
Pjlt = units of palm oil j purchased from market i at the beginning of period t.
Qit = total capacity of process i in period t. The capacity of a process is expressed in terms of its main product.
Sjlt = units of palm oil j sold to market l at the end of period t.
Wit = operating level of process i in period t expressed in terms of output of its main product.
Functions
INVTit (Eit) :- The investment model for process i in period t as a function of the capacity installed or expanded.
OPERit (Wit) :- The cost model for the operation of process i over period t as a function of the operating level.
SALEjlt (sjlt) :- The sales price model for palm oil j in market l in period t as a function of the sales quatity.
PURCjlt (Pjlt) :- The purchase price model for palm oil j in market l in period t as a function of the purchase quantity.
B. Development of the Profit Model
The basic relationship between profit, revenue and cost of any product is as stated below:- Profit (Loss) = Revenue – Cost
OR
t=NTt =NTNP NPNPV = SAL - PUR -
[INVTit] Eit- [OPERit]
t=1t = 1 i = 1 i = 1
where
NMNMNT
INVT = CMI + COL + CM
i=1i=1t=1
Eit = Fixed which is determined by the output rate. NMNMNP
OPERit = COM + CMM + COP + COT i=1i=1P =1
RM
PURC = COR + Transport
K =1
NT
SAL = NLS x CPL
t =1
Where
Eit = Units of expansion of process I at the beginning of period t.
CMI = Cost of machine
introduced/installed
CL = Cost of layout CM = Cost of manpower
COM = Cost of operating machines CMM = Cost of maintaining machines COP = Cost of packaging
COT = Cost of transportation NLS = Number of litre sold CPL = Cost per litre
VOP = Volume of product produced NPV = Net present value
INVT = Cost of investment
OPER = Cost model for the operation SAL = SALES
PURC = Purchase made
COL = Cost of having layout => fixed COR = Cost of raw material.
C. Algorithm of Profit Reinvestment
This model is now subject to the following conditions.
Assumption:- As new machine comes in, to determine reinvestment for the following machine, it i assumed that it is no more having a re-occurrence.
INVT = (CMI, COL, CM) is subject to the following constraints:-
GOL = Government loan PPY = Profit of previous year LFB = Loan from bank
LFC = Loan from cooperative society SFF = Sharing formula of factors of funding
SFF = f (% PPY; LFB; GOL; LFC) = 1 SFF = %( PPY; LFB;GOL; LFC) = 1 CMI = ( % (PPY, LFB, GOL, LFC) Let PPY = P = % profit of previous year P + 1 = % (PPY + GOL)
P + 2 = % (PPY + GOL + LFB)
P + 3 = % (PPY + GOL + LFB + LFC) With these notations
CMI, Cost of machine introduced
% (PPY + GOL + LFB + LFC). AS IN
10 IF CMI < P, then re-invest for that year
with P.
20 IF CMI > P (message: Do you still want to continue in re-investment). 30 Next P + 1
40 IF CMI > P + 1 50 Next P + 2 60 IF CMI > P + 2
Next P + 3
70 Checkbox will be introduced CHECKBOX Compare CMIp+1 with VOP Q Litres
VOP = Volume of products Qlitres = Quantity to be produced 80 IF @ P + 1, VOP Q litres
Go To 50 ELSE 110 90 Next P
100 Go To 80 ELSE 110 110 STOP
For condition PPY = P Profit of previous year. This is subject to the following model
Let i = interest rate t = time (no of years) = n
b = amount (principal) when t = 1 then it implies b = Xt = 1 = b ……… (1)
2nd year t = 2 Xt = 2 = b + bi …... (2)
3rd year, when t = 3
Xt = 3 = b (1 + i) + i [ b(1+ i)] …(3) = b (1 + i) (1 + i) = b (1+ i)2
t1 = b (1+ i)
t2 = b (1+ i)2
t3 = b (1+ i)3
t4 = b (1+ i)4
t5 = b (1+ i)5 ……. (4)
Therefore,
tn F= b (1+ i)n …… (5)
On a general note the general formula is X1 = L + PPY …… (6)
Where
X1 = amount to be
invested
L = Loan
PPY = Profit of the previous year including interest generated in the bank.
The Loan can be categorize into three Which are (i) Government loan (ii) Loan from bank
(iii)Loan from individual (cooperative society).
D. Loan Modeling
The model for the loan will be same but the interest rate will differ.
The model for the loan is deduced below
Amount given At n=1 is
𝑎 =𝐿𝑅
𝑁 + 𝐿 = 𝐿( 𝑅
𝑁+ 1) …… (7)
Amount given at n=2 will be
𝑏 = ⌈(𝐿𝑅
𝑁 + 𝐿) 𝑅 𝑁⌉ + (
𝐿𝑅
𝑁 + 𝐿)…(8)
Vol. 3 Issue 7, July - 2017 Amount given at n=3 is
𝑐 =𝑏𝑅
𝑁 + 𝑏 = 𝑏 〈 𝑅
𝑁+ 1〉 ..…(9)
Amount given at n= 4
𝑑 =𝐶𝑅
𝑁 + 𝐶 = 𝐶 〈 𝑅
𝑁+ 1〉…...(10)
Where L = loan, R = Rate, N = No of years
i = interest = LR N
When N = 1
𝑎 = 𝐿 〈𝑅
𝑁+ 1〉
When N = 2
𝑏 =𝐿𝑅
2
𝑁2 +
𝐿𝑅 𝑁 +
𝐿𝑅 𝑁 + 𝐿
𝑏 =𝐿𝑅2
𝑁2 +
2𝐿𝑅
𝑁 + 𝐿 ……...(11)
𝑏 = 𝐿[𝑅2
𝑁2+
2𝑅 𝑁 + 1]
When N = 3
𝐶 = 𝐿 (𝑅2
𝑁2+
2𝑅 𝑁 + 1)
𝑅 𝑁+ 𝐿 (
𝑅2 𝑁2+
2𝑅 𝑁 + 1)
𝐶 =𝐿𝑅3
𝑁3 +
2𝐿𝑅2 𝑁2 +
𝐿𝑅 𝑁 +
𝐿𝑅2 𝑁2 +
2𝐿𝑅
𝑁 + 𝐿 ...(12)
𝐶 = 𝐿 (𝑅
3
𝑁3+
3𝑅2
𝑁2 +
3𝑅 𝑁 + 1)
𝐶 = 𝐿 (𝑅
3
𝑁3+
3𝑅2 𝑁2 +
3𝑅 𝑁 + 1)
When N = 4
𝑑 = 𝐿 (𝑅3
𝑁3+
3𝑅2 𝑁2 +
3𝑅 𝑁 +
1)𝑅
𝑁+ 𝐿 ( 𝑅3 𝑁3+
3𝑅2 𝑁2 +
3𝑅 𝑁 + 1)
𝑑 =𝐿𝑅4
𝑁4 +
4𝐿𝑅3 𝑁3 +
4𝐿𝑅2 𝑁2 +
4𝐿𝑅
𝑁 + 𝐿 ... (13)
𝑑 = 𝐿 (𝑅
4
𝑁4+
4𝑅3 𝑁3 +
4𝑅2 𝑁2 +
4𝑅 𝑁 + 1)
Therefore the amount in Nth year will be
𝑁𝑡ℎ𝑦𝑒𝑎𝑟 = 𝐿 (𝑅𝑛
𝑁 + 𝑁𝑅𝑛−1
𝑁𝑛−1 +
𝑁𝑅𝑛−2 𝑁𝑛−2 +
𝑁𝑅𝑛−3 𝑁𝑛−3 +
⋯𝑁𝑅𝑛−(𝑛−1)
𝑁𝑛−(𝑛−1) + 1)
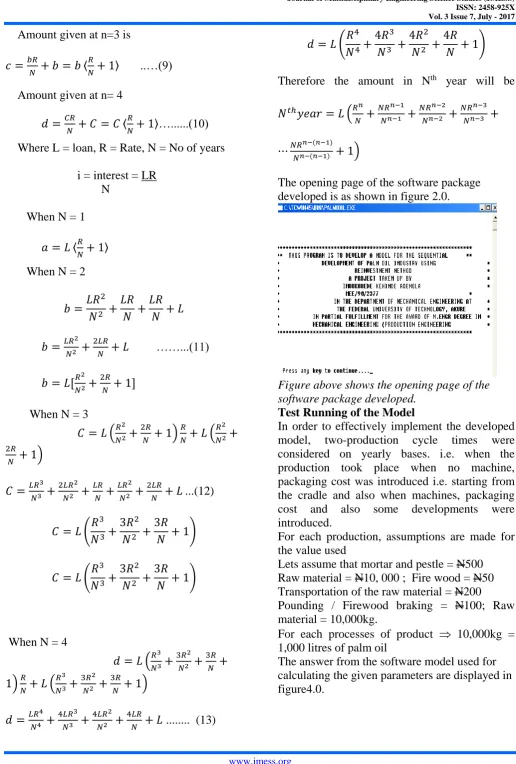
The opening page of the software package developed is as shown in figure 2.0.
Figure above shows the opening page of the software package developed.
Test Running of the Model
In order to effectively implement the developed model, two-production cycle times were considered on yearly bases. i.e. when the production took place when no machine, packaging cost was introduced i.e. starting from the cradle and also when machines, packaging cost and also some developments were introduced.
For each production, assumptions are made for the value used
Lets assume that mortar and pestle = N500 Raw material = N10, 000 ; Fire wood = N50 Transportation of the raw material = N200
Pounding / Firewood braking = N100; Raw material = 10,000kg.
For each processes of product 10,000kg = 1,000 litres of palm oil
Figure above form showing the test model at 1st
year of investment
Figure above form showing the test model at 2nd
year of re-investment
Figure above form showing the test model at 3rd year of re-investment
III. VALIDATION OF THE MODEL
In order to effectively implement the developed model, two-production cycle times were considered on yearly basis. i.e. when the production took place when no machine packaging cost were introduced i.e. starting from the cradle and also when machines, packaging cost and also some developments were introduced. The above sample scenarios were considered using the manual approach and the developed software.
A. Profit Computation using Manual
Approach
Year I
Vol. 3 Issue 7, July - 2017 For each production, assumptions are made for
the value used
Lets assume that mortar and pestle = N500 Raw material = N10,000
Transportation for the raw material = N200 Fire wood = N50
Pounding / Firewood braking = N100 Raw material purchased = 10,000kg.
For each processes of product 10,000kg = 1,000 litres of palm oil
Solution Procedures
NMNM NT
INVT = CMI + COL + CM
i =1 i =1 i =1
CMI = cost of machine introduced/installed = N500
COL = Cost of Layout:- since it is from the cradle there is no layout. COL = 0
CM = Cost of Manpower:- this is the cost used
for the firewood = N150
INVT = N[500 + 0 +150] = N 650 Eit = 0
NM NM NP
OPERit :-COM + CMM + COP +
COT
i =1 i =1 p =1
COM = Cost of Operating Machines:- the cost
used in pounding/breaking the firewood = N200.
CMM:- Cost of Maintaining the Machines:-
since it is from the cradle there is no machine maintenance = 0
COP:- Cost of Packaging:- No packaging
method is introduced from the cradle = 0
COT:- Cost of Transportation = N200. OPER = N (200 + 0 + 0 + 200) = N400.
RM
PURC:-COR + Transport
k=1
COR:- Cost of Raw material = N10,000 Transportation = N200
PURC = N(10,000 + 200) = N10,200
NT
SAL = NLS x CPL
t=1
NLS = Number of litre sold = 800litres were
sold.
(Assumption) out of 1000litres produced from
palm oil.
CPL = Cost per litre:- we assume N50 per litre
i.e. CPL = N50/litre
SAL = [800 X N50] = N40,000
t = NT t = NT NP NP
NPV = SAL- PUR- INVTit]Eit -
[OPER]it
t=1 t=1 i=1 i=1
NPV = (-650 x 0) –400 + 40,000 – 10,200 NPV = N (- 400 + 29,800)
NPV = N 29,400 = GAIN
The following machines will be taken into consideration:
i. Palm fruit extractor ii. Palm kernel press iii. Oil extracting machine iv. Boiler
v. Separating machine/Refinery machine These machines are source locally and the cost of varies depending on the manufacturer. The average cost of each are given below:
i. Palm fruit extractor – N 40,000 ii. Palm kernel press - N 70,000 iii. Oil extraction machine - N 150,000 iv. Boiler - N 75,000
v. Separation machine/Refinenary machine = N 90,000
In the first year the profit made is N 29,400. This profit is not enough to buy any of the available machines. Therefore, the money has to be reinvested.
30% of the (NPV) profit will be used for the maintenance of the process or the industry.
30 XN29,400 100
= N 8820
The remaining profit will be reinvested = N 29,400 - N 8,820
Since CMI cost of machine installation is greater than the profit of the previous year then reinvest by going to (P + 1) which indicate that loan can be collected Government. The Government gives loan to small - k scale industry.
P + 1 = (PPY + GOL)
P + 1 = (Profit of previous year + Government loan)
Let us assume that the Government loan = N 30,000
P + 1 = N (20,580 + N 30,000) P + 1 = N 50,580
Year II
t=NT t=NT NP NP
NPV = SAL-PUR-[INVTit]Eit - [OPERit] t=1 t=1 i=1 i=1
Capital = N 50,580
Mortar and Pestle is been eliminated by the purchase of palm fruit extractor at the rate of N 40,000.
For each production, assumptions are made for
the value used
Palm fruit extraction = N 40,000 Raw material = N 20,000
Transportation for the raw material = N 2,000
Firewood = N 10,000 Firewood breaking = N 500
Cost of operating the machine = N 1000/month
Raw material = 15,000kg
For each processed of product 15,000kg
= 15,000litres of palm oil.
Solution Procedures
NM NM NT
INVT = CMI + COL + CM
i=1 i=1 i=1
CMI = cost of machine
introduced/installed
= N40,000
COL = Cost of Layout:-N5,000
CM = Cost of Manpower:- this is the cost used for the firewood
= N1000/month
= N1000 X 12 =N12,000 per annum
INVT = N[40,000 + 5,000 +12,000] = N 52,000.
Eit = 1
NM NM NP
OPERit :-COM + CMM + COP + COT i=1 i=1 P=1
COM = Cost of Operating Machines = N12,000 the cost used in pounding/breaking the firewood = N500.
= N12,500
CMM:- Cost of Maintaining the Machines:- assumed to
beN200 per month for maintenance = N2,400 COP:- Cost of Packaging:- = N1,000
COT:- Cost of Transportation = N1,000. OPER = N (24,000 + 2,400 + 1,000) = N28,400
RM
PURC = COR + Transport
k=1
COR:- Cost of Raw material = N20,000 Transportation = N2,000
PURC = N(20,000 + 2,000) = N22,000
NT
SAL = NLS x CPL
t=1
NLS = Number of litre sold = 5,000litres were sold. (Assumption) out of 6,500litres produced from palm oil.
CPL = Cost per litre:- we assume N65 per litre
i.e. CPL = N65/litre
SAL = [5000 X N65] = N325,000
t=NT t=NT NPNP NPV=
SAL-PUR-[INVTit]Eit- [OPERit] t=1 i=1 i=1 t=1
NPV = (-57,000 x 1)–28,400 + 325,000 – 22,000
NPV = N 217,600 Since CMI > P + 1
Vol. 3 Issue 7, July - 2017 (The iterative process continues depending on the
duration of investment)
IV. RESULTS
The results got as shown in chapter four of this project implied that the software developed in quite accurate since there is no difference between the answer arrived at through manual approach and the computerized approach. For easier understanding of the discussion, the snap shots of the various result forms are depicted below.
Figure above form showing the test model at 1st
year of investment
Figure above form showing the test model at 2nd
year of re-investment
Figure above form showing the test model at 3rd year of re-investment
Table 1: Comparison of Profit through Software Developed and Approach at Year I
Year 1 Data variable
Input data (N)
Computed results/profit through
manual approach (N) software developed (N)
CMI 500
20,580 20,580
COL 0
CM 150
COM 200
CMM 0
COP 0
COT 200
COR 10000
NLS 800
CPL 50
TRP 200
Source: Author’s computation
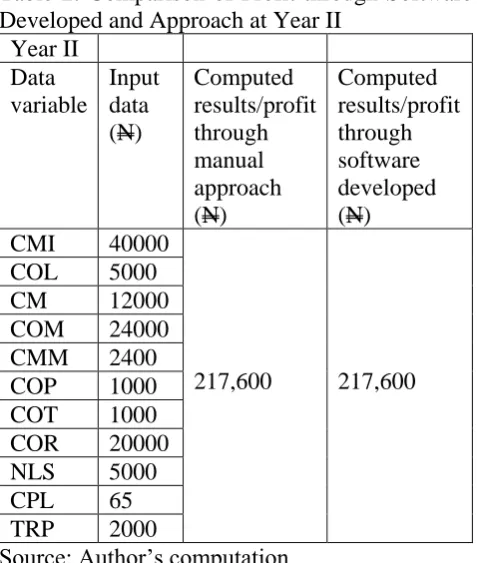
Table 2: Comparison of Profit through Software Developed and Approach at Year II
Year II Data variable Input data (N) Computed results/profit through manual approach (N) Computed results/profit through software developed (N) CMI 40000
217,600 217,600 COL 5000
CM 12000
COM 24000 CMM 2400 COP 1000 COT 1000 COR 20000 NLS 5000
CPL 65
TRP 2000
Source: Author’s computation
Table 1: Comparison of Profit through Software Developed and Approach at Year III
Year III Data variable Input data Computed results/profit Computed results/profit
(N) through manual approach (N) through software developed (N) CMI 80000
368,000 368,000 COL 15000
CM 36000
COM 48000 CMM 12000 COP 3000 COT 2000 COR 50000 NLS 10000
CPL 75
TRP 5000
Source: Author’s computation
Graph of Profit Against Year of Investment for both Manual Approach and the Developed Software
V. DISCUSSION
In the course of the analysis, several techniques for the introduction of machines and other equipment of a production system were highlighted in order to meet the expected capacity output or demand. The overall procedure entails introducing profit from the previous year, loans from Government, bank and cooperative society into the model so that the expected capacity output can be met. These results from the model are depicted in the profit computation using manual approach in year I and year II respectively.
The result on year I shows that for the input parameter when the company purchases a fixed asset such as equipment, it makes an investment and through this investment, funds have been committed in the expectation of returns. However, it wis evident from above that the more machines
0 50000 100000 150000 200000 250000 300000 350000 400000
Year I Year II Year III
Manual
Vol. 3 Issue 7, July - 2017 introduced, the more expected capacity output or
demand increases.
The results on year I and year II show that as more capital are reinvested in the business through the collection of loans from bank, Government and cooperative society, more machines or equipment are purchased and this really help in the target i.e. the expected capacity output or demand are met on the long run.
VI. CONCLUSION
The development of a model for the sequential development of palm oil industry in a small scale is very essential. A major reason being that through the introducing of loan and profit acquired from the previous year. The expected capacity output or demand is met and because of the need to keep initial capital investment to a bare minimum, it is imperative that un-necessary mechanized unit operations are eliminated. Work that can be done manually without overly taxing profitability should be, thereby taking advantage of surplus labour and creating a stream of wages and salaries in the local community.
VII. RECOMMENDATIONS
Sequential development of palm oil industry in a small scale using reinvestment method for economical and qualitative production and for the expected capacity to be met by using this type of model developed will sustain her for profitability in the short run and eventually sustain her for profitability and competitiveness in the long run. It is therefore recommended that having operation model for production is not enough to meet the expected capacity or demand. Other factors besides cost of raw materials and cost of labour, machines introduced that increase the total cost of production needs to be taken care of in location of an industry. For instance, prime mover power is a major consideration as most villages do not have electricity and hence the diesel engine is the main source of power. Thus, the cost and maintenance of this power source would eliminate most small-scale processors.
REFERENCES
[1] P.C. Shamar, A Textbook of Production Engineering: S.Chand& Company Ltd. Ram Nagar, New Delhi, 2006.
[2] A.K. Ogunkoya and A.A. Aderoba, “A model for process optimization of small-scale industry for competitive Production,” The Pacific Journal of Science and Technology, vol. 11, No.2, pp. 366-375, 2010.
[3] D.O. Ataga, C.O. Ilechie and U. Omoti, “Small-scale palm oil processing technology in Nigeria,” NIFOR, Benin-City, 1993.
[4] G.A. Badmus, “An overview of oil palm processing in Nigeria. Proceedings of Agricultural Engineering Nigeria. 30years of University of Ibadan experience,” 2002.
[5]O.K. Owolarafe and O.A. Oni, “ Modern mill technology and centralized process system, alternative for improving performance of palm oil mills in Abia State, Nigeria,” Techology in Society, pp. 1-11, 2011.
[6] R.Pike and C. Guilding, “Brand valuation. A model and empirical study of organizational implications,” Accounting and Business Research, vol.24. pp .241-253, 1994.
[7] P.D. Cha, J.J. Rosenberg and C.L. Dym, “Fundamentals of modeling and analyzing engineering systems,” Cambridge University Press, 2000.
[8] A.A. Aderoba, “A generalized cost-estimation model for job-shops,” Nigerian Journal of Engineering Management, vol.2 No.1, pp. 22-27, 2001.
[9] M.O. Idris and A.A. Aderoba, “ An integrated investment model for new job shops,” Nigerian Journal of Engineering Management. Vol.1 No.2. Pp.38-45, 2002.
[10] O. Offiong, “Development of a group replacement model for low cost item in an industry,” Nigerian Journal of Industrial and System Studies, vol.3, pp.11-19, 2002.
APPENDIX
Flow Chart of Program for Reinvestment
START
STOP
Set header files and define all the variables in the model
Initialize year to 1
Set target of production
Input all the variables of the model needed for the computation
calculate the profit for the year investment as net profit value=sales - purchase-Invt-operational cost
Do you still want to continue in reinvestment? Set target of
production
is the target of production met?
Increment year by 1
End of program
If CMI<P
Re-invest the profit into the business YES
NO
For the first year deduct calculated 30 % from profit for process maintenance
YES
A
C
Flow chart diagram of the algorithm used for modeling the reinvest process (partII)
Input all variables of the model needed for computation
Is year >1 ? A
STOP
Is CMI > P?
Take loan from government and add as capital
Take loan from bank and add as part of capital
Take loan from cooperative society and add as capital
Is CMI >p+1
Is CMI >p+2
B C
Yes No
Yes No