http://www.pharmacophorejournal.com 647
Pharmacophore
(An International Research Journal)Available online at http://www.pharmacophorejournal.com/
Original Research Paper
DEVELOPMENT AND VALIDATION OF A HPLC/MS/MS METHOD FOR THE
DETERMINATION OF ALBUTEROL IN HUMAN PLASMA
B. Snehalatha
1*, D. Gowri Shankar
2and Sudha Rathod
31
Department of Quality Assurance, Oriental College of Pharmacy, Navi Mumbai, India
2
Department of Quality Assurance, University College of Pharmaceutical sciences,
Visakhapatnam, Andhra Pradesh, India
3
Department of Pharmaceutics, Oriental College of Pharmacy, Navi Mumbai, India
ABSTRACT
A simple, sensitive and specific liquid chromatography-tandem mass spectrometry (LC-MS/MS) method was developed for the quantification of Albuterol (AB) in human plasma by using the solid phase extraction method. Amlodipine (AD) was used as an internal standard (IS). Chromatographic separation was achieved on inertsil ODS C 18 (4.6 mm×150mm,5µ) column with an isocratic mobile phase composed of 0.1% formic acid and Acetonitrile in the ratio of 10:90(v/v),at a flow rate of 0.6ml/min. AB and AD were detected with proton adducts at m/z 240.2-148.4 and m/z 409.2-238.1 in MRM positive mode respectively. The method was validated over a linear concentration range of 10.5-4119.760 pg/ml with a correlation coefficient (r2) ≥ 0.990. This method demonstrated intra and inter day precision within 5.4-9% and 4.1-9.3% and accuracy within 95.7-104% and 97.7-103.4%.AB was found to be stable throughout three freeze thaw cycles, bench top ,short term and long term stability studies.
Keywords:
Albuterol, Human plasma, HPLC, MS, MS Method.INTRODUCTION
Albuterol (Figure1) is chemically, 2-ter-Butylamino-1(4-hydroxy-3-hydroxy methyl phenyl) ethanol hemisulphate. The empirical formula is 2(C13H21NO3).H2SO4 and having a
molecular weight of 576.70. Albuterol1-3, a moderately selective beta2-receptor agonist similar in structure to terbutaline is widely used as a bronchodilator to manage asthma and other chronic obstructive airway diseases. The R-isomer, levalbuterol, is responsible for bronchodilation while the S-isomer increases bronchial reactivity. In the references HPLC and UV methods5-10 are reported for the determination of Albuterol.The following are the advantages of the proposed method over those reported earlier:
a) Greater sensitivity is achieved (0.01ng/mL) even with low plasma volumes and method is well suited for pharmacokinetic analysis.
b) Because of the use of less plasma volume, the volume of the sample to be collected for time point from subjects during the study is reduced significantly-this allows inclusion of additional points.
c) The rapid sample analysis turnaround time of 3.20 minutes makes it an attractive procedure in high-throughput bio analysis of albuterol in human plasma.
extraction efficiency, dilution integrity, and Stabilities were provided. The devised method can be used in Albuterol clinical study.
EXPERIMENTAL
Reference standards of Albuterol (Potency (w/w 99.5%) and Amlodipine (99.9%) were procured from Aurobindo Pharma Ltd. (Hyderabad, India). Acetonitrile of HPLC Grade is purchased E. Merck, Mumbai, India. Analytical-grade Formic acid and orthophosphoric acid were purchased from SD Fine chemicals (Mumbai, India). Polypropylene vials (Torsens Products Pvt Ltd Kolkata, India) Water used for the LC-MS/MS analysis was prepared using a Milli Q water purification system procured from Millipore (Bangalore, India). Human plasma was procured from Sri Vidhya Diagnostics, India) and was stored at -20°C until use.
Liquid Chromatographic Conditions
A Schimadzu HPLC system was used for setting the reverse-phase liquid chromatographic conditions. The separation of Albuterol and
Amlodipine (IS) was performed on Inertsil ODS C-18 (150 mm×4.6 mm (length inner diameter), with 5 µm particle size and was maintained at 40 °C in column oven. The mobile phase consists of Acetonitrile and 0.1% Formic acid in 90:10 (v/v) ratio. For isocratic elution, the flow rate of the mobile phase was kept at 0.60 mL/min. The total chromatographic run time was 3.2 min.
Mass Spectrometric Conditions
Ionization and detection of analyte and IS was carried out on a triple quadrupole mass spectrometer. API-4000 equipped with atmospheric pressure; chemical ionization and operating in positive ion mode. Quantization was performed using multiple reactions monitoring (MRM) mode to monitor Parent Product ion (m/z) transitions for albuterol and amlodipine.
Albuterol Q1 240.2 (Positive mode) Q3 148.4 Amlodipine Q1 409.2 (Positive mode) Q3 238.1
Mass Spectrometer Parameters:
Parameters Albuterol Amlodipine
CUR 25.00 25.00
CAD 6.00 6.00
GSI 50.00 50.00
GS2 55.00 55.00
IS 5500.00 5500.00
TEM(0C) 400.00 400.00
EP 10.0 10.00
DP 40.00 65.00
CE 26.00 12.00
CXP 8.50 24.00
Dwell Time (msec) 400 200
Standard Stock, Calibration Standards and Quality Control Sample Preparation
The standard stock solution of 1 mg/mL of Albuterol was prepared by dissolving requisite amount in methanol. Calibration standards and quality control (QC) samples were prepared by
http://www.pharmacophorejournal.com 649
middle quality control), 31.28 pg/mL (LQC low quality control), 10.5pg/mL (LLOQQC lowest level quality control). Stock solution (0.2mg/mL) of the internal standard was prepared by dissolving 5.05 mg of Amlodipine in 25mL of methanol. An aliquot of 50.0 µL of this solution was further diluted to 100.0 mL in the same diluent to obtain solution of 100 ng/mL. All the solutions (standard stock, calibration standards and quality control samples) were stored at 2-8°C until use.
Protocol for Sample Preparation
Prior to analysis, all frozen subjects samples, calibration standards and quality control samples were thawed and allowed to equilibrate at room temperature. To an aliquot of 500 µL of spiked plasma sample, 50 µL internal standard was added and vortexed for 30 s. Further, 500 µL of 0.5 % OPA solution (v/v) and vortexed for 10s. For blank sample add 50µl of water instead of ISTD dilution. Centrifuge the samples at 4600RPM for 5 minutes at 5°C.Condition prelabeled OASIS HLB with 1ml Acetonitrile followed by 1.0ml of water(HPLC grade).Load 0.9 ml centrifuged samples into cartridges and allow drawing at low nitrogen gas pressure. Wash with 1.0ml water for twice and dry five minutes applying full pressure. Elute with 400µl elution mixture into ria vials. Transfer eluent from ria vials to HPLC vials and inject it.
METHOD VALIDATION
The method validation was performed as per USFDA guidelines(4) to evaluate the method in terms of the parameters e.g., Linearity response, System suitability, sensitivity, selectivity, precision and accuracy (within batch and between batch),stabilities(freeze thaw, bench top, short term and long term stock solutions, working solutions and long term stability in matrix),carryover effects ,recovery, dilution integrity, matrix effect, auto sampler reinjection reproducibility and ruggedness.
System Suitability
System suitability experiment was performed by injecting six consecutive injections using aqueous standard mixture of Albuterol and internal
standard at the start of each batch during the method validation. The Signal to noise ratio should be more than or equal to 5 for LLOQ QC sample.
Carryover Effect
The carryover effect of the auto sampler was evaluated by injecting a sequence of injections solutions of aqueous standard, Mobile phase, standard blank, extracted standard equivalent to highest standard in the calibration range. As per the acceptance criteria, the response in blank should not be greater than 20% of LLOQ response.
Sensitivity and Selectivity
The specificity of the intended method was established by screening the blank plasma (without spiking with drug or internal standard).Ten different batches of plasma out of which ,seven normal ,one lipidemic and one hemolyzed plasma having anticoagulant and one heparinized plasma as anticoagulant were screened. The specificity was evaluated by comparing the responses of interfering peak at the retention time of albuterol and internal standards in the standard blank against the response of the respective extracted LLOQ and aqueous LLOQ. The sensitivity was evaluated by calculating the precision and accuracy of LLOQ sample in each of the at least three acceptable precision and accuracy batches individually and in total (between batches).
Linearity
The linearity of the method was determined by analysis of five linear curves containing eight non-zero concentration. The ratio of area response for drug and IS was used for regression analysis. Each calibration curve was analyzed individually by using least square weighed (1/x2) linear regression. The lowest standard on the calibration curve was accepted as the lower limit of quantitation (LLOQ), if the analyte response was at least five times more than that of the drug free (blank) extracted plasma. The deviation of standards other than LLOQ from nominal concentration should not to be more than ±15.0%.
For determining the intra-day accuracy and precision, replicate analysis of plasma samples of Albuterol was performed on the same day. The run consisted of a calibration curve and six replicates of LLOQ, LQC, MQC and HQC samples. The inter-day accuracy and precision were assessed by analysis of three precision and accuracy batches on three consecutive validation days. The precision of the method was determined by calculating the percent coefficient of variation (%CV) for each level. The deviation at each concentration level from the nominal concentration was expected to be within ±15.0% except LLOQ, for which it should be within ±20.0%.
Recovery and Matrix Effect
The relative recovery, matrix effect and process efficiency were evaluated at Std-1, Std-3, Std-5, Std-6 and Std-8 levels in six replicates. Relative recovery (RE) was calculated by comparing the mean area response of extracted samples (spiked before extraction) to that of unextracted samples (spiked after extraction) at each CC level. The recovery of IS was similarly estimated. Absolute matrix effect (ME) was assessed by comparing the mean area response of unextracted samples (spiked after extraction) with mean area of neat standard solutions. The overall ‘process efficiency’ (%PE) was calculated by comparing the mean area response of extracted samples (spiked before extraction) to that with mean area of neat standard solutions at each CC level. The assessment of relative matrix effect was based on direct comparison of the MS/MS responses (peak areas) of the analytes spiked into extracts originating from different lots of plasma. The variability in these responses, expressed as %CV was considered as the measure of relative matrix effect.
Stability
Stability experiments were carried out to examine the analyte stability in stock solutions and in plasma samples under different conditions. Short term stability at room temperature and long term stability of spiked solution stored at – 70ºC was assessed by comparing the area response of stability sample of analyte and IS with the area
response of sample prepared from fresh stock solutions. The solutions were considered stable if the deviation from nominal value was within ±10%. Autosampler, wet extract stability, bench top stability, dry extract stability and freeze- thaw stability were performed at LQC and HQC, using six replicates at each level. The samples were considered stable if the deviation from the mean calculated concentration of freshly thawed quality control samples was within ±15%.
Ruggedness
To authenticate the ruggedness of the proposed method, it was done on two precision and accuracy batches. The first batch was analysed by different analysts while the second batch was analysed on different column and different LC-MS/MS.
Dilution Integrity
Dilution integrity experiment was conducted by diluting the stock solution prepared as spiked standard at concentration of 12359.28pg/mL for Albuterol. The precision and accuracy for dilution integrity standards at 1/5th and 1/10th determined by analyzing the samples against calibration curve standards.
METHOD DEVELOPMENT
http://www.pharmacophorejournal.com 651
of 0.1% Formic acid and Acetonitrile (10:90, v/v) ratio was found most suitable for eluting Albuterol and IS at 1.5 and 1.5 min respectively. Also,the reproducibility of retention times for the analytes, expressed as %CV was ≤2% for 100 injections on the same column. The inherent selectivity of MS/MS detection was also expected to be beneficial in developing a selective and sensitive method. The present study was conducted using ESI as the ionization source as it gave high intensity for drug and IS as they have similar sites for protonation. Initially, the extraction of Albuterol and IS was carried out via protein precipitation with common solvents like acetonitrile, methanol and acetone, but the sensitivity and reproducibility were poor, in all the solvents with frequent clogging of the column, which required online flushing of the column. Solid Phase extraction technique was also tested to isolate the drugs from plasma using OASIS HLB cartridges which gave consistent recoveries for the analytes, especially at the LLOQ level with minimum matrix interference. Internal standard was used to minimize any analytical variation due to solvent evaporation, integrity of the column and ionization efficiency of analytes. Amlodipine was used as an internal standard (IS) in the present study, which had similar chromatographic behavior and was quantitatively extracted with the proposed extraction procedure. Also, there was no effect of IS on analyte recovery, sensitivity or ion suppression.
RESULTS
Stock Solution Verification
The stock solution verification was conducted by preparing the stock solution each of albuterol and internal standard in diluted by two different analysts. Analytes were prepared two vials (from each stock solution prepared) by spiking 20 μL of working calibration standard and 20 μL of working internal standard level in 960 μL of elution solution. The CV% of response ratio of six replicate injections from stock solutions of acyclovir and for standard was 2.4 and 3.22 respectively.
System Suitability
System performance experiment was performed by injecting six consecutive injections at the beginning of analytical batch or before any re-injection and signal to noise ratio was 25.2 for LLOQ QC sample and %CV of ratio was 9.86, respectively. Injector carryover test was performed and there was no significant injector carryover observed.
Specificity/Selectivity and Sensitivity
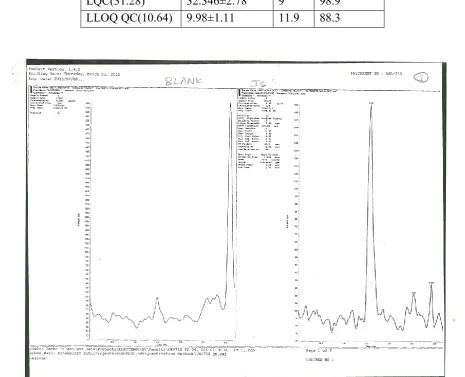
Selected blank human plasma from six different sources and were carried through the extraction procedure and chromatographed to determine the extent to which endogenous human plasma components may contribute to chromatographic interference with the albuterol or internal standard. One hemolyzed and one lipemic plasma were also checked for specificity along with this run. Figure 02 to 03 shows the typical chromatograms obtained from LC-MS/MS analysis of plasma spiked with internal standard and plasma added with acyclovir, respectively. The retention time of acyclovir and internal standard were approximately 1.5 and 1.5 minutes, respectively. No significant interference was observed in six different lots of human plasma, hemolyzed plasma and lipemic plasma samples. The peaks were completely separated and there was no interference peaks from endogenous substances in plasma that was co-eluted with acyclovir as well as the internal standard. The acyclovir lower limit of quantitation, signal to noise ratio and %CV of ratio were 10.5 pg/mL, 25.2 and 9.86% respectively. The overall chromatography run time was 2.24 minutes.
Matrix Factor
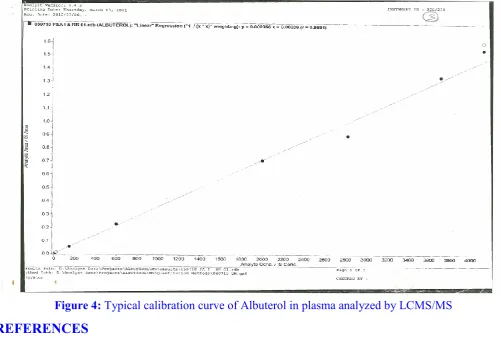
Calibration of Standard Curve (Linearity and Range):
The calibration curve was constructed between peak height ratios of AB to the internal standard against AB concentrations as given in Figure 04. Linearity was demonstrated by multiple analysis of spiked plasma sample containing AB between 10.5 to 4119.76 pg/ml calibration ranges. The regression equation of acyclovir concentration over its peak area ratio was found to be y = 0.000356x+0.00206, where x is the concentration of acyclovir and Y is the respective peak area. The regression coefficient (r2) is 0.9968. A good linear relationship with the coefficient of determination (r2) of more than 0.99 was employed for determining of albuterol concentration in plasma. Back calculations were made from the calibration curves to determine Albuterol of each calibration standard. The lower limit of quantification (LLOQ) was established at 10.65 pg/mL with the coefficient of variation of 5.9% indicates the sensitivity of the method.
Recovery
The % recovery was calculated from ratio of area of extracted to un-extracted samples at each level are shown in Table 1. The six un-extracted samples each of low, medium and high quality control samples were prepared by spiking of 20 μL drug and 20 μL internal standards in extracted blank plasma were eluted. The recovery results were based on a comparison of the LC -MS/MS response from plasma (un-extracted) to those from extracted plasma blank. The mean % recovery for LQC, MQC and HQC are 55.5, 53.4 and 58.2 respectively. The mean % recovery for internal standard is 43.3. The recovery of Amlodipine (IS) from biological matrix was 52.8%.
Precision and Accuracy
Between- Run Accuracy and Precision
The between-run accuracy and precision evaluation were assessed by the repeated analysis of human plasma samples containing different concentrations of albuterol on separate occasions. A single run consisted of a calibration curve, six replicates of lower limit of quantitation (LLOQ), low, medium and high quality control samples
and results are expressed as the percentage of accuracy of the analytical method presented in Table 2. The between-run % coefficient of variation ranged from 4.1 to 18.3. The between-run % of accuracy value was ranged from 93.8 to 103.4 respectively.
Within-Run Accuracy and Precision
Analyzing replicate concentrations of albuterol in human plasma performed within-run accuracy and precision evaluations. The run consisted of a calibration curve plus a total of 24 spiked samples, including six replicates each of the lower limit of quantitation (LLOQ), low, medium and high quality control samples. The between-run (inter-day) precision and accuracy of the assay procedure are shown in Table 3. The within-run % coefficient of variation ranged from 3.8 to 11.9. The within-run % of accuracy value was ranged from 88.3 to 103 respectively.
Dilution Integrity
Dilution quality control was diluted fifth and tenth times in human plasma. Prior to extraction, six samples each of fifth and tenth diluted samples were processed and analyzed with freshly processed calibration samples. The calculated concentrations, including the dilution factor for 1/5th and 1/10th yielded coefficient of variation of 9.4 and 6.9 respectively. Percentage of nominal values for dilution factor 1/5th and 1/10th were 100.1 and 110.1 respectively.
Ruggedness
Different analyst with different column defines ruggedness. The run consisted of a calibration curve and a total of 18 spiked samples, including 6 replicate each of the low, medium and high quality control samples. The % coefficient of variation ranged from 1.03 to 6.12 and the percentage of nominal values ranged from 96.24 to 107.27.
Short Term Stock Solution Stability at Room Temperature
http://www.pharmacophorejournal.com 653 Long Term Stock Solution Stability in
Refrigerator between 2-8 ºC
Solution each of albuterol at working curve standard level and internal standard solution at working internal standard level were stable for 165 days. For AB and internal standard, the % change was 2.23 and 1.62 respectively.
Bench Top Stability
The bench top stability samples each of low and high QC (stability samples) was kept on bench at room temperature was found stable at approximately 6 Hrs. The % change for LQC and HQC were 9.2 and 2.9 respectively.
Freeze and Thaw Stability (at -20 ± 5 ºC)
The freeze and thaw stability samples each of LQC and HQC were found to be stable in human plasma after four freeze and thaw cycles (at -20 ± 5 ºC). The % change for LQC and HQC were 4.3and 5.4 respectively.
Autosampler Stability
The stability samples each of LQC and HQC was found to be stable for approximately 30Hrs and 00 Min in autosampler (at 5 ± 3 ºC). The % change for LQC and HQC were 4.5 and 6.2 respectively.
Long Term Stability of Albuterol and Internal Standard in Biological Matrix (Human Plasma)
Process and analyze freshly spiked calibration curve standards and six replicates of each LQC, MQC and HQC samples and internal standard solutions for first day stability assessment and stability was assessed by comparing the stability samples against first day samples. The % AB change found for LQC, MQC, HQC and internal
standard were 2.45, 2.21, 1.89, 3.15 and 3.83 respectively. The % mean long term working solution stability for Albuterol and Internal Standard samples were in the range of 90-110% and % CV was within 15.00%. The result suggest that albuterol was stable in human plasma at -20 ± 5 ºC for at least 4 months and expected to be more stable at -70±5°C.
CONCLUSION
The developed method is rapid, sensitive, rugged and reproducible with high recovery. Each sample requires less than 3min of analysis time. Drug and IS were extracted with the simplest solid phase extraction method with less matrix effect. The developed method can be successfully applied in the pharmacokinetic study to evaluate plasma concentration of AB in healthy human beings.
ACKNOWLEDGEMENTS
Authors wish to thank the support received (for providing Literature survey) from Andhra University, Visakhapatnam, India, and MTR labs, Chennai, India to carry out this research work.
Figure 1: Chemical structure for Albuterol sulfate
Table1: Recovery of Albuterol in spiked plasma Spiked concentration
of Albuterol (pg/ml)
Peak height ratio (mean± SD) n=6 % Recovery
Extracted albuterol response Unextracted albuterol response
HQC(3501.8) 429012 911503 47.1
MQC(2031.04) 233336 570102 40.9
Table 2: Between-run precision and accuracy of the analytical method for albuterol in plasma
Albuterol concentrations(pg/ml) % CV % Accuracy
Added Measured
HQC(3501.8) 3569.67±146.68 4.1 101.9 MQC(2031.04) 1983.896±139.56 7 97.7 LQC(31.28) 32.346±3.02 9.3 103.4 LLOQ QC(10.64) 9.98±1.83 18.3 93.8
Table3: Within-run precision and accuracy of the analytical method for albuterol in plasma
Albuterol concentrations(pg/ml) %CV % Accuracy
Added Measured
HQC(3501.8) 3569.67±195.95 5.4 103 MQC(2031.04) 1983.896±749.6 3.8 96.5 LQC(31.28) 32.346±2.78 9 98.9 LLOQ QC(10.64) 9.98±1.11 11.9 88.3
http://www.pharmacophorejournal.com 655 Figure 3: Typical chromatogram of LC-MS/MS analysis of Albuterol and amlodipine(IS) in plasma
Figure 4: Typical calibration curve of Albuterol in plasma analyzed by LCMS/MS
REFERENCES
1. (2000), “PDR: Physician Desk Reference”, 54th Edition.
2. (2003), “United States Pharmacopoeia USP 26 & NF 21”, USP Convention INC., Rockville.
3. Reynolds, JEF(1993), “Martindale”, The Extra Pharmacopoeia 30th Edition, The Pharmaceutical
4. Press, London.
6. Kasawar, GB and Farooqui, M (2010), “Development and validation of a stability indicating RP-HPLC method for the simultaneous determination of related substances of albuterol sulfate and ipratropium bromide in nasal solution”, J. Pharm Biomed Anal, 52(1), 19-29.
7. Huy, Ong; Albert, Adam et al (1989), “Analysis of albuterol in human plasma based on immunoaffinity chromatograhic clean-up combined with high-performance liquid chromatography with fluorimetric detection”,
Journal of Chromatography B: Biomedical Sciences and Applications, 497, 213-221. 8. Langchong, He and James T, Stewart (1992),
“A high performance liquid chromatographic method for the determination of albuterol enantiomers in human serum using solid phase extraction and chemical derivatization”,
Biomedical Chromatography, 6(6), 291-294. 9. Blewett, AJ; Varma, D; Gilles, T; Butcher, R; Jacob, J; Amazan, J and Jansen, SA (2011), “Development and Validation of a Stability-Indicating High-Performance Liquid
Chromatography Method for the Simultaneous Determination of Albuterol, Budesonide, and Ipratropium Bromide in Compounded Nebulizer Solutions”, J AOAC Int, 94(1), 110-7.
10.Bartolincic, A; Druskovic, V; Sporec, A and Vinkovic, V (2005), “Development and validation of HPLC methods for the enantioselective analysis of bambuterol and albuterol”, J Pharm Biomed Anal, 36(5), 1003-10.
11.Jacobson, GA; Chong, FV and Davies, NW (2003), “LC-MS method for the determination of albuterol enantiomers in human plasma using manual solid-phase extraction and a non-deuterated internalstandard”, J Pharm Biomed Anal, 31(6), 1237-43.
Correspondence Author:
B. Snehalatha
Department of Quality Assurance, Oriental College of Pharmacy, Navi Mumbai, India
Cite This Article:
B, Snehalatha; D, Gowri Shankar and Sudha, Rathod (2014), “Development andvalidation of a HPLC/MS/MS method for the determination of albuterol in human plasma”,