Beta blockers comprise a group of drugs that are
mostly used to treat cardiovascular disorders such as hypertension, cardiac arrhythmia, and ischemic heart disease. Each of these drugs possesses at least one chiral center, and an inherent high degree of
enantioselectivity in binding to the β‑adrenergic receptor. For beta blockers with a single chiral center like atenolol, metoprolol, acebutolol, the
(‑) enantiomer possesses much greater affinity
for binding to the β‑adrenergic receptors than
antipode[1].
S (‑) atenolol is a cardioselective β‑1 adrenoceptor blocker devoid of intrinsic sympathomimetic and
membrane‑stabilizing activities. The maintenance of constant plasma level of a cardiovascular drug is important in ensuring the desired therapeutic response. Since the half‑life of s (‑) atenolol is 6–7 h, multiple
doses are needed to maintain a constant plasma concentration for a good therapeutic response and improved patient compliance[1]. Stoschitzky et al. study implied that the mean AUC, maximal plasma concentrations, tmax and plasma half‑lives of the enantiomers were similar regardless of whether they were administered as optically pure enantiomers or as racemic mixture[2‑4]. Oral bioavailability of atenolol and its enantiomer is an about 50% since it has been reported that its absorption in the duodenum and jejunum is directly proportional to the dose availability[5‑7].
Research
Paper
Design, Development and Optimization of S (-) Atenolol
Floating Sustained Release Matrix Tablets Using Surface
Response Methodology
P. T. GUNJAL*, M. B. SHINDE, V. S. GHARGE1, S. V. PIMPLE1, M. K. GURJAR1 AND M. N. SHAH1
Formulation and Development Department, Zuventus Healthcare Ltd, T‑184 MIDC Bhosari, Pune‑411 026, 1Emcure
Pharmaceutical Ltd, Emcure House, Pune‑411 026, India
Gunjal, et al.: Floating Sustained Release Matrix Tablets of S (‑) Atenolol
The objective of this present investigation was to develop and formulate floating sustained release matrix tablets of s (‑) atenolol, by using different polymer combinations and filler, to optimize by using surface response methodology for different drug release variables and to evaluate the drug release pattern of the optimized product. Floating sustained release matrix tablets of various combinations were prepared with cellulose‑based polymers: Hydroxypropyl methylcellulose, sodium bicarbonate as a gas generating agent, polyvinyl pyrrolidone as a binder and lactose monohydrate as filler. The 32 full factorial design was employed to investigate the effect of formulation variables on different properties of tablets applicable to floating lag time, buoyancy time, % drug release in 1 and 6 h (D1 h, D6 h) and time required to 90% drug release (t90%). Significance of result was analyzed using analysis of non variance and P < 0.05 was considered statistically significant. S (‑) atenolol floating sustained release matrix tablets followed the Higuchi drug release kinetics that indicates the release of drug follows anomalous (non‑Fickian) diffusion mechanism. The developed floating sustained release matrix tablet of improved efficacy can perform therapeutically better than a conventional tablet.
Key words: Buoyancy time, floating lag time, floating sustained release, hydrophilic polymers, s (‑) atenolol, surface response methodology
*Address for correspondence
E-mail: [email protected]
This is an open access article distributed under the terms of the Creative Commons Attribution-NonCommercial-ShareAlike 3.0 License, which allows others to remix, tweak, and build upon the work non-commercially, as long as the author is credited and the new creations are licensed under the identical terms. For reprints contact: [email protected]
A gastric floating drug delivery system (GFDDS) can
overcome this problems and is particularly useful for drugs that are primarily absorbed in the duodenum and upper jejunum segments. The GFDDS is able to prolong the retention time of a dosage form in the stomach, thereby improving the oral bioavailability of the drug[8‑10].
Based on this, an attempt was made through this investigation to formulate floating sustained release tablet of s (‑) atenolol by using
hydroxypropylmethyl cellulose K15M (HPMC K15M) and hydroxypropylmethyl cellulose K100 LV (HPMC K100 LV) as a polymer. The 32 full factorial design was employed to investigate the effect of independent formulation variables, i.e. concentration
of HPMC K15M and HPMC K100 LV on the various
properties of tablets applicable to floating lag time
(FLT), buoyancy time (BT), % drug release in
1 and 6 h (D1 h, D6 h) and time required to 90% drug release (t90%). The target release profile for proposed
tablet formulation was calculated as per Robinson
and Eriksen equation: After 1 h, 30–35% of the
drug should be release; after 6 h, 60–65% of the drug
should be release; and finally, till 12 h, the remaining
drug should be release[11].
MATERIALS AND METHODS
S (‑) atenolol of Emcure Pharmaceutical Ltd., Pune, India was used. HPMC K15M, HPMC K100 LV kindly supplied by Colorcon Asia Pvt. Ltd., Goa,
India. Sodium bicarbonate (SB), polyvinyl pyrrolidone
K–30 (povidone K–30), lactose monohydrate (LM),
magnesium stearate (MS), isopropyl alcohol (IPA),
hydrochloric acid purchased from Cantan Lab,
Baroda, India, BASF, Thane, India, Dynamix Dairy,
Baramati, India, Nitika Pharmaceuticals, Nagpur,
India, Deepak Fertilizers, Raigad, India and Merck,
Germany, respectively.
Interaction study:
The possibility of any interaction between s (‑)
atenolol and excipients used in formulation of floating
sustained release tablets was assessed by carrying out the differential scanning calorimetric (DSC) study. The thermal behavior of s (‑) atenolol and its
physical mixture, i.e., drug, polymers (HPMC K15M, HPMC K100 LV) and excipients (SB, LM, MS) were determined using DSC (Pyris 6 DSC, Perkin Elmer)
at heating rate of 20°/min. The measurements were performed at a heating range of 50° to 200° under nitrogen atmospheres.
Full factorial design:
A two factor, three‑level full factorial design (32) was employed for optimization of tablets. The
concentration of HPMC K15M (A) and HPMC K100 LV (B) were selected as independent variables. Concentration of HPMC K15M was evaluated at
10, 15, and 20% of total tablet weight and the
concentration of HPMC K100 LV was evaluated at 15, 20, and 25% of total tablet weight. The FLT, BT,
D1 h, D6 h and t90% selected as response (i.e. dependent variables). Design Expert 8.0.3. Software (Stat‑Ease Inc., USA) was used for the generation and evaluation of statistical experimental design.
Formulation of floating sustained release matrix tablets:
Floating sustained release matrix tablets of s (‑) atenolol were prepared by wet (non‑aqueous) granulation according to the formula given in Table 1. S (‑) atenolol (25 mg) was mixed with the required
quantity of HPMC K100 LV and HPMC K15M in combination with SB (12.50 mg), and LM in rapid
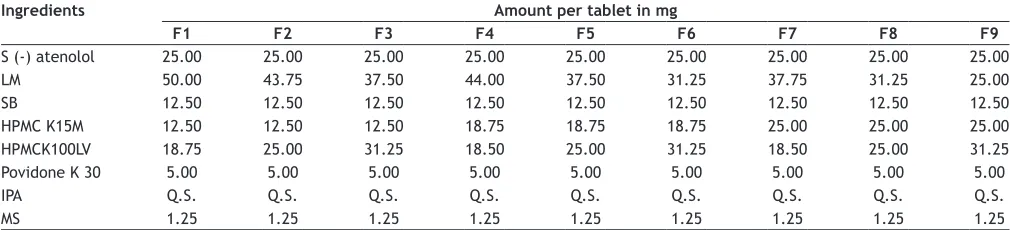
TABLE 1: COMPOSITION OF FLOATING SUSTAINED RELEASE MATRIX TABLETS
Ingredients Amount per tablet in mg
F1 F2 F3 F4 F5 F6 F7 F8 F9
S (‑) atenolol 25.00 25.00 25.00 25.00 25.00 25.00 25.00 25.00 25.00 LM 50.00 43.75 37.50 44.00 37.50 31.25 37.75 31.25 25.00 SB 12.50 12.50 12.50 12.50 12.50 12.50 12.50 12.50 12.50 HPMC K15M 12.50 12.50 12.50 18.75 18.75 18.75 25.00 25.00 25.00 HPMCK100LV 18.75 25.00 31.25 18.50 25.00 31.25 18.50 25.00 31.25 Povidone K 30 5.00 5.00 5.00 5.00 5.00 5.00 5.00 5.00 5.00 IPA Q.S. Q.S. Q.S. Q.S. Q.S. Q.S. Q.S. Q.S. Q.S. MS 1.25 1.25 1.25 1.25 1.25 1.25 1.25 1.25 1.25
mixer granulator for 30 min and then granulated with
povidone K 30‑IPA binder solution and dried in rapid
fluidized bed dryer at 55°. The final granules were blended with MS (1% w/w) and compressed over 17 stations; single tooling tablet compression machine (Cadmach) using 7.7 mm flat faced beveled edge punches.
Characterization of granules:
When examining the flow properties of powder, it is useful to quantify the type of behavior in term of
speed and more importantly uniformity of flow. Many
different methods are available, either directly, using
dynamic or kinetic methods, or indirectly, generally
by measurements carried out on static beads. The
powder properties include bulk density, tapped density
and Carr’s index was determined by procedure reported in USP 36.
Evaluation of floating sustained release matrix tablets:
The floating sustained release matrix tablets were evaluated for physical parameters, i.e., weight variation (BSA224S‑CW, Sartorius balance), hardness
(Monsanto hardness tester), thickness (Digital vernier
caliper), friability (Friability test apparatus EF 2, Electrolab, India) and drug content.
Floating lag time and buoyancy time:
FLT and BT of the tablets were determined using USP 36 type II apparatus (Disso TDT 08 L, Electro
lab) at 50 rpm in 900 ml using pH 1.2 buffer. The
time in minutes taken by the tablet to reach the top from the bottom of the container was FLT and the
time for which the tablet constantly floats on the surface of the medium was measured as BT.
In vitro release studies:
The in vitro drug release was studied by using USP 36 type II apparatus, i.e., Rotating paddle (Disso TDT
08 L, Electro lab). The dissolution was performed in
900 ml acidic buffer pH 1.2. The temperature was maintained at 37±0.5° and the speed of paddle was
kept at 50 rpm during dissolution study. Samples of
5 ml was collected at the interval of one hour and replaced with 5 ml buffer solution so as to maintained
sink condition during study. The absorbance of
samples was measured on UV spectrophotometer at 225 nm. The % drug release was calculated by DDSolver.
Kinetic modeling on drug release profile:
The nonlinear fitting of dissolution data was performed using DDSolver. The release mechanism
and kinetics of the release profiles were analyzed
by different mathematical models viz. zero order, first order, Higuchi, Hixson Crowell and
Korsmeyer–Peppas models.
DDSolver provided a number of statistical criteria for
evaluating the goodness of fit of a model, including the correlation coefficient (R_obs–pre), the coefficient
of determination (Rsqr, R2, or COD), the adjusted
coefficient of determination (Rsqr_adj or R2 adjusted), the mean square error (MSE), the standard deviation of the residuals (MSE_root or Sy.x), sum of squares
(SS), weighted of sum of square (WSS), the Akaike
information criterion (AIC), and the model selection criterion (MSC). Among these parameters, the
most popular ones in the field of dissolution model
identification are the R2 adjusted, the AIC, and the MSC[12]. Korsmeyer–Peppas model is used to analyze the release of pharmaceutical polymeric dosage forms,
when the release mechanism is not well known or
when more than one type of release phenomena could be involved[13].
Statistical analysis of the data and optimization:
The best fitting model was selected based on the
comparison of statistical parameters including the coefficient of variation (CV), the coefficient of determination (R2), adjusted coefficient of determination (adjusted R2) and the predicted residual sum of square (PRESS) provided by Design Expert software. In addition, statistical
analysis like ANOVA to identify significant effect
of factors on response, regression coefficients, F test and P value were also calculated with the software.
RESULT AND DISCUSSION
S (‑) atenolol oral bioavailability has been reported to
be about 50%, perhaps because of rapid hepatic first‑
pass metabolism. S (‑) atenolol has narrow absorption window in the small intestine. If the s (‑) atenolol dosage form can be retained in the stomach as long as possible, to allow for maximum absorption, s (‑) atenolol bioavailability can be improved. GFDDS is one approach; in it, the gastro intestinal residence
time is prolonged because of the floating behavior[15,16]. Floating matrix tablets were formulated as per 32 factorial design, and the sustained release polymer concentration was considered to have a significant effect on the release from the HPMC matrices, as increase or decrease in polymer concentration affects gel strength of matrix tablet. HPMC was chosen because it swells rapidly when come in contact with water; upon contact with water, a hydrogel layer would be formed to act as a gel boundary
for the delivery system. HPMC K15M and HPMC K100 LV were used as swellable polymers. As s (‑)
atenolol is highly water soluble drug, to control burst release from matrix, low viscosity grade of HPMC,
i.e., HPMC K100 LV used. Since HPMC K100 LV
comes in contact with dissolution media start to swell
immediately as compared to HPMC K15M[17].
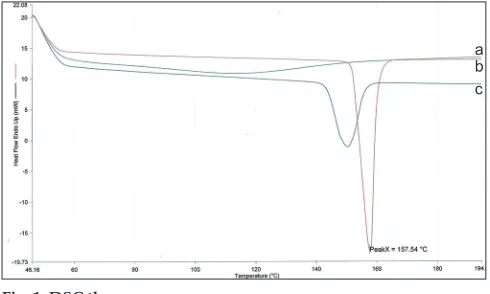
The DSC curve of pure s (‑) atenolol showed
characteristic sharp endothermic peak at 157.54°,
indicating the melting point of the drug (fig. 1). The
obtained DSC curve for physical mixture of drug with
excipients shows the endothermic peak at 153.83° of s (‑) atenolol. No change in the endotherm of the drug was observed in the physical mixture. This implied that there was no interaction between the drug and excipients.
Matrix tablets were formulated according to wet granulation method as described in Table 1.
Granulation is the key process in the production of
matrix sustained release dosage form. The properties of granules which should be evaluated to ensure the proper formulation of the tablet dosage form is an important aspect in matrix tablet formulation. The results reported in Table 2 inferred that the granules prepared by nonaqueous granulation were considerably good to formulate tablets.
The percentage weight variation of individual tablets from the average weight was found within±7.5% (w/w) which evidenced that the entire tablets complies the IP weight variation test (Table 3). The tablet hardness of entire batches was found in the range of
3.36±0.61 kg/cm2‑5.12±0.89 kg/cm2 (Table 3). The Percentage weight loss of the tablet was measured and found in the range of 0.09–0.18%. It implied that tablet has good strength (Table 3). Size of tablets was
found 7.72±0.1 mm in diameter, and thickness of that
tablet was found 3.07±0.08–3.17±0.09 mm. The size
and thickness of tablets were uniform; it indicated that uniform and proper filling of granules into the
dies during compression of tablet.
Drug content in the tablet was reported in Table 3 which complied as per IP general monograph. The result indicated that in all formulation s (‑) atenolol was uniformly distributed. The in vitro buoyancy
study of floating sustained release matrix tablets of
different formulation batches are shown in Table 4. Floating lag time of factorial sustained release matrix tablet was found in the range of 78 to 306 s. The formulation containing higher concentration of
HPMC K100 LV showed least FLT. This was might be due to the faster swelling rate of HPMC K100 LV compared to HPMC K15M. The gas generated
TABLE 2: PROPERTIES OF GRANULES READY FOR COMPRESSION
Formulation Bulk
density (g/ml) density (g/ml)Tapped index (%)Carr’s Angle of repose
F1 0.754±0.07 0.878±0.05 14.12±0.06 32.80±0.11 F2 0.781±0.09 0.899±0.09 13.12±0.05 30.06±0.08 F3 0.784±0.09 0.930±0.11 15.68±0.09 31.33±0.16 F4 0.735±0.12 0.854±0.08 13.93±0.06 32.97±0.12 F5 0.764±0.14 0.891±0.09 14.25±0.13 30.68±0.09 F6 0.782±0.08 0.936±0.08 16.45±0.08 32.16±0.11 F7 0.767±0.09 0.913±0.13 15.99±0.11 31.83±0.12 F8 0.781±0.12 0.927±0.09 15.74±0.05 31.62±0.09 F9 0.792±0.15 0.943±0.11 16.01±0.05 30.85±0.13
Fig. 1: DSC thermogram.
DSC thermogram of (a) S (-) atenolol, (b) excipients (placebo) and (c) its physical mixture.
is trapped and protected within the gel formed by hydration of polymer, thus decreasing the density of tablet. As the density of tablet falls below 1 the tablet becomes buoyant. The buoyancy time of the formulation was affected with the variation in polymer concentration[17]. The buoyancy time of the formulation significantly affected by change in
concentration of HPMC K15M compared to HPMC K100 LV. HPMC K15M plays significant role in
buoyancy as it has higher viscosity and slow erosion
rate compared to HPMC K100 LV. As dissolution
media permeates into core of the matrix, gel layer (rubbery state) grows with time, increasing the
thickness of the gel layer entraps carbon dioxide
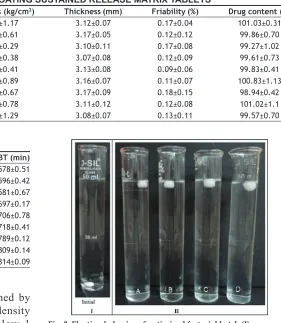
for more time[18]. The optimized factorial batch was
characterized for floating behaviour in 50 ml of 0.1 N hydrochloric acid and its observation shown in fig. 2.
The in vitro drug release profile of floating sustained release matrix tablet represented in fig. 3. The release profile revealed that increase in polymer concentration
slower the drug release. The increase in polymer proportion resulted in increase in viscosity of the tablet matrix gel layer as well as formation of a gel layer with a longer diffusional path. This phenomenon resulted in decrease effective diffusion of the drug and therefore a reduction in drug release rate. The
increase in HPMC K15M concentration significantly
slower the drug release compared to increase in
concentration of HPMC K100 LV. This result revealed
that a polymer of higher viscosity induces greater chain entanglement than a polymer of low viscosity. Therefore, it is harder for longer chains to dissolve because of the high energy required for pulling them off the matrix. Thus, higher viscosity polymers induce
the formation of a thicker gel layer after hydration[18].
The release profile of all factorial batches implied that at initial level drug release faster and decrease in the release rate with time. This is might be due to at an early time, drug close to matrix surface might be released before the surrounding polymer reached the polymer disentanglement concentration (the concentration of the polymer in a fully hydrated state at which there are no polymer–polymer interactions)
because the diffusion coefficients for drug molecules
were higher than the polymer. Especially, the high
viscosity polymers would take longer time to form a
gel layer, within this time; major amount of the drug might have been released[19,20]. The increase in HPMC TABLE 3: CHARACTERISTIC PROPERTIES OF FLOATING SUSTAINED RELEASE MATRIX TABLETS
Formulation Average weight (mg) Hardness (kg/cm2) Thickness (mm) Friability (%) Drug content (%)
F1 125.26±0.64 3.87±1.17 3.12±0.07 0.17±0.04 101.03±0.31 F2 126.63±0.91 3.36±0.61 3.17±0.05 0.12±0.12 99.86±0.70 F3 124.87±1.02 4.51±0.29 3.10±0.11 0.17±0.08 99.27±1.02 F4 125.67±0.83 4.26±0.38 3.07±0.08 0.12±0.09 99.61±0.73 F5 124.26±0.61 4.69±0.41 3.13±0.08 0.09±0.06 99.83±0.41 F6 125.71±0.90 5.12±0.89 3.16±0.07 0.11±0.07 100.83±1.13 F7 124.36±1.24 3.92±0.67 3.17±0.09 0.18±0.15 98.94±0.42 F8 125.12±1.61 5.03±0.78 3.11±0.12 0.12±0.08 101.02±1.1 F9 126.87±1.02 4.21±1.29 3.08±0.07 0.13±0.11 99.57±0.70
TABLE 4: FLT AND BT
Formulation FLT (s) BT (min)
F1 78±0.07 578±0.51
F2 103±0.10 596±0.42
F3 159±0.12 581±0.67
F4 197±0.08 697±0.17
F5 232±0.13 706±0.78
F6 268±0.09 718±0.41
F7 284±0.11 789±0.12
F8 306±0.07 809±0.14
F9 347±0.17 814±0.09
FLT: floating lag time, BT: buoyancy time
Fig. 2: Floating behavior of optimized factorial batch (I).
K100 LV concentration significantly reduces burst
release of s (‑) atenolol at initial level. This might be
due to the faster swelling of HPMC K100 LV forms
gel layer at surrounding.
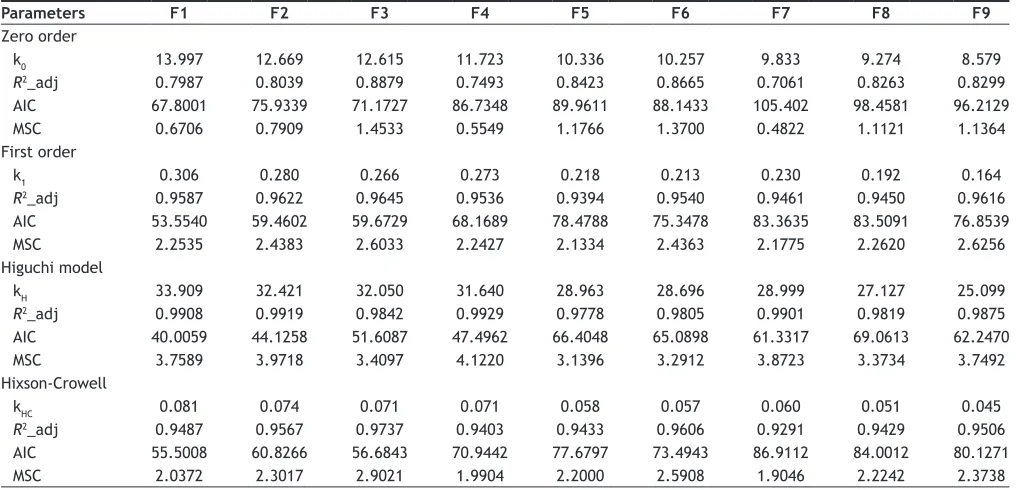
The release profile and kinetics of drug release are
important because they correlate the in vitro and in vivo drug responses by comparing results of
pharmacokinetics and dissolution profile patterns.
Hence, the cumulative drug release results of factorial batches were fixed into different mathematical models. The dissolution modeling gives guidance
for identifying best fit model which remarked as, the best fit model should be the one with the highest R2 adjusted, should have MSC value more than two to three and should have lower AIC value.
It can be highly postulated that in vitro release profile
of all matrix formulation could be best expressed by the Higuchi model (Table 5). The plot showed
high linearity in comparison to other release kinetic
equations. Release of drug from the matrix tablet generally follows diffusion for water soluble drug and erosion or relaxation for water insoluble drug. Diffusion is related to transport drug from the dosage matrix into the in vitro study fluid depending on the concentration gradient between dosage form and in vitro fluid. As gradient varies, the drug is released
and the distance for diffusion increases. This could explain why the drug diffuses at a comparatively slower rate, as the dissolution time increases which is
referred as square root kinetics or Higuchi kinetics. To confirm diffusional mechanism, the data were fitted into Korsmeyer et al.’s equation (Table 6). For matrix tablet, n value 0.5 indicates diffusion controlled value to near 1.00 indicates erosion. Intermediate value suggests simultaneous diffusion and erosion contribute to overall release mechanism[21].
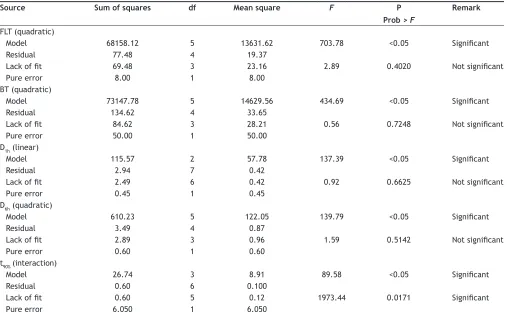
Polynomial models including linear, interaction and quadratic terms were generated for response variables using Design Expert software. The model F‑value
(Table 7) of FLT, BT, D1h, D6h, and t90% implied that the model were significant. There was only a 0.01% chance that a “model F‑value” large could
occur due to noise. FLT, BT, D1h, D6h, and t90% had
0 10 20 30 40 50 60 70 80 90 100 110
0 1 2 3 4 5 6 7 8 9 10 11 12
Cumulative % drug released
Time (h)
Fig. 3: Comparative release profiles of floating sustained release
matrix tablets.
F1, F2, F3, F4, F5, F6, F7,
F8, F9.
TABLE 5: KINETIC MODELING OF DRUG DISSOLUTION PROFILE
Parameters F1 F2 F3 F4 F5 F6 F7 F8 F9
Zero order
k0 13.997 12.669 12.615 11.723 10.336 10.257 9.833 9.274 8.579
R2_adj 0.7987 0.8039 0.8879 0.7493 0.8423 0.8665 0.7061 0.8263 0.8299
AIC 67.8001 75.9339 71.1727 86.7348 89.9611 88.1433 105.402 98.4581 96.2129 MSC 0.6706 0.7909 1.4533 0.5549 1.1766 1.3700 0.4822 1.1121 1.1364 First order
k1 0.306 0.280 0.266 0.273 0.218 0.213 0.230 0.192 0.164
R2_adj 0.9587 0.9622 0.9645 0.9536 0.9394 0.9540 0.9461 0.9450 0.9616
AIC 53.5540 59.4602 59.6729 68.1689 78.4788 75.3478 83.3635 83.5091 76.8539 MSC 2.2535 2.4383 2.6033 2.2427 2.1334 2.4363 2.1775 2.2620 2.6256 Higuchi model
kH 33.909 32.421 32.050 31.640 28.963 28.696 28.999 27.127 25.099
R2_adj 0.9908 0.9919 0.9842 0.9929 0.9778 0.9805 0.9901 0.9819 0.9875
AIC 40.0059 44.1258 51.6087 47.4962 66.4048 65.0898 61.3317 69.0613 62.2470 MSC 3.7589 3.9718 3.4097 4.1220 3.1396 3.2912 3.8723 3.3734 3.7492 Hixson‑Crowell
kHC 0.081 0.074 0.071 0.071 0.058 0.057 0.060 0.051 0.045
R2_adj 0.9487 0.9567 0.9737 0.9403 0.9433 0.9606 0.9291 0.9429 0.9506
AIC 55.5008 60.8266 56.6843 70.9442 77.6797 73.4943 86.9112 84.0012 80.1271 MSC 2.0372 2.3017 2.9021 1.9904 2.2000 2.5908 1.9046 2.2242 2.3738
“Prob>F” less than 0.0500 indicating model terms are
significant. FLT, BT, D1h, D6h had non Significant lack
of fit that implied polynomial model fits all design points well. R2, Adj R2, Pred R2 (Table 8) value above 0.60 implies that the design expert model run
for floating sustained release matrix tablet statistically significant and that can be utilize for modeling the
design space[22,23].
The application of response surface methodology yielded the following regression equations which are an empirical relationship between the logarithmic
values of FLT, BT, D1h, D6h, and t90%. Test variables in
coded units: FLT=+227.14+99.50A+35.83B‑4.50AB‑19
.79A2+8.21B2; BT=+713.43+109.50A+8.17B+5.50AB‑ 13.36A2‑8.36B2; D
1h=+34.01–1.74A‑4.03B; D6h=+67.90–8.73A‑4.46B‑0.87AB+1.58A2 + 2.97B2; t90%=+9.34+1.81A+0.97B+0.59AB.
The polynomial Equation can be used to draw conclusions after considering the magnitude of coefficient and the mathematical sign it carries, (i.e. positive or negative). The positive sign indicate that there is positive reletionship between independent and dependent varibles, and vice a versa.
Three‑dimensional (3D) response surface plots (fig. 4)
TABLE 6: KINETIC MODELING OF DRUG DISSOLUTION PROFILE BY KORSMEYER-PEPPAS MODEL
Parameter F1 F2 F3 F4 F5 F6 F7 F8 F9
KKP 33.434 31.176 26.476 32.466 25.131 23.821 30.683 24.039 22.214
n 0.509 0.522 0.608 0.486 0.573 0.595 0.472 0.559 0.560
TABLE 7: SUMMARY OF ANOVA TABLE FOR DEPENDENT VARIABLES FROM 32 FACTORIAL DESIGN
Source Sum of squares df Mean square F P
Prob > F
Remark
FLT (quadratic)
Model 68158.12 5 13631.62 703.78 <0.05 Significant
Residual 77.48 4 19.37
Lack of fit 69.48 3 23.16 2.89 0.4020 Not significant
Pure error 8.00 1 8.00 BT (quadratic)
Model 73147.78 5 14629.56 434.69 <0.05 Significant
Residual 134.62 4 33.65
Lack of fit 84.62 3 28.21 0.56 0.7248 Not significant
Pure error 50.00 1 50.00 D1h (linear)
Model 115.57 2 57.78 137.39 <0.05 Significant
Residual 2.94 7 0.42
Lack of fit 2.49 6 0.42 0.92 0.6625 Not significant
Pure error 0.45 1 0.45 D6h (quadratic)
Model 610.23 5 122.05 139.79 <0.05 Significant
Residual 3.49 4 0.87
Lack of fit 2.89 3 0.96 1.59 0.5142 Not significant
Pure error 0.60 1 0.60 t90% (interaction)
Model 26.74 3 8.91 89.58 <0.05 Significant
Residual 0.60 6 0.100
Lack of fit 0.60 5 0.12 1973.44 0.0171 Significant
Pure error 6.050 1 6.050
FLT: floating lag time, BT: buoyancy time; t90%: time required to 90% drug release, D1h: percentage of drug release in 1 h, D6h: percentage of drug release in 6 h
TABLE 8: STATISTICAL PARAMETERS
Parameters FLT BT D1h D6h t90%
SD 4.40 5.80 0.65 0.93 0.32 Mean 220.20 700.40 34.01 70.63 9.34 CV % 2.00 0.83 1.91 1.32 3.38 PRESS 538.81 877.64 5.85 21.34 1.27
R2 0.9989 0.9982 0.9752 0.9943 0.9782
Adjusted R2 0.9974 0.9959 0.9681 0.9872 0.9672
Pred R2 0.9921 0.9880 0.9507 0.9652 0.9535
Adeq precision 79.397 52.370 32.488 36.448 27.881
FLT: floating lag time, BT: buoyancy time; t90%: time required to 90% drug
were constructed based on the model polynomial functions using Design Expert software. These plots are very useful to see interaction effects of the factors on the responses (dependent variables).
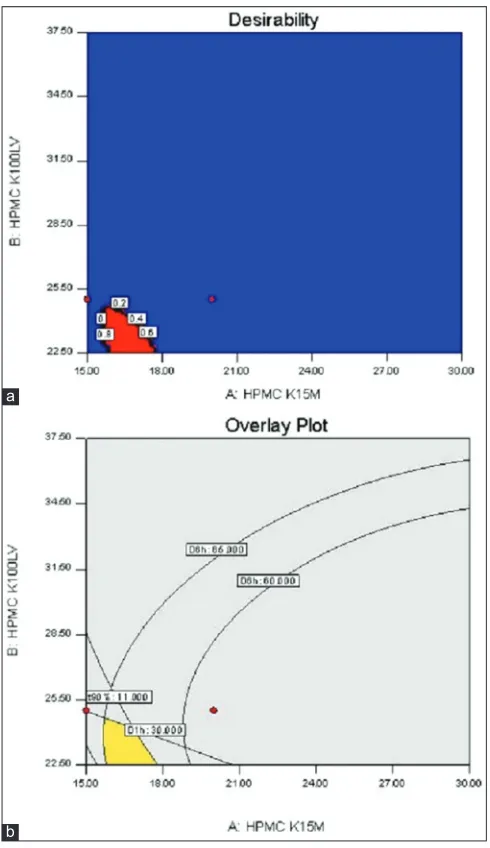
To optimize all the responses with different targets,
a multi criteria decision approach like a numerical
optimization technique by the desirability function and graphical optimization technique by the overlay plot were used (fig. 5). The optimized formulation was obtained by applying constraints on dependent variable responses. Optimized formulation was selected based on the criteria of 30–35% of the drug released at 1 h (D1h), 60–65% of the drug released at 6 h (D6h), and finally 90% of the drug
released in between 10–11 h. The FLT and BT of
floating sustained matrix tablet was omitted in the optimization process as they were not significantly affects the performance of formulation. These
constrains are common for all formulation. The recommended concentrations of the independent variables were calculated by the Design Expert software from the above plots which has the highest desirability near to 1.0. The optimized results obtained to give 39 solutions with therotical target profile characteristics and which were shown in Table 9.
Gastroretentive drug delivery system are promising doasge form for s (‑) atenolol which could be a better alternative to the conventional dosage form in order to improve the bioavilability by increasing the gastric retention time of the drug and to minimize the side
effect. The effervescent based floating drug delivery is
promosing approach to achieve in vitro buoyancy by using gel forming polymer HPMC and gas generating agent sodium bicarbonate. s (‑) atenolol floating tablets prepared by emplyoing 20% w/w HPMC
K15M, 20% w/w HPMC K100 LV and 10% w/w
Fig. 4: Response surface plots.
Response surface plots showing the effect of concentration of HPMC K15M and HPMC K100LV on (a) floating lag time (b) buoyancy time
(c) D1h (d) D6h (e) t90%.
b
d a
c
SB (Formulation F8) was the best formulation with in vitro floating time, buyoancy time and drug release.
A systematic study using 32 factorial design revelead
that concentration of HPMC K15M and HPMC K100 LV significantly affects the percentage drug release. HPMC K100 LV which has lower viscosity and fast swelling rate significantly reduces the initial drug release level while HPMC K15M which has higher viscosity compared to HPMC K100 LV helps
in sustaining the drug release upoto 12 h.
Acknowledgements:
The Authors thanks to Mr. Sanjay Mehta and
Mr. Samit Mehta for their encouragement and support during research.
Financial support and sponsorship:
Nil.
Conflicts of interest:
There are no conflicts of interest.
REFERENCES
1. Mehvar R, Brocks DR. Stereospecific pharmacokinetics and pharmacodynamics of beta‑adrenergic blockers in humans. J Pharm Pharm Sci 2001;4:185‑200.
TABLE 9: SOLUTIONS PROPOSED BY DESIGN EXPERT SOFTWARE
Concentration of
HPMC K15M (%) HPMC K100LV (%)Concentration of D1h (%) D6h (%) t90% (h)
17.37 20.12 33.08 63.99 10.22 18.00 18.75 33.97 64.66 10.09 17.00 22.50 31.30 62.99 10.66 18.00 19.00 33.77 64.34 10.15 16.00 23.00 31.24 64.50 10.35 16.41 22.52 31.48 63.93 10.42 16.69 24.12 30.09 63.22 10.91 19.75 19.37 32.86 61.74 10.86 16.63 23.87 30.32 63.33 10.82 18.36 20.36 32.55 62.40 10.65 19.78 19.12 33.05 62.01 10.80 17.51 22.00 31.52 62.43 10.75 17.76 22.51 31.03 61.83 10.98 17.32 19.68 33.45 64.50 10.09 19.52 18.55 33.60 63.07 10.53 16.29 21.26 32.54 64.76 10.08 18.88 20.00 32.66 62.08 10.74 17.95 19.93 33.04 63.37 10.38 16.81 23.38 30.65 63.06 10.79 17.10 23.29 30.62 62.61 10.90 19.33 18.07 34.05 63.97 10.33 16.21 23.65 30.64 64.04 10.58 19.09 19.48 33.01 62.39 10.66 18.73 20.81 32.05 61.51 10.91 19.89 17.08 34.65 64.98 10.20 17.33 22.36 31.29 62.54 10.76 18.70 18.46 33.96 64.15 10.24 16.94 23.36 30.62 62.86 10.84 18.40 21.43 31.67 61.49 10.96 16.37 24.08 30.24 63.76 10.75 19.92 17.99 33.91 63.45 10.49 17.98 19.53 33.35 63.75 10.29 19.66 18.12 33.90 63.54 10.45 16.75 23.71 30.40 63.12 10.84 16.88 23.63 30.43 62.92 10.88 18.33 21.12 31.94 61.80 10.85 16.97 20.39 33.01 64.35 10.14 17.07 22.83 31.00 62.78 10.77 16.25 24.04 30.32 63.96 10.69
HPMC K15M: hydroxypropyl methylcellulose K15M, HPMCK100LV: hydroxypropyl methylcellulose K100LV, t90%: time required to 90% drug release, D1h: Percentage of drug release in 1 h, D6h: Percentage of drug release in 6 h
Fig. 5: Desirability plot and Overlay plot for optimization formulation.
(a) Desirability plot (b) Overlay plot for optimization of floating
sustained release matrix tablet. a
2. Stoschitzky K, Egginger G, Zernig G, Klein W, Lindner W. Stereoselective features of (R)‑ and (S)‑atenolol: Clinical pharmacological, pharmacokinetic, and radioligand binding studies. Chirality 1993;5:15‑9.
3. Clementi WA, Garvey TQ, Clifton GD, McCoy RA, Brandt S, Schwartz S. Single dose pharmacokinetics of (S)‑atenolol administered orally as a single enantiomer formulation and as a racemic mixture (Tenormin). Chirality 1994;6:169‑74.
4. Pearson AA, Gaffney TE, Walle T, Privitera PJ. A stereoselective central hypotensive action of atenolol. J Pharmacol Exp Ther 1989;250:759‑63. 5. Mehvar R, Gross ME, Kreamer RN. Pharmacokinetics of atenolol
enantiomers in humans and rats. J Pharm Sci 1990;79:881‑5. 6. Srivastava AK, Wadhwa S, Ridhurkar D, Mishra B. Oral sustained
delivery of atenolol from floating matrix tablets‑formulation and in vitro evaluation. Drug Dev Ind Pharm 2005;31:367‑74.
7. Melander A, Stenberg P, Liedholm H, Scherstén B, Wåhlin‑Boll E. Food‑induced reduction in bioavailability of atenolol. Eur J Clin Pharmacol 1979;16:327‑30.
8. Gangadharappa HV, Balamuralidhara V, Pramod Kumar TM. Formulation and in vitro evaluation of gastric floating tablets of atenolol. J Pharm Res 2010;3:1450‑5.
9. Havaldar VD, Kulkarni AS, Dias RJ, Aloorkar NH, Mali KK. Floating matrix tablet of atenolol: Formulation and in vitro evaluation. Asian J Pharm 2009;3:286‑91.
10. Dey S, Dutta S, Mazumdar B. Formulation and evaluation of floating matrix tablet of atenolol for gastroretentive drug delivery. Int J Pharm Pharm Sci 2012;4:433‑7.
11. Robinson JR, Eriksen SP. Theoretical formulation of sustained‑release dosage forms. J Pharm Sci 1966;55:1254‑63.
12. Zhang Y, Huo M, Zhou J, Zou A, Li W, Yao C, et al. DDSolver: An add‑in program for modeling and comparison of drug dissolution profiles. AAPS J 2010;12:263‑71.
13. Costa P, Sousa Lobo JM. Modeling and comparison of dissolution profiles. Eur J Pharm Sci 2001;13:123‑33.
14. Meka VS, Nali SR, Songa AS, Battu JR, Kolapalli VR. Statistical
optimization of a novel excipient (CMEC) based gastro retentive floating tablets of propranolol HCl and it’s in vivo buoyancy characterization in healthy human volunteers. Daru 2012;20:21. 15. Baumgartner S, Kristl J, Vrecer F, Vodopivec P, Zorko B. Optimisation
of floating matrix tablets and evaluation of their gastric residence time. Int J Pharm 2000;195:125‑35.
16. Singh BN, Kim KH. Floating drug delivery systems: An approach to oral controlled drug delivery via gastric retention. J Control Release 2000;63:235‑59.
17. The DOW Chemical Company. Using DOW Excipients for Controlled Release of Drugs in Hydrophilic Matrix System; 2006. Available from: http://www.msdssearch.dow.com/PublishedLiteratureDOWCOM/ dh_0379/0901b803803797ad.pdf?filepath=methocel/pdfs/noreg/198‑02075. pdf&fromPage=GetDoc. [Last accessed on 2015 Jan 31].
18. Hiremath PS, Saha RN. Controlled release hydrophilic matrix tablet formulations of isoniazid: Design and in vitro studies. AAPS PharmSciTech 2008;9:1171‑8.
19. Rajabi‑Siahboomi AR, Bowtell RW, Mansfield P, Davies MC, Melia CD. Structure and behavior in hydrophilic matrix sustained release dosage forms: 4. Studies of water mobility and diffusion coefficients in the gel layer of HPMC tablets using NMR imaging. Pharm Res 1996;13:376‑80.
20. Li L, Sun H, Gao J, Jiang T, Gao Y, Zhang J. Optimization of sustained release matrix tablet of metoprolol succinate using central composite design. Pak J Pharm Sci 2013;26:929‑37.
21. Bose A, Wong TW, Singh N. Formulation development and optimization of sustained release matrix tablet of Itopride HCl by response surface methodology and its evaluation of release kinetics. Saudi Pharm J 2013;21:201‑13.
22. Prajapati ST, Patel LD, Patel DM. Gastric floating matrix tablets: Design and optimization using combination of polymers. Acta Pharm 2008;58:221‑9.