RESEARCH
Risk stratification using SpO
2
/FiO
2
and PEEP at initial ARDS diagnosis and after 24 h
in patients with moderate or severe ARDS
Luigi Pisani
1,8*†, Jan‑Paul Roozeman
1†, Fabienne D. Simonis
1,2†, Antonio Giangregorio
1, Sophia M. van
der Hoeven
1,2, Laura R. Schouten
1,4, Janneke Horn
1, Ary Serpa Neto
1,6, Emir Festic
7, Arjen M. Dondorp
1,8,
Salvatore Grasso
3, Lieuwe D. Bos
1,2,5, Marcus J. Schultz
1,2,8and for the MARS consortium
Abstract
Background: We assessed the potential of risk stratification of ARDS patients using SpO2/FiO2 and positive end‑ expiratory pressure (PEEP) at ARDS onset and after 24 h.
Methods: We used data from a prospective observational study in patients admitted to a mixed medical–surgical intensive care unit of a university hospital in the Netherlands. Risk stratification was by cutoffs for SpO2/FiO2 and PEEP. The primary outcome was in‑hospital mortality. Patients with moderate or severe ARDS with a length of stay of > 24 h were included in this study. Patients were assigned to four predefined risk groups: group I (SpO2/FiO2≥ 190 and PEEP < 10 cm H2O), group II (SpO2/FiO2≥ 190 and PEEP ≥ 10 cm), group III (SpO2/FiO2 < 190 and PEEP < 10 cm H2O) and group IV (SpO2/FiO2 < 190 and PEEP ≥ 10 cm H2O).
Results: The analysis included 456 patients. SpO2/FiO2 and PaO2/FiO2 had a strong relationship (P < 0.001, R2= 0.676) that could be described in a linear regression equation (SpO2/FiO2= 42.6 + 1.0 * PaO2/FiO2). Risk stratification at initial ARDS diagnosis resulted in groups that had no differences in in‑hospital mortality. Risk stratification at 24 h resulted in groups with increasing mortality rates. The association between group assignment at 24 h and outcome was con‑ founded by several factors, including APACHE IV scores, arterial pH and plasma lactate levels, and vasopressor therapy. Conclusions: In this cohort of patients with moderate or severe ARDS, SpO2/FiO2 and PaO2/FiO2 have a strong linear relationship. In contrast to risk stratification at initial ARDS diagnosis, risk stratification using SpO2/FiO2 and PEEP after 24 h resulted in groups with worsening outcomes. Risk stratification using SpO2/FiO2 and PEEP could be practical, especially in resource‑limited settings.
Keywords: Acute respiratory distress syndrome (ARDS), Pulse oximetry, Blood gas analysis, Positive end‑expiratory pressure (PEEP), Classification, Risk stratification, Outcome, Mortality
© The Author(s) 2017. This article is distributed under the terms of the Creative Commons Attribution 4.0 International License (http://creativecommons.org/licenses/by/4.0/), which permits unrestricted use, distribution, and reproduction in any medium, provided you give appropriate credit to the original author(s) and the source, provide a link to the Creative Commons license, and indicate if changes were made.
Introduction
In the Berlin definition for acute respiratory distress syn-drome (ARDS), risk stratification was suggested by catego-rizing patients as having ‘mild,’ ‘moderate’ or ‘severe’ ARDS based on the ratio of the arterial oxygen tension (PaO2)
to the fraction of inspired oxygen (FiO2) at initial diagno-sis [1]. This approach knows several challenges. First, it requires invasive and expensive arterial blood sampling and analysis that is frequently not available, in particular in resource-limited settings. Second, the robustness of this way of classifying patients was not confirmed by external validation [2]. Most important, though, is that the level of positive end-expiratory pressure (PEEP) may affect the PaO2/FiO2 [3] and that PaO2/FiO2 and PEEP collected at later time points, for instance 24 h after the initial ARDS diagnosis, largely improve risk stratification [4, 5].
Open Access
*Correspondence: [email protected]
†Luigi Pisani, Jan‑Paul Roozeman, and Fabienne D. Simonis contributed
equally to this work
1 Department of Intensive Care, Academic Medical Center, Meibergdreef
9, 1105 AZ Amsterdam, The Netherlands
Due to the sigmoidal nature of the oxyhemoglobin dis-sociation curve, the pulse oximetry saturation (SpO2) may serve as a reliable alternative for the PaO2 in patients with SpO2 levels lower than 97% [6]. Indeed, patients with ARDS diagnosed by means of the SpO2/FiO2 have similar characteristics and outcomes as patients in whom ARDS is diagnosed using the PaO2/FiO2 [7], and persis-tence of a high oxygen saturation index at 24 h has been found to be associated with worse outcomes in cases of pediatric ARDS [8]. As pulse oximetry is noninvasive, inexpensive and widely available, SpO2/FiO2 could serve as an attractive alternative for PaO2/FiO2 in risk stratifi-cation of ARDS patients.
The overarching aim of the present investigation was to determine whether classification of patients using SpO2/FiO2 and PEEP at initial ARDS diagnosis and after 24 h could be used to stratify for risk of mortality. Spe-cifically, we hypothesized that the SpO2/FiO2 could serve as an alternative for the PaO2/FiO2 in risk classification and that re-classification using SpO2/FiO2 and PEEP after 24 h improves risk stratification in a cohort of consecu-tive adult patients with moderate or severe ARDS in an intensive care unit (ICU) in the Netherlands.
Methods
Study design
We used data from a prospective observational conveni-ently sized cohort of well-defined critically ill patients admitted to the mixed surgical–medical intensive care unit of one university hospital in the Netherlands [9]. These data were matched with nurse-validated oxygena-tion data at baseline and after 24 h that was retrospec-tively collected from the patient data management system (Metavision®, iMDSoft, Tel Aviv, Israel). The Institutional Review Board of the Academic Medical Center approved the parent study protocol and use of an ‘opt-out’ consent method (IRB no. 10-056C).
Inclusion and exclusion criteria
A team of trained ICU researchers scored patients for the absence or presence of ARDS according to the criteria stated by the American–European Consensus Confer-ence on ARDS [10]. Although this study started in 2011 (i.e., before publication of the Berlin definition for ARDS [1]), all patients diagnosed with ARDS fulfilled the crite-ria of the latest definition for ARDS. Patients with mild ARDS were excluded as were patients discharged or transferred to another ICU before 24 h after the initial ARDS diagnosis.
Outcomes
The primary outcome was all-cause in-hospital mor-tality. Secondary outcomes included ICU mortality,
30- and 90-day, and 1-year mortality, and the number of ventilator-free days and alive at day 28 (VFD-28), defined as the number of days from days 1 to 28 that the patient is alive and breathing without invasive assis-tance of the mechanical ventilator for at least 24 con-secutive hours.
Data collection
At initial ARDS diagnosis and after 24 h, pulse oxime-try results were retrospectively collected, and the cor-responding SpO2/FiO2 was calculated. For this, we first collected ten successive nurse-validated SpO2 and FiO2 values over 10 min directly preceding, and at the time, an arterial blood sample was drawn for blood gas analysis. The median of these ten SpO2 and FiO2 values was used to calculate the SpO2/FiO2 to alleviate potential arti-factual SpO2 values. In all patients, pulse oximetry was measured by conventional two-wavelength finger pulse oximeters. The local protocol dictated a change in finger position every 3–4 h to avoid decubitus lesions and to use alternative probes, such as nose and forehead probes, only in patients in whom no adequate signal could be obtained with a conventional pulse oximeter on a finger. In addition to this, PaO2 and PaCO2 levels, pH levels and body temperature were collected, and it was determined whether or not patients received treatment with vaso-pressors at both time points.
Baseline data collected from the original database included demographic and ventilator data, comorbidi-ties, admission type, patient category and cause of ARDS. The Acute Physiology and Chronic Health Evaluation (APACHE) IV score [11], the Lung Injury Prediction Score [12] and Charlson comorbidity score [13] were calculated.
Analysis plan
The correlation between SpO2/FiO2 and PaO2/FiO2 was studied only using SpO2/FiO2 and PaO2/FiO2 at initial ARDS diagnosis. SpO2 values of > 97% were excluded from the correlation analysis as the oxyhemoglobin dis-sociation curve flattens above this level and large changes in the PaO2 may result in little or no change in the SpO2, in line with previous investigations that analyzed this relationship [6, 14, 15]. A nonlinear equation (the ‘Ellis formula’) was also used to estimate PaO2/FiO2 from SpO2 and FiO2 values [16, 17].
cutoff for PEEP as in two previous studies [4, 5]. Accordingly, we created four groups: SpO2/FiO2 ≥ 190 and PEEP < 10 cm H2O (group I); SpO2/FiO2 ≥ 190 and PEEP ≥ 10 cm (group II); SpO2/FiO2 < 190 and PEEP < 10 cm H2O (group III); and SpO2/FiO2 < 190 and PEEP ≥ 10 cm H2O (group IV). The comparison among groups included all pairwise compari-sons across the four risk groups.
Statistical analysis
Data were expressed as mean ± standard deviation (SD), median with interquartile range (IQR) or number with percentage, where appropriate.
A two-way scatterplot and Pearson correlation analy-sis were used to characterize the relationship between SpO2/FiO2 (linear and nonlinear estimations) and PaO2/ FiO2. Linear regression allowed quantification of the best regression line and derive a predictive equation for the relationship. Hence, based on the derived regres-sion equation, we obtained the SpO2/FiO2 values that correspond to PaO2/FiO2 ratio values of 100, 150 and 200 mmHg. PaCO2, arterial pH, body temperature, PEEP and use of vasopressors were tested as interaction terms in the model to evaluate moderation of the association between SpO2/FiO2 and PaO2/FiO2. The area under the receiver operating characteristic (ROC) curve evaluated the applicability of SpO2/FiO2 in discriminating moder-ate from severe ARDS.
Differences between risk groups were tested with the Pearson Chi-square or Fisher exact test for categorical variables and with one-way ANOVA or Kruskal–Wallis test for continuous variables. In-hospital mortality and other mortality endpoints were calculated for each of the four groups, and a P value for trend was calculated from a chi-squared test for trend in proportions (i.e., the Cochrane–Armitage test), testing the null hypothesis that the proportions in several groups are the same. A pair-wise comparison at ARDS diagnosis and after 24 h was performed using a contrast matrix predictor approach in which odd ratios (ORs) and 95% confidence intervals are generated for each mutual comparison between groups.
Post hoc analyses
Several post hoc analyses were performed. First, we evaluated whether transforming the data to fractions (1/ PaO2/FiO2 and 1/SpO2/FiO2) improved the fit between SpO2/FiO2 and PaO2/FiO2, as previously reported [18].
Second, risk classification using the Berlin definition threshold for severe ARDS (i.e., 100 mm Hg) [6] was performed.
Third, in the last post hoc analysis we analyzed whether the association between risk stratification and in-hospital mortality was confounded by factors such as disease sever-ity, and other readily available parameters in the database,
such as arterial pH and plasma lactate levels, blood pres-sure levels and vasopressor therapy. For this analysis, a multivariable logistic regression model was built to assess the confounding effect of these variables on the associa-tion between risk groups and the primary outcome.
All analyses were performed in R via the R-studio inter-face (R version 3.0, www.r-project.org). A P value below 0.05 was considered significant.
Results
Patients
Of 554 patients with ARDS, 456 were classified as having moderate or severe ARDS according to the Berlin defi-nition and had complete datasets. Of them, 382 could be used for the correlation analyses, and all patients for the classification and re-classification analyses (Fig. 1). Pneumonia, sepsis, major surgery and trauma were the most common causes of ARDS (Table 1). At baseline, there were no differences between survivors and non-survivors with regard to oxygenation parameters, tidal volume size, the Lung Injury Prediction Score and the etiology of ARDS. Also, there were no differences with regard to the comorbidity score. Overall all-cause in-hospital mortality rate was 39.7%. Non-survivors were older, had a lower arterial pH levels at ARDS diagno-sis, were ventilated at higher respiratory rates and had higher disease severity scores. Berlin definition class distribution was not different between survivors and non-survivors.
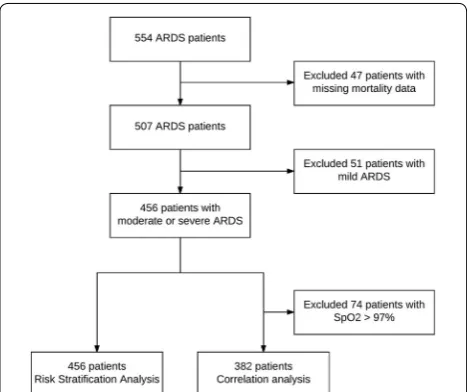
Relationship between SpO2/FiO2 and PaO2/FiO2
The correlation between SpO2/FiO2 and PaO2/FiO2 was strong (P < 0.001, R2 = 0.676; Fig. 2) and could be described in a linear regression equation:
This relationship was neither moderated by arterial PaCO2 and PEEP, nor by body temperature and vasopres-sor therapy. There was a moderation effect by arterial pH and FiO2, as the steepness of the slope between PaO2/ FiO2 and SpO2/FiO2 was inclined by arterial pH (1.4,
P < 0.001) and declined by FiO2 (− 0.01, P < 0.001). Based on the found equation, a PaO2/FiO2 of 200 mm Hg corresponded to a SpO2/FiO2 of 243 [95% CI 220– 265], a PaO2/FiO2 of 150 mm Hg to a SpO2/FiO2 of 193 [95% CI 174–211] and a PaO2/FiO2 of 100 mm Hg to a SpO2/FiO2 of 143 [95% CI 127–158].
The SpO2/FiO2 had an excellent ability to discriminate moderate from severe ARDS, with a ROC area under the curve of 0.928 (Fig. 3). The nonlinear formula (Ellis for-mula) to estimate the PaO2/FiO2 from the SpO2 and FiO2 was not superior to the linear model when SpO2 ≤ 97% (N = 382, R2 = 0.656).
The use of fractions (1/SpO2/FiO2 and 1/PaO2/ FiO2) did not result in a stronger linear relationship (R2 = 0.629). The regression equation, though, was very similar to one previously reported in pediatric patients (1/SpO2/FiO2 = 0.0024 + 0.46/PaO2/FiO2) [18].
SpO2/FiO2=42.6+1.00∗PaO2/FiO2
Risk stratification
The distribution and outcome data for the four risk groups are presented in Table 2. There was no trend for Table 1 Baseline characteristics of 456 survivors and non-survivors with moderate and severe ARDS
Categorical variables: number (percentage); continuous variables: median (25–75 percentile)
PEEP positive end-expiratory pressure, FiO2 fraction of inspired oxygen, PaCO2 arterial carbon dioxide tension, PaO2 arterial oxygen tension, SpO2 pulse oximetry
saturation, ARDS acute respiratory distress syndrome, APACHE IV acute physiology and chronic evaluation IV
Variables All patients Survivors
N = 275 Non-survivorsN = 181 P value
Age, years 62 (51–72) 60 (48–70) 63 (55–72) 0.008
Female 113 (41.1) 59 (32.6) 0.075
Weight, kg 80 (70–90) 80 (70–90) 80 (68–87) 0.347 APACHE IV 68 (51–89) 72 (58–95) 90 (74–113) < 0.001 Charlson comorbidity index 2 1 (0–3) 1 (0–2) 1 (0–3) 0.103 Lung Injury Prediction Score 8.5 (7–10) 8 (6.5–10) 9 (7–10) 0.074 Tidal volume, ml/kg 6.3 (5.3–7.6) 6.3 (5.3–7.8) 6.3 (5.4–7.3) 0.412 Respiratory rate 23 (17–29) 20 (16–27) 25 (19–30) 0.001 PEEP, cmH2O 10 (8–12) 10 (8–12) 10 (8–13) 0.436 FiO2, % 60 (50–75) 60 (50–70) 60 (50–80) 0.462 Arterial pH 7.34 (7.26–7.41) 7.35 (7.28–7.41) 7.31 (7.22–7.39) 0.001 PaCO2, kPa 5.8 (5.1–6.9) 5.7 (5–6.9) 6 (5.2–7.3) 0.072 PaO2/FiO2 120 (89–149) 123 (91–149) 115 (89–149) 0.353 SpO2/FiO2 160 (126–190) 163 (127–191) 157 (124–190) 0.344 Vasopressor use in first 24 h 293 (64.3) 164 (59.6) 129 (71.3) 0.015 ARDS class
Moderate ARDS 300 (65.8) 181 (65.8) 119 (65.7) 1 Severe ARDS 156 (34.2) 94 (34.2) 62 (34.3) 1 Cause of ARDS
Pulmonary origin 325 (71.3) 200 (72.7) 125 (69.1) 0.732 Non‑pulmonary origin 185 (40.6) 104 (37.8) 81 (44.8) 0.382
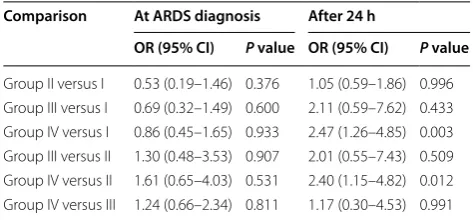
increasing in-hospital mortality rate among the four risk groups at baseline (P value for trend = 0.90). A pairwise comparison also showed no significant differences in hospital mortality between groups at ARDS diagnosis. In contrast, the same categorization after 24 h resulted in risk groups with increasing rates of in-hospital mor-tality (P value for trend < 0.001). A pairwise compari-son showed that the differences in in-hospital mortality
between group IV and group II (OR 2.40 [1.15–4.82];
P value = 0.012), and between group IV and group I were significant (OR 2.47 [1.26–4.85]; P value = 0.003) (Table 3).
Findings were comparable for the secondary outcomes. While classification using cutoffs for SpO2/FiO2 and PEEP at initial ARDS diagnosis were not related to any of these outcomes, risk stratification at 24 h resulted in sig-nificant positive trends across groups, and sigsig-nificantly worse secondary outcomes in group IV compared to group I and to group II (Additional file 1: Table E1).
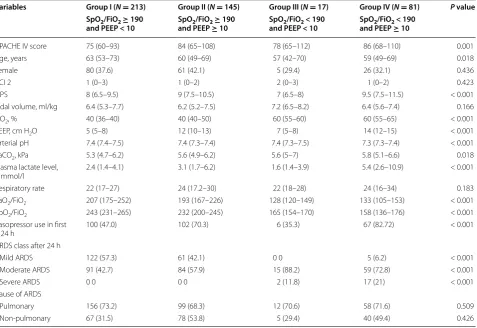
Distribution of patients in each subset noticeably changed at 24 h. Less than a quarter of patients main-tained to have SpO2/FiO2 < 190; their in-hospital mortal-ity was much higher than that of patients with a SpO2/ FiO2 ≥ 190 (56.1 vs. 35.2%, P = 0.001). Half of the patients were ventilated at PEEP < 10 cm H2O; their in-hospital mortality was similar to that of patients who were kept at PEEP ≥ 10 cm H2O (36.1 vs. 43.4 P = 0.107). When considering the characteristics of the four risk groups at 24 h, we found statistical differences in the APACHE IV score, arterial pH and FiO2 at 24 h, maximum plasma lac-tate levels and vasopressor use, which could explain the significant differences in outcome (Table 3).
Post hoc analyses
The post hoc analysis with the adapted SpO2/FiO2 cutoff of 150, in line with the Berlin definition cutoff of PaO2/ FiO2 of 100 mm Hg, showed similar results to the pri-mary analysis, albeit group sizes changed. No trends in risk were observed other than for ICU mortality when
Fig. 3 ROC curve for SpO2/FiO2 versus PaO2/FiO2 < 100. Dotted lines represent 95% confident intervals, AUC = 0.928. AUC, area under the curve
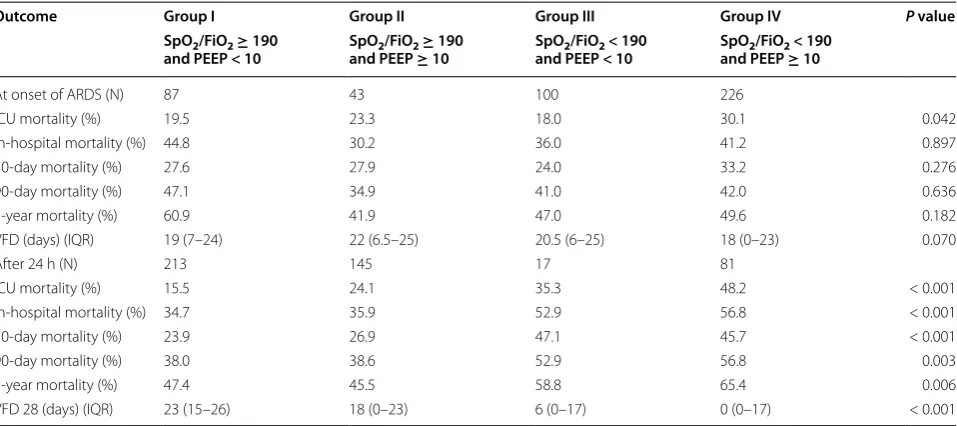
Table 2 Distribution and outcomes of each subset of patients with ARDS at initial diagnosis and after 24 h
VFD-28 ventilator-free days and alive at day 28, IQR interquartile range, CI confidence interval
Outcome Group I Group II Group III Group IV P value SpO2/FiO2 ≥ 190
and PEEP < 10 and PEEP SpO2/FiO2≥ ≥ 10 190 and PEEP < 10SpO2/FiO2 < 190 SpOand PEEP 2/FiO2≥ < 190 10 At onset of ARDS (N) 87 43 100 226
ICU mortality (%) 19.5 23.3 18.0 30.1 0.042 In‑hospital mortality (%) 44.8 30.2 36.0 41.2 0.897 30‑day mortality (%) 27.6 27.9 24.0 33.2 0.276 90‑day mortality (%) 47.1 34.9 41.0 42.0 0.636 1‑year mortality (%) 60.9 41.9 47.0 49.6 0.182 VFD (days) (IQR) 19 (7–24) 22 (6.5–25) 20.5 (6–25) 18 (0–23) 0.070
After 24 h (N) 213 145 17 81
using this cutoff at onset of ARDS, while a significant trend across the four risk groups was noted using this cutoff after 24 h (Additional file 1: Table E2). The inter-group comparisons also mirrored the primary analysis, with no significant contrasts at ARDS diagnosis, but clear contrast after 24 h (group IV vs. group I and II) (Addi-tional file 1: Table E3).
The multivariable model showed that APACHE IV scores, plasma lactate levels and arterial pH significantly confounded the relationship between the group stratifi-cation and in-hospital mortality (Additional file 1: Table E4). The same applied when restricting this analysis to the extreme risk groups (i.e., groups I and IV), in which even vasopressor therapy was a significant confounder (Additional file 1: Table E5).
Discussion
To our best knowledge, this is the first study in which ARDS patients were classified using predefined cut-off values for SpO2/FiO2 and PEEP. The most relevant findings of this study are: (1) SpO2/FiO2 confirms to be a valid surrogate for PaO2/FiO2 in patients with moder-ate or severe ARDS; (2) re-classification after 24 h using predefined cutoffs for SpO2/FiO2 and PEEP improves risk stratification compared to the same cutoffs at baseline; and (3) the association between risk group and outcome, however, is confounded by disease severity, arterial pH and lactate levels, and vasopressor therapy. We believe that the approach of using SpO2/FiO2 and PEEP to clas-sify patients could be useful for the implementation of an individualized approach for appropriate diagnosis and therapy in ARDS patients, in particular in settings where it is difficult, if not impossible, to perform (repeated) blood gas analyses (Table 4).
Our study has several strengths. The prospective design of the collection of data, the completeness of follow-up and the fact that the ARDS diagnosis was scored by a team of trained ICU researchers prevented against bias.
In addition, we could re-categorize patients from the cri-teria stated by the American–European Consensus Con-ference on ARDS [10] to the newer Berlin definition for ARDS [1], after we could select patients with moderate or severe ARDS. Finally, the number of participants was large, patients were homogeneous regarding their clini-cal characteristics as well as type of ARDS and the overall in-hospital mortality rate of our cohort was comparable to the pooled mortality for moderate and severe ARDS patients in the recently published LUNG SAFE study [19].
SpO2/FiO2 is an increasingly appreciated parameter in the diagnosis and management of patients with ARDS [6, 15, 17, 20, 21]. The current pediatric ARDS definition includes oximetry-based measures in preference of the PaO2/FiO2, captured in the oxygenation saturation index [22]. Unfortunately, mean airway pressures, necessary for calculation of the oxygenation saturation index, were not reliably captured in our cohort preventing us from com-paring our results to those from previous studies in chil-dren [8, 18, 23]. We used a previously reported equation (SpO2/FiO2 = 64 + (0.84 * PaO2/FiO2) [6] to convert a previously used cutoff for PaO2/FiO2 (i.e., 150 mm Hg) to a cutoff for SpO2/FiO2 of 190. Using the equation that came from our own data a very similar cutoff for SpO2/ FiO2 would have been chosen. Due to its increased fea-sibility, the SpO2/FiO2 was actually considered for inclu-sion during the Berlin criteria definition process [24], but was successively excluded on the possibility that it may misclassify mild into severe ARDS patients. A cutoff for PaO2/FiO2 of 150 mm Hg has frequently been shown to accurately stratify for in-hospital mortality [4, 5, 25] and was also used in two of the largest, and ultimately posi-tive, randomized controlled trials in ARDS patients [26,
27].
The present findings on the relationship between SpO2/ FiO2 and PaO2/FiO2 mirror results from previous investi-gations in adult [6, 15] and pediatric patients [14, 18, 23,
28], albeit that a marginally different regression equation was found. One investigation did not find a strong rela-tionship between SpO2/FiO2 and PaO2/FiO2, but in that study the data were collected from automated anesthesia information system with a very high portion of the data excluded due to high SpO2 values [29]. Recently, the lin-ear relation between SpO2/FiO2 and PaO2/FiO2 was re-challenged and both a fractional transformation [14] and a nonlinear imputation method [17, 30] were proposed to improve the model fit or better represent the sigmoidal shape of the oxyhemoglobin dissociation curve. Despite the clear physiological rationale, these approaches did not improve the relationship in the present dataset.
It has been described before that FiO2 at levels > 70% alters the PaO2/FiO2: an increase in FiO2 > 70% gradually Table 3 Intergroup comparisons at ARDS diagnosis
and after 24 h for in-hospital mortality
ARDS acute respiratory distress syndrome, OR odd ratio, CI confidence interval
Comparison At ARDS diagnosis After 24 h
OR (95% CI) P value OR (95% CI) P value
increases the PaO2/FiO2 [31], particularly at low lev-els of shunt fraction [32]. The effect of FiO2 on SpO2/ FiO2, however, could be opposite as pulse oximetry has an intrinsic upper limit much tighter than PaO2. An increase in FiO2 will gradually decrease the SpO2/FiO2. This intrinsic mathematical limitation of the SpO2/FiO2 can possibly lead to misclassification of individual ARDS cases. Of note, FiO2 > 70% was used in 25% of patients at ARDS diagnosis, and only in 3% after 24 h.
The level of PEEP is known to be particularly relevant as the evolution and prognosis of ARDS are related to changes in PaO2/FiO2 in response to changes in PEEP greater than or equal to 10 cm H2O [3, 33, 34]. While PEEP does not affect the oxyhemoglobin curve and may not significantly alter the relationship between SpO2 and PaO2 [15], it may impact the SpO2/FiO2 ratio by improv-ing ventilation–perfusion matchimprov-ing and thus was consid-ered in our analysis. Of note, the approach of using PaO2/ FiO2, or SpO2/FiO2, and PEEP is not new. Indeed, risk
classification in the Berlin definition uses PaO2/FiO2 and PEEP levels [1], though only at onset of ARDS and not after 24 h of standard care. The empathic aim of the pre-sent investigation was to see whether two easy to collect and almost always-available ventilator parameters, even in resource-limited settings, i.e., SpO2/FiO2 and PEEP, would alter risk groups.
Despite several classification and prediction systems for ARDS patients [1, 3, 25, 33, 35–37], we still lack a proper classification system for clinical management and research purposes that can serve as a practical model for setting individual therapeutic targets. Several investiga-tions have shown that the PaO2/FiO2 measured at onset of ARDS cannot be used for risk stratification in patients with moderate or severe ARDS [35, 38–41]. Recently, it was shown that standardization of ventilator settings at the moment of collecting PaO2/FiO2 data [33] as well as re-categorization based on both PaO2/FiO2 and PEEP level cutoffs, measured 24 h after the initial ARDS Table 4 Main characteristics of 456 patients with ARDS—classification 24 h after initial ARDS diagnosis based on SpO2/
FiO2 cutoff of 190 and PEEP cutoff of 10 cm H2O
Categorical variables: number (percentage); continuous variables: median (25–75 percentile)
CCI Charlson Comorbidity Index, LIPS Lung Injury Prediction Score, APACHE acute physiology and chronic health evaluation, PEEP positive end-expiratory pressure, FiO2 fraction of inspired oxygen, PaCO2 arterial carbon dioxide tension, PaO2 arterial oxygen tension, SpO2 pulse oximetry oxygen saturation, ARDS acute respiratory
distress syndrome
Variables Group I (N = 213) Group II (N = 145) Group III (N = 17) Group IV (N = 81) P value SpO2/FiO2 ≥ 190
and PEEP < 10 and PEEP SpO2/FiO2≥ ≥ 10 190 and PEEP < 10SpO2/FiO2 < 190 SpOand PEEP 2/FiO2≥ < 190 10
APACHE IV score 75 (60–93) 84 (65–108) 78 (65–112) 86 (68–110) 0.001 Age, years 63 (53–73) 60 (49–69) 57 (42–70) 59 (49–69) 0.018 Female 80 (37.6) 61 (42.1) 5 (29.4) 26 (32.1) 0.436 CCI 2 1 (0–3) 1 (0–2) 2 (0–3) 1 (0–2) 0.423 LIPS 8 (6.5–9.5) 9 (7.5–10.5) 7 (6.5–8) 9.5 (7.5–11.5) < 0.001 Tidal volume, ml/kg 6.4 (5.3–7.7) 6.2 (5.2–7.5) 7.2 (6.5–8.2) 6.4 (5.6–7.4) 0.166 FiO2, % 40 (36–40) 40 (40–50) 60 (55–60) 60 (55–65) < 0.001 PEEP, cm H2O 5 (5–8) 12 (10–13) 7 (5–8) 14 (12–15) < 0.001 Arterial pH 7.4 (7.4–7.5) 7.4 (7.3–7.4) 7.4 (7.3–7.5) 7.3 (7.3–7.4) < 0.001 PaCO2, kPa 5.3 (4.7–6.2) 5.6 (4.9–6.2) 5.6 (5–7) 5.8 (5.1–6.6) 0.018 Plasma lactate level,
mmol/l 2.4 (1.4–4.1) 3.1 (1.7–6.2) 1.6 (1.4–3.9) 5.4 (2.6–10.9) < 0.001 Respiratory rate 22 (17–27) 24 (17.2–30) 22 (18–28) 24 (16–34) 0.183 PaO2/FiO2 207 (175–252) 193 (167–226) 128 (120–149) 133 (105–153) < 0.001 SpO2/FiO2 243 (231–265) 232 (200–245) 165 (154–170) 158 (136–176) < 0.001 Vasopressor use in first
24 h 100 (47.0) 102 (70.3) 6 (35.3) 67 (82.72) < 0.001 ARDS class after 24 h
Mild ARDS 122 (57.3) 61 (42.1) 0 0 5 (6.2) < 0.001 Moderate ARDS 91 (42.7) 84 (57.9) 15 (88.2) 59 (72.8) < 0.001 Severe ARDS 0 0 0 0 2 (11.8) 17 (21) < 0.001 Cause of ARDS
diagnosis, largely improves risk stratification for hospi-tal morhospi-tality [4, 5]. The findings of the present study are in agreement with and extend these findings showing for the first time that pulse oximetry after 24 h perform better than at the initial ARDS diagnosis in short- and long-term outcome stratification in adult patients with moderate or severe ARDS. Similar findings derive from the pediatric population, where oximetry derived indexes after 24 h reliably stratified outcome while initial values were not helpful in prognostication [8].
In the studied cohort of patients with moderate or severe ARDS, improvement or worsening of the SpO2/ FiO2 in the first 24 h was strongly associated with out-come. Group I represents the less complicated patients with ARDS and a great portion of our patients fit in this group after 24 h (46.7 vs. 19.1% at baseline), underlining the ample clinical change that characterizes the initial hours of care. Few patients (17, 3.7%) were classified after 24 h as having a SpO2/FiO2 < 190 and PEEP < 10 cm H2O (group III), in accordance with previous observations in which only few patients with a worsening oxygenation are managed with low levels of PEEP [4]. The use of a differ-ent SpO2/FiO2 cutoff (150, corresponding with 100 mm Hg as used in the Berlin definition for ARDS to classify severe ARDS) did not essentially change the results. This underlines the rationale of the 24 h re-classification.
The comparisons between risk groups emphasize the improvement in risk stratification after 24 h but also sug-gest that the proposed classification by SpO2/FiO2 and PEEP in four risk groups is dependent on other factors. The fact that differences between group III and the other groups did not reach significance could be explained in part by the small number of patients in this group after 24 h. Also interestingly, differences in outcomes between groups separated by PEEP were not significant (group I vs. II and group III vs. IV). This does not weaken the improvement in risk stratification after 24 h, but prob-ably suggests that our findings are driven more by SpO2/ FiO2 than by PEEP. Hence, although PEEP is an attractive stratification tool due to its ubiquity, alternative variables might result in a better classification when combined to the SpO2/FiO2 ratio.
The high mortality rates, especially in the lower risk groups, are high, but confirm those from previous inves-tigations [4, 5]. Re-classification after 24 h lead to lower mortality rates in the lowest risk group, but still the proportion of patients that died was high. This too is in line with findings from the earlier studies [4, 5]. Notice-able differences were seen in APACHE IV, arterial pH, plasma lactate levels in the first 24 h, and vasopressor use between the risk groups, and all could, at least in part be associated with the significant differences in mortality rates. In fact, the post hoc multivariate analysis showed
that stratification based on SpO2/FiO2 and PEEP looses it predictive capability when controlled for APACHE IV scores, plasma lactate levels, arterial pH, blood pressure levels and vasopressor therapy. This at least suggests that persistence of hypoxemia after 24 h could be a surrogate, e.g., overall disease severity but also underlines the weak-ness of a simplified classification system. Nevertheless, we think that the proposed risk stratification may still be useful in settings where only pulse oximetry is available for monitoring and where laboratory examinations to compute disease severity scores are lacking.
The results of this study suggest that the SpO2/FiO2 can accurately surrogate the PaO2/FiO2 in stratifying for mortality of adult patients with established ARDS in resource-rich settings. This simple approach may in par-ticular be useful in settings where repeated blood gas analyses are difficult to obtain or unavailable, such as in pediatric patients [23] and resource-limited settings [42]. However, it must be acknowledged that oximetry may never fully replace arterial blood gas analyses completely. Indeed, acid–base status and PaCO2 levels are clinically important. However, we stress that pulse oximetry is con-sistently present in low-resource settings while blood gas analyzers are scarce, if not completely absent. Moreover, several point-of-care devices allow to measure capillary or venous acid–base, potentially alleviating the need for an arterial blood sample and expensive blood gas analysis devices.
The SpO2/FiO2 may also turn useful in identifying patients at risk for ARDS. It has already been shown to be a useful independent indicator of ARDS in the Kigali cri-teria for ARDS, in which SpO2/FiO2 and lung ultrasound were used instead of PaO2/FiO2 and chest radiography [42]. Further studies in resource-rich and resource-poor settings are still needed to assess the utility of these adapted criteria in patients at risk for ARDS.
all may be associated with the accuracy of SpO2 meas-urements. Its retrospective design allowed us neither to determine the type of pulse oximeter used nor to capture the positions of the probes used in individual patients. The minor but not quantifiable amount of measure-ments from a different probe or location other than the conventional finger oximeter represents a methodologi-cal weakness, but we do not believe affects the outcome or correlation analysis in an important way. We focused on only two time points, i.e., the time of initial ARDS diagnosis and after 24 h. It may be possible that SpO2/ FiO2 and PEEP at other time points add to risk stratifi-cation. Finally, re-classification after 24 h means that patients who died in the first 24 h are missed. The same happens with the small proportion of patients who are extubated or transferred before 24 h. We also excluded patients with a PaO2/FiO2 > 200 mm Hg; however, we do not believe this weakens our results. We did this for the two following reasons. Patients classified as having mild ARDS [1] are very ‘heterogeneous’ with respect to outcomes. Moreover, the milder degree of oxygenation impairments in these patients increases the number of patients with SpO2 values > 97%, above which the rela-tionship between PaO2 and SpO2 becomes weak.
Conclusions
SpO2/FiO2 and PaO2/FiO2 have a strong linear relation-ship. In contrast to risk stratification at initial ARDS diagnosis, risk stratification using SpO2/FiO2 and PEEP at 24 h leads to risk groups with worsening outcomes. Despite the fact that the association between risk group assignment and outcome is confounded by several fac-tors, risk stratification using SpO2/FiO2 and PEEP could be useful and practical, especially in settings where repeated blood analyses are difficult or impossible.
Abbreviations
SpO2: peripheral capillary oxygen saturation; FiO2: fraction of inspired oxygen;
PaO2: arterial oxygen partial pressure; PEEP: positive end‑expiratory pressure;
ARDS: acute respiratory distress syndrome; ICU: intensive care unit; VFD: ventilator‑free days; APACHE: acute physiology and chronic health evaluation; LIPS: Lung Injury Prediction Score; ROC: receiver operating characteristic; AUC: area under the curve; AECC: American–European Consensus Conference on ARDS.
Authors’ contributions
LP, FDS and MJS designed the study. LP, JPR, FDS, LRS and LDB performed the analyses. JPR and AG and members of the MARS consortium collected the data. LP, JPR, FDS, LDB, ASN and MJS drafted the manuscript. SMvdH, JH, ASN, EF, AMD, SG, MJS critically reviewed the manuscript. All authors read and approved the final version of this manuscript. LP, JPR, FDS and MJS had full Additional file
Additional file 1. SF and PEEP in ARDS_Electronic Supplementary Material.
access to all the data in the study and take responsibility for the integrity of the data and the accuracy of the data analysis.
Author details
1 Department of Intensive Care, Academic Medical Center, Meibergdreef 9,
1105 AZ Amsterdam, The Netherlands. 2 Laboratory of Experimental Intensive
Care and Anesthesiology (LEICA), Academic Medical Center, Amsterdam, The Netherlands. 3 Anesthesia and Intensive Care Unit, Department of Emergency
and Organ Transplantation, University of Bari Aldo Moro, Bari, Italy. 4 Depart‑
ment of Pediatrics, Academic Medical Center, Amsterdam, The Netherlands.
5 Department of Pulmonology, Academic Medical Center, Amsterdam, The
Netherlands. 6 Department of Critical Care Medicine, Hospital Israelita Albert
Einstein, São Paulo, Brazil. 7 Pulmonary and Critical Care Medicine, Mayo Clinic,
Jacksonville, FL, USA. 8 Mahidol–Oxford Research Unit (MORU), Faculty of Tropi‑
cal Medicine, Mahidol University, Bangkok, Thailand.
Competing interests
On behalf of all authors, the corresponding author states that there is no conflict of interest.
Availability of data and materials
Original data can be requested upon specific approval by MARS consortium and Academic Medical Center.
Consent for publication Not applicable.
Ethics approval and consent to participate
The Institutional Review Board of the Academic Medical Center approved the protocol and opt‑out consent method of the parent study (IRB No. 10‑056C).
Funding
No funding received.
MARS consortium members
Roosmarijn T. M. van Hooijdonk, Mischa A. Huson, Laura R. A. Schouten, Mar‑ leen Straat, Fabienne D. Simonis, Lieuwe D. Bos, Lonneke A. van Vught, Maryse A. Wiewel, Esther Witteveen, Gerie J. Glas, Luuk Wieske, Jos F. Frencken, Marc Bonten, Peter M. C. Klein Klouwenberg, David Ong, Brendon P Scicluna, Arjan J Hoogendijk, H Belkasim‑Bohoudi, Tom van der Poll.
Publisher’s Note
Springer Nature remains neutral with regard to jurisdictional claims in pub‑ lished maps and institutional affiliations.
Received: 9 February 2017 Accepted: 11 October 2017
References
1. The ARDS Definition Task Force*, Ranieri VM, Rubenfeld GD, et al. Acute respiratory distress syndrome: the Berlin Definition. JAMA. 2012;307:1. doi:10.1001/jama.2012.5669.
2. Hernu R, Wallet F, Thiollière F, et al. An attempt to validate the modifi‑ cation of the American‑European consensus definition of acute lung injury/acute respiratory distress syndrome by the Berlin definition in a university hospital. Intensive Care Med. 2013;39:2161–70. doi:10.1007/ s00134‑013‑3122‑6.
3. Villar J, Pérez‑Méndez L, López J, et al. An early PEEP/FIO trial identifies different degrees of lung injury in patients with acute respiratory distress syndrome. Am J Respir Crit Care Med. 2007;176:795–804. doi:10.1164/ rccm.200610‑1534OC.
5. Bos LD, Cremer OL, Ong DSY, et al. External validation confirms the legitimacy of a new clinical classification of ARDS for predicting outcome. Intensive Care Med. 2015;41:2004–5. doi:10.1007/s00134‑015‑3992‑x. 6. Rice TW, Wheeler AP, Bernard GR, et al. Comparison of the SpO/FIO ratio
and the PaO/FIO ratio in patients with acute lung injury or ARDS. Chest. 2007;132:410–7. doi:10.1378/chest.07‑0617.
7. Chen W, Janz DR, Shaver CM, et al. Clinical characteristics and outcomes are similar in ARDS diagnosed by oxygen saturation/FiO2 ratio compared
with PaO2/FiO2 ratio. Chest J. 2015;148:1477. doi:10.1378/chest.15‑0169.
8. Parvathaneni K, Belani S, Leung D, et al. Evaluating the performance of the pediatric acute lung injury consensus conference definition of acute respiratory distress syndrome. Pediatr Crit Care Med. 2017;18:17–25. doi:10.1097/PCC.0000000000000945.
9. Klouwenberg PMCK, Ong DSY, Bos LDJ, et al. Interobserver agreement of centers for disease control and prevention criteria for classifying infec‑ tions in critically Ill patients*. Crit Care Med. 2013;41:2373–8. doi:10.1097/ CCM.0b013e3182923712.
10. Bernard GR, Artigas A, Brigham KL, et al. Report of the American‑ European consensus conference on ARDS: definitions, mechanisms, relevant outcomes and clinical trial coordination. Intensive Care Med. 1994;20:225–32. doi:10.1007/BF01704707.
11. Zimmerman JE, Kramer AA, McNair DS, Malila FM. Acute Physiology and Chronic Health Evaluation (APACHE) IV: hospital mortality assess‑ ment for today’s critically ill patients. Crit Care Med. 2006;34:1297–310. doi:10.1097/01.CCM.0000215112.84523.F0.
12. Gajic O, Dabbagh O, Park PK, et al. Early identification of patients at risk of acute lung injury: evaluation of lung injury prediction score in a multicenter cohort study. Am J Respir Crit Care Med. 2010. doi:10.1164/ rccm.201004‑0549OC.
13. Quan H, Li B, Couris CM, et al. Updating and validating the Charlson comorbidity index and score for risk adjustment in hospital discharge abstracts using data from 6 countries. Am J Epidemiol. 2011;173:676–82. doi:10.1093/aje/kwq433.
14. Khemani RG, Patel NR, Bart RD, Newth CJL. Comparison of the pulse oxi‑ metric saturation/fraction of inspired oxygen ratio and the PaO2/fraction
of inspired oxygen ratio in children. Chest. 2009;135:662–8. doi:10.1378/ chest.08‑2239.
15. Pandharipande PP, Shintani AK, Hagerman HE, et al. Derivation and vali‑ dation of SpO2/FiO2 ratio to impute for PaO2/FiO2 ratio in the respiratory
component of the Sequential Organ Failure Assessment score. Crit Care Med. 2009;37:1317–21. doi:10.1097/CCM.0b013e31819cefa9.
16. Ellis RK. Determination of PO from saturation. J Appl Physiol. 1989;67:902. 17. Brown SM, Grissom CK, Moss M, et al. Non‑linear imputation of PaO2/FiO2
from SpO2/FiO2 among patients with acute respiratory distress syndrome.
Chest. 2016. doi:10.1016/j.chest.2016.01.003.
18. Khemani RG, Thomas NJ, Venkatachalam V, et al. Comparison of SpO2 to PaO2 based markers of lung disease severity for children
with acute lung injury. Crit Care Med. 2012;40:1309–16. doi:10.1097/ CCM.0b013e31823bc61b.
19. Bellani G, Gattinoni L, Van Haren F, et al. Epidemiology, patterns of care, and mortality for patients with acute respiratory distress syndrome in intensive care units in 50 countries. JAMA. 2016;315:2526–33. 20. Serpa Neto A, Schultz MJ, Festic E. Ventilatory support of patients with
sepsis or septic shock in resource‑limited settings. Intensive Care Med. 2016;42:100–3. doi:10.1007/s00134‑015‑4070‑0.
21. Festic E, Bansal V, Kor DJ, Gajic O. SpO2/FiO2 ratio on hospital admission
is an indicator of early acute respiratory distress syndrome develop‑ ment among patients at risk. J Intensive Care Med. 2015;30:209–16. doi:10.1177/0885066613516411.
22. Group TPALICC. Pediatric acute respiratory distress syndrome: consensus recommendations from the pediatric acute lung injury consensus confer‑ ence. Pediatr Crit Care Med. 2015;16:428–39. doi:10.4187/respcare.01515. 23. Khemani RG, Rubin S, Belani S, et al. Pulse oximetry vs. PaO2 metrics in
mechanically ventilated children: Berlin definition of ARDS and mortality risk. Intensive Care Med. 2015;41:94–102. doi:10.1007/s00134‑014‑3486‑2. 24. Ferguson ND, Fan E, Camporota L, et al. The Berlin definition of ARDS: an
expanded rationale, justification, and supplementary material. Intensive Care Med. 2012;38:1573–82. doi:10.1007/s00134‑012‑2682‑1.
25. Villar J, Pérez‑Méndez L, Kacmarek RM. Current definitions of acute lung injury and the acute respiratory distress syndrome do not reflect their true severity and outcome. Intensive Care Med. 1999;25:930–5. doi:10.1007/s001340050984.
26. Papazian L, Forel J‑M, Gacouin A, et al. Neuromuscular blockers in early acute respiratory distress syndrome. N Engl J Med. 2010;363:1107–16. doi:10.1056/NEJMoa1005372.
27. Guérin C, Reignier J, Richard J‑C, et al. Prone positioning in severe acute respiratory distress syndrome. N Engl J Med. 2013;368:2159–68. doi:10.1056/NEJMoa1214103.
28. Mayordomo‑Colunga J, Pons M, López Y, et al. Predicting non‑invasive ventilation failure in children from the SpO2/FiO2 (SF) ratio. Intensive Care
Med. 2013;39:1095–103. doi:10.1007/s00134‑013‑2880‑5.
29. Tripathi RS, Blum JM, Rosenberg AL, Tremper KK. Pulse oximetry satura‑ tion to fraction inspired oxygen ratio as a measure of hypoxia under general anesthesia and the influence of positive end‑expiratory pressure. J Crit Care. 2010;25:542.e9–13. doi:10.1016/j.jcrc.2010.04.009.
30. Sanz F, Dean N, Dickerson J, et al. Accuracy of PaO2/FiO2 calculated from
SpO2 for severity assessment in ED patients with pneumonia. Respirol‑
ogy. 2015;20:813–8. doi:10.1111/resp.12560.
31. Allardet‑Servent J, Forel J‑M, Roch A, et al. FiO2 and acute respiratory
distress syndrome definition during lung protective ventilation*. Crit Care Med. 2009;37:202‑e6. doi:10.1097/CCM.0b013e31819261db.
32. Feiner JR, Weiskopf RB. Evaluating pulmonary function: an assess‑ ment of PaO2/FiO2. Crit Care Med. 2017;45:e40–8. doi:10.1097/
CCM.0000000000002017.
33. Villar J, Pérez‑Méndez L, Blanco J, et al. A universal definition of ARDS: the PaO2/FiO2 ratio under a standard ventilatory setting‑a prospective, multi‑
center validation study. Intensive Care Med. 2013;39:583–92. doi:10.1007/ s00134‑012‑2803‑x.
34. López‑Fernández Y, Azagra AM, de la Oliva P, et al. Pediatric acute lung injury epidemiology and natural history study: incidence and outcome of the acute respiratory distress syndrome in children. Crit Care Med. 2012;40:3238–45. doi:10.1097/CCM.0b013e318260caa3.
35. Bone RC, Maunder R, Slotman G, et al. An early test of survival in patients with the adult respiratory distress syndrome. The PaO2/FiO2 ratio and its
differential response to conventional therapy. Prostaglandin E1 Study Group. Chest. 1989;96:849–51. doi:10.1378/chest.96.4.849.
36. Cooke CR, Shah CV, Gallop R, et al. A simple clinical predictive index for objective estimates of mortality in acute lung injury. Crit Care Med. 2009;37:1913–20. doi:10.1097/CCM.0b013e3181a009b4.
37. Villar J, Pérez‑Méndez L, Basaldúa S, et al. A risk tertiles model for predict‑ ing mortality in patients with acute respiratory distress syndrome: age, plateau pressure, and PaO2/FiO2 at ARDS onset can predict mortality.
Respir Care. 2011;56:420–8. doi:10.4187/respcare.00811. 38. Bersten AD, Edibam C, Hunt T, Moran J. Incidence and mortality of
acute lung injury and the acute respiratory distress syndrome in three Australian States. Am J Respir Crit Care Med. 2002;165:443–8. doi:10.1164/ ajrccm.165.4.2101124.
39. Luhr OR, Karlsson M, Thorsteinsson A, et al. The impact of respira‑ tory variables on mortality in non‑ARDS and ARDS patients requiring mechanical ventilation. Intensive Care Med. 2000;26:508–17. doi:10.1007/ s001340051197.
40. Knaus WA, Sun X, Hakim RB, Wagner DP. Evaluation of definitions for adult respiratory distress syndrome. Am J Respir Crit Care Med. 1994;150:311–7. 41. Sloane PJ, Gee MH, Gottlieb JE, et al. A multicenter registry of patients
with acute respiratory distress syndrome. Physiology and outcome. Am Rev Respir Dis. 1992;146:419–26. doi:10.1164/ajrccm/146.2.419. 42. Riviello ED, Kiviri W, Twagirumugabe T, et al. Hospital incidence and out‑
comes of the acute respiratory distress syndrome using the Kigali modifi‑ cation of the Berlin definition. Am J Respir Crit Care Med. 2016;193:52–9. doi:10.1164/rccm.201503‑0584OC.
43. Villar J, Blanco J, del Campo R, et al. Assessment of PaO2/FiO2 for stratifica‑
![Fig. 2 Scatterplot of SPO2/FiO2 versus PaO2/FiO2 at initial ARDS diagnosis. The line represents the best‑fit linear relationship: SpO2/FiO2 = 42.6 + 1.0 * PaO2/FiO2 [P < 0.001, R2 = 0.676] at initial ARDS diagnosis](https://thumb-us.123doks.com/thumbv2/123dok_us/926809.1590852/4.595.61.539.101.389/scatterplot-versus-initial-diagnosis-represents-relationship-initial-diagnosis.webp)