INTRODUCTION
Conducting polymers have had the attention of researchers for about two decades. A lot of interest is shown due to their relatively large conductivity, light weight and flexibility. These features make them more desirable than metals in certain applications. Much of the past research on conducting polymers has concentrated in the bulk material1-3.
Polyaniline (PANI) is continuing to receive considerable interest in the field of conducting polymers. The electrically conductive emeraldine salt from of polyaniline is air stable and cheap to produce in large quantities4, giving rise to many suggestions
Optoelectronic and microstructural properties of
PANi(EB)-CSA
xpolymer thin films by novel spin coating method
V.B. PATIL¹*, S.G. PAWAR¹, S.L. PATIL¹ and A.K. SOOD
2¹School of Physical Sciences, Solapur University, Solapur - 413 255 (India) ²Department of Physics, Indian Institute of Science, Bangalore - 560 002 (India).
(Received: July 10, 2009; Accepted: August 30, 2009) ABSTRACT
Films of polyaniline (EB) doped with camphor sulfonic acid (CSA) from m-cresol on glass substrates exhibit considerable metallic properties. Such polymer metallic films have thermal sensitivity superior to ceramic metal (Cermet) films, prepared by metallo organic deposition (MOD) technique on silicon substrates. These PANI (EB)-CSA polymer films prepared by oxidation polymerization with doping levels in the range of 10-90%. The electrical conductivity of these films has been measured as a function of temperature between 10 and 300 K. At a doping level of 20% the onset of metallic transport is observed, and at 60% the films are found to exhibit metallic transport down to 135 K, and have a maximum room-temperature conductivity of 200 ± 20 S cm-1. The results are modeled in terms of a heterogeneous model of fluctuation induced tunneling (FIT) and metallic transport. This paper deals with these superior thermal properties together with optical studies and surface morphology by scanning electron microscopy (SEM).
Key words: Polyaniline, CSA, SEM, optical properties and electrical properties.
positive temperature coefficient of resisitivity8,9. This behavior has been interpreted in two ways: firstly as indicating that the PANI: CSA is a disordered metal near the metal-insulator boundary8 and alternatively as being a modified Drude metal-with the modifications being due to localization within the system9. It is useful, at this point, to outline what is meant by a disordered metal near the metal-insulator boundary.
This paper reports investigations of the optical properties, microstructural properties and electrically conductive nature of PANI: CSA films with doping level ranging from 10-90%. The conductivity of the samples has been measured as a function of temperature in the range 10-300 K. Definite trends in the temperature dependence of the conductivity have been recorded, with the more highly doped samples showing the previously obser ved positive temperature coefficient of resistivity indicative of metallic behaviour.
EXPERIMENTAL Preparation of Polyaniline (EB)
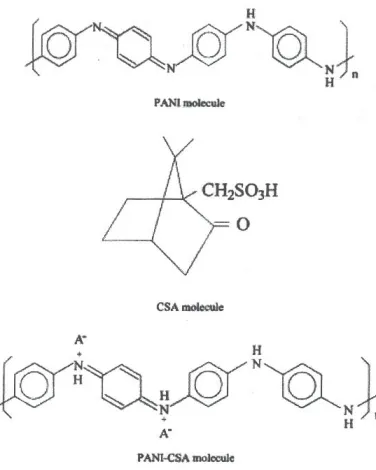
50 ml 1M HCl, and 2ml of aniline were added into a 250 ml flask (covered with ice cubes-salt mixtures to maintain low polymerization temperature) equipped with electromagnetic stirrer. Then 4.9984 g of (NH4)2S2O8 (Ammonium per oxydisulphate) in 50 ml, 1M HCl was suddenly added into the above solution. The polymerization temperature +30oC, 0oC and -30oC were maintained for 5 h to complete the reaction. Then the precipitate obtained was filtered. The product was washed successively by 1M HCl followed by distilled water and respectively until the wash solution turned colorless. Then it was re-filtered and washed once again successively by of distilled water, thoroughly to obtain the emeraldine salt form of polyaniline. To obtain emeraldine base form of PANI, dedope ES from of PANi with 0.1M NH4OH solution then dried at 60oC in vacuum for 24 h. Thus, finally obtained powder of insulating polyaniline (EB) polymer and its structure is shown in figure 1.
Preparation of camphor sulfonic acid (CSA) doped PANi
PANI (EB) was synthesized by solid state reaction using the procedure reported by Reghu et
al10. PANI-CSA was prepared by mixing 1.092 gm (0.012 M) of emeraldine base with 1.394 gm (0.006 M) of (±) 10 camphor sulfonic acid using agate mortar and pestle. The molar ratio of PANI: CSA was 1:0.5. PANI-CSA is soluble in various organic solvents11; for this study, high quality films were prepared by casting the material from solution metacresol12. The films were prepared from 4% (by weight) solution of PANI-CSA in metacresol. The solutions were prepared by adding an appropriate quantity of PANI – CSA into metacresol (1.0 gm of PANi-CSA to 24 ml of m-cresol to yield a 3.9% solution) the mixture was then treated in an ultrasonic bath for 12 hrs and subsequently centrifuged. Most of the PANI-CSA complex dissolved to give a deep green solution; minor insoluble solids were removed by decanting. PANI-CSA films were thus obtained by casting films on glass plates using spin coater and subsequently dried for 24 hrs on a hot plate at 50oC. Film thicknesses were determined by ellipsometry and it was typically from 8-20 µm. Since the PANI-CSA films cast from solution, the PANI chains are neither chain extended nor chain aligned. The films are therefore in all respect isotropic.
Fig. 2: Absorption spectra of PANI (EB)-CSAx polymer thin film
Fig. 3: Conductivity of PANI (EB)-CSAx as a function of temperature for films of various doping level
Fig. 4: Normalized conductivity of PANI (EB)-CSAx (σσσσσ(t)/σσσσσ (300K)) as a function of temperature for films of various doping levels (10-90%)
Fig. 5: A linear plot of conductivity of PANI (EB)-CSA as a function of
temperature for a 50% doped film
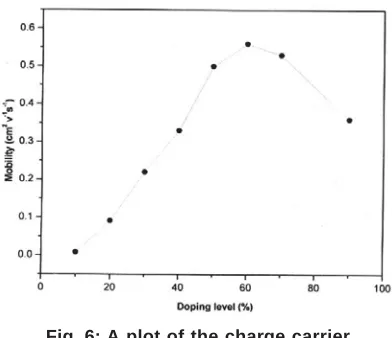
Fig. 6: A plot of the charge carrier mobility of PANI (EB)-CSAx (at room temperature) as a function of doping level
The optical absorption spectra were recorded at room temperature by ‘Hitachi 330 Model Spectrophotometer’ in the wavelength region 200-1200 nm for both PANI (EB) and PANI (EB)-CSAx (X = 40%, 50%, 60% and 80% doping level) polymer films. The electrical conductivity of PANi-CSA at room temperature was measured by four probe technique using Keithley 2000 Multimeter. The surface morphologies of the PANI (EB) and PANI-CSA were obser ved by scanning electron microscope (SEM) using a Quanta-200, Holland.
RESULTS AND DISCUSSION Optical Characteristics
absorption bands at 440 nm and 690 nm. In this case, the ëmax (wavelength of an absor ption maximum) is 440 nm and this band has been assigned as the TT – TT * transition and the band at 690 nm is due to electron band arising due to the shifting of electron from benzenoid ring to quinoid ring. In all the doped polyaniline cases, only the TT – TT * transition band alone of PANI (EB)-CSA, 40% doping level at 450 nm, PANI (EB)-CSA 50% doping level at 454 nm, PANI (EB)-CSA 60% doping level at 460 mm, PANI (EB)- to the infrared without absorption peak at 690 nm. So, the red shift occurs in all the CSA 80% doping level at 464 nm is given. The doping of PANI (EB) with the CSA converts the insulating nature of PANI (EB) into conducting state (metallic nature) because the protons of CSA are added to –N= sites while the number of electron in the chain are constant. Because of this reason all the doped polymer films absorption spectra extend to the infrared without absorption peak at 690 nm. So, the red shift occurs in all doped cases.
Electrical Characteristics
Figure 3 shows the plots of conductivity versus temperature for the films with doping levels between 10 to 90%. It is clear that as the level of protonation is increased from 10 to 60% the conductivity increase rapidly. At 10 K the 60% doped sample is five orders of magnitude more conductive than the 10% doped sample. Also, the conductivity becomes a weaker function of temperature in the more heavily protonated films. The normalized conductivity, σ (T) /σ (300 K), for each data set are shown in figure 4, and allow the trend in conductivity of each sample with temperature to be compared more easily.
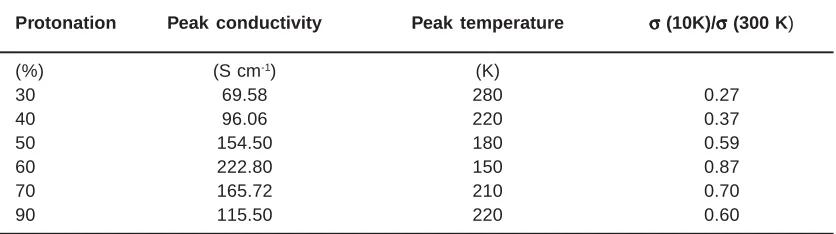
At the two lowest levels of protonation (10 and 20%) the conductivity rises monotonically as temperature is increased. Additionally, the rate of increase of σ (T) increases with temperature. When the protonation level reaches 30% and above, the data reveal a very different behaviour. At low temperatures, conductivity increases as temperature rises, but at higher temperatures, this rate of increase decreases. Moreover, each data set in the 30-90% doping range possesses a characteristic maximum in σ (T) somewhere in the measured range. In table 1 typical peak positions and their accompanying conductivity values are presented. For each case, at temperatures above that at which the peak occurs, the conductivity decreases slowly with increasing temperature i.e. the electr ical conductivity has a negative temperature coefficient In figures 5 the data for the 50% doped sample are presented on a linear scale to reveal in detail the temperature dependence of the conductivity of highly conductive PANI: CSA.
It is widely accepted that the density of charge carriers within samples of conductive polyaniline is approximately equal to the density of protonated chain sites, up to a protonation level of 50%. If it is assumed that all the CSA dopants added to the polymer causes protonation above 50%, and that this increase in protonation causes an increase in charge carriers even where the theoretical 50% level in exceeded, it is possible to estimate the charge carrier density in samples prepared. Furthermore, using the general expression for electrical conductivity.
σ = neµ
Table 1: Temperature values at which the conductivity maxima occur in of PANI (EB)-CSAx Protonation Peak conductivity Peak temperature σσσσσ (10K)/σσσσσ (300 K)
(%) (S cm-1) (K)
30 69.58 280 0.27
40 96.06 220 0.37
50 154.50 180 0.59
60 222.80 150 0.87
70 165.72 210 0.70
It is possible to make an estimate of the charge carrier mobility, µ, where n is the carrier density and e is the charge on an electron. The results of these calculations are shown graphically in figure 6. The reduction of mobility at the higher doping levels (90%) may well be due to a break-down of the previous assumption.
From these results it would appear that there are two distinct regimes of charge transport
in this material according to the level of protonation to which it is prepared. Samples prepared at 10 and 20% protonation, the two lowest doping levels, display an electrical conductivity which is a strong function of temperature, suggestive of charge carriers dependent upon some from of thermal activation. The variable-range hopping mechanism (VRH), in one or two dimensions, has been used to describe the charge transport observed in PANi from previous studies13-15. However, none of the data in
figure 3 are characteristic of transport by VRH. AT temperatures above 100 K the 10 and 20% samples can be described by the fluctuation induced tunneling (FIT) model, which has the form
σ = σ0 exp [-T1/T + T0]
where T1 depends upon the average potential barrier height and T0 represents the temperature for which the thermal fluctuations produce a significant contribution to the tunneling current compared with the temperature independent elastic tunneling. At lower temperatures, however, the fit to these data based upon the form of this equation deviates significantly from the measured values.
A very different trend if revealed by the samples prepared with protonation levels in the range 30-90%. At low temperatures the conductivity still displays an activated behaviour. As the level of protonation is increased from 30% the decreases in the conductivity at the lowest temperatures is much reduced, as illustrated by the values of σ (T)/ σ (300 K) in each case.
The results presented here suggest that the metallic behaviour extends to the lowest temperatures with the 60% protonated film, and that this doping level also results in the highest electrical conductivity. From figure 3, it is also evident that the reduction of conductivity at low temperatures is the least pronounced fro the 60% doped films. This evidence implies that doping above the 50% level is capable of driving the PANI: CSA system far closer to the true metallic behaviour than observed in previous studies. Two explanations are suggested for why this may occur.
´ Samples prepared with 50% doping do not react completely with the CSA added to the polymer. An excess of 10 (±5) % acids is required to protonate all the imine sites on the polymer chain.
´ Protonation of more than 50% of the nitrogen sites generated more conduction band state sand allows a higher charge carrier density within the material, up to a maximum at 60%.
Surface Morphology
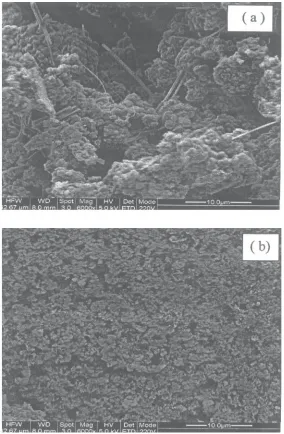
The morphology, shape and size of PANI (EB) and PANi-CSA particles determined by SEM are shown in figure 7. SEM of PANI (EB) (fig. 7 a) shows closer interspection reveal that the aggregates are all perforated and porous, much like a honeycomb with an interlocking arrangement of gobular particles16,17. In addition the images of nano tubes observed with diameter in the range of 84 nm to 120 nm 17. For PANI-CSA, SEM image (fig. 7b), the shape of the particle is very fine and the size range of the particles is approximately 50 nm to 100 nm.
CONCLUSIONS
The present investigations of PANI-CSA polymer films produced by spin coating method with doping levels in the range 10-90%. The UV-visible absorption spectra of PANI (EB) in m-cresol solution cast film gives absorption bands at 440 nm and 690 nm. In this case, the λmax (wavelength of an absorption maximum) is 440 nm and this band has been assigned as the p–p* transition and the band at 690 nm is due to electron band arising due to the shifting of electron form benzenoid ring to quinoid ring. In all the doped polyaniline cases, only the p–p* transition band alone of PANI(EB)-CSA, 40% doping level at 450 nm, PANI(EB)-CSA 50% doping level at 454 nm, PANI (EB)-CSA 60% doping level at 460 nm, PANI (EB)-CSA 80% doping level at 464 nm is given.
been found to exhibit the highest room-temperature conductivity, and metallic behaviour down to the lowest temperatures.
Scanning electron microscopy of PANI (EB) reveals honeycomb structure with an interlocking arrangement of gobular particles, in addition the images of nano tubes observed with diameter in the range of 84 nm to 120 nm, while for PANI: CAS SEM image, the shape of the particle is ver y fine and size range of the par ticles is
approximately 50 nm to 100 nm. ACKNOWLEDGMENTS
One of the authors (VBP) is thankful to Jawaharlal Nehru Centre for Advanced Scientific Research, Bangalore for awarding Visiting Fellowship (2007). Thanks are due to all Group members of Prof. A. K. Sood Laborator y, Department of Physics, Indian Institute of Science, Bangalore, providing the necessary support.
1. MacDiarmid, A. G., Jones, W. E., Norris, I. D., Gao, J., Johnson, A. T., Pinto Jr, N. J., Home, J., Han, B., Ko, F, Okuzaki, K. H. and Llaguno, M., Synth, Met., 119: 27-30 (2001). 2. Huang J., Virji S., Weiller B. H. and Kaner, R. B., J. Am. Chem. Soc., 125: 314-315 (2003). 3. Adams, P. N., Devasagayam, P., Pomfret, S. J. Abell, L. and Monkman, A. P., J. Phys.: Condens. Matter, 10: 82-93 (1998). 4. Salaneck, W. R., Clark, D. T. and Samuelsen,
E. J., (ed) Science and Applications of Conducting Polymers (Bristol: Hilger) (1991). 5. Epstein, A. J. and MacDiarmid, A. G., Synth.
Met., 69: 179 (1995).
6. Monkman, A. P. and Adams, P. N., Synth. Met., 627:41-43 (1991).
7. Cao, Y., Smith, P. and Heeger, A. J., Synth. Met. 48: 91 (1992).
8. Menon, R., Yoon, C.O., Moses, D. and Heeger, A. J., Phys. Rev., B 48: 685 (1993). 9. J Jaoo, E. J. Oh, G. Min, A. G. MacDiarmid and A. J. Epstein, Synth. Met., 69: 251
REFERENCES
(1995).
10. Reghu, M. and Heeger A. J., Physical Review, B 47(4): 1758 (1993).
11. Cao, Y., Smith, P. and Heeger A. J., Synthetic metals, 48: 91 (1992).
12. Cao, Y., Smith, P. and Heeger, A. J., Appl. Phys. Lett., 60: 1 (1992).
13. Jeong, S. K., Suh, J. S., Oh, E. J., Park, Y. W., Kim, C. Y. and MacDiarmid, A. G., Synth. Met., 69: 171 (1995).
14. Park, Y. W., Lee, Y. S., Park, C., Shacklette, L. W. and Boughman, R. H., Solid State Commun., 63: 1063 (1987).
15. Zuo, F., Angelopolous, M., MacDiarmid, A. G. and Epstein, A. J., Phys. Rev., B 36: 3475 (1987).
16. Goel, S., Gupta, A., Singh, K. P., Mehrotra, R. and Kandpal, H. C., Materials Science and Engineering, A 443: 71 (2007).