Research Article Available online www.ijsrr.org ISSN: 2279–0543
International Journal of Scientific Research and Reviews
To Formulate Develop and Evaluate Sustained Release Matrix Tablet
of Torsemide and also Carried out in Vitro Dissolution Studies.
Warkad S. S.
1*, Anantwar P. S.
2, Gaikwad S.
3, Chavan M. N.
1, Pakhare V. S.
1,
Gharat S. N.
11Department of pharmaceutics, MVP’s college of pharmacy, Gangapur road, Nashik, Affiliated to
savitribaiphule pune university, pune, Maharashtra. Email ID : [email protected],
2
ShriSaptashrungiAyurvedMahavidyalayHirawadi, Nashik. Affiliated to Maharashtra university of health sciences Nashik, Maharashtra, India
3
GBS GSTO Apotext Research pvt Ltd Mumbai . Email ID: [email protected]
ABSTRACT
The aim of present study was formulation and development and evaluation of sustained release matrix tablet of Torsemide. The Torsemide is potassium sparing diuretic generally used in hypertension. The Torsemide has advantages over furosemide in treatment of Edema associated with congestive heart failure. The action of Torsemide can be mediated by several mechanisms operating within the thick, medullary segment of ascending loop of Henle. The Torsemide has a dose about 10mg twice a day, so to reduce dosing frequency it is formulated in sustained release formulation.
Torsemide sustained release tablet was prepared by using polymers HPMC K 100 as sustained release polymer and Kollidon VA64 as binder by direct compression method. A 32 full factorial design was used to formulate different batches containig different concentration of HPMC K 100 and Kollidon VA64. The prepared tablets were evaluated for different parameters like Hardness, Friability, and Dissolution.
Out of all factorial design batches F6 batch shows sustained release drug release for 24hr as compared to other all batches.
KEY WORDS:
Torsemide, Sustained release matrix tablet, HPMC K 100, Kollidon VA64, Dissolution kinetics.*Corresponding author
Mr. Sachin S. Warkad
Research scholar,Department of Pharmaceutics,
MVP Samaj’s college of pharmacy,Gangapur road, Nashik, Maharashtra-422002, India
Email Id- [email protected]
1
.
INTRODUCTION
1, 2, 3, 4Over the past decades the treatment of acute and chronic illness has been accomplished by
many conventional drug delivery systems such as tablets, capsules, pills, creams, ointments,
liquids, aerosols, injectables and suppositories. These conventional drug delivery systems are still
the primary pharmaceutical products commonly seen today in prescription. Oral route is the most
commonly employed route of drug administration. Although different route of drug
administration are used for the delivery of drugs, oral route remain the preferred route. Even for
sustained release systems the oral route of administration has been investigated the most because
of flexibility in dosage forms design that the oral route offers.
Conventional drug therapy requires periodic doses of therapeutic agents. These agents are
formulated to produce maximum stability, activity and bioavailability. For most drugs,
conventional methods of drug administration are effective, but some drugs are unstable or toxic
and have narrow therapeutic ranges. Also in these types of systems, for achieving and maintaining
concentration of drug within the therapeutic range, frequent dosing is required which result into
see-saw pattern of the drug levels.
To overcome these problems sustained release systems were introduced three decades ago.
Sustained release, sustained action, prolonged release, controlled release, extended action, timed
release, depot and repository dosage forms are the terms used to identify drug delivery systems
that are designed to achieve a prolonged therapeutic effect by continuously releasing medication over an extended period of time after administration of a single dose. The term “controlled release” has become associated with those systems from which therapeutic agents may be
automatically delivered at predefined rate over long period of time.
The basic goal of drug therapy is to achieve a steady-state blood level or tissue level that
is therapeutically effective and non-toxic for an extended period of time. To achieve better
therapeutic action various types of drug delivery systems are available, out of which sustained
release systems are gaining much importance because of their wide advantages over others like
ease of administration, convenience and non-invasiveness. The vast majority of traditional dosage
forms can be described as dump systems which deliver their active substances in a first order
fashion, that is, release occurs at rates that are highest initially and then decline steadily thereafter.
Clinically this peak and valley pattern results in a time dependent mix therapy. Drug side effects
tend to predominate at the high peak concentration in blood, whereas, an inadequate therapeutic
effect may prevail at the valley level. Use of controlled release systems provides an excellent tool
Advantages of sustained release drug delivery8
Sustained release products have many advantages listed as follows.
1. These formulations reduce dosing frequency of drugs.
2. These formulations may maintain therapeutic concentrations.
3. Reduce the toxicity by slowing drug absorption.
4. The use of these formulations avoids the high blood concentration.
5. These formulations have the potential to IM side effects.
6. Increase the stability by protecting the drug from hydrolysis or other degradative changes in
gastrointestinal tract.
7. Improvement in treatment efficacy.
8. Minimize drug accumulation with chronic dosing.
9. Improve the bioavailability of some drugs.
10. Usage of less total drug.
11. Improve the ability to provide special effects prove the patient compliance.
Disadvantages of sustained release drug delivery
1. This formulation contains a higher drug load and thus leads to loss of integrity of the dosage
form.
2. The larger size of sustained release products may cause difficulties in ingestion or transit
through gut.
3. The release rates are affected by various factors such as food and the rate of transit through the
gut.
4. Some differences in the release rate from one dose to another dose but these have been
minimized by modern formulations.
5. High cost of preparation
6. Sometimes the target tissue will be exposed to constant amount of drug over extended period
results in drug tolerance.
The oral route of administration is the most preferred route due to flexibility in dosage form,
design and patient compliance. The majority of oral controlled release systems rely on dissolution,
diffusion or a combination of both mechanisms, to generate slow release of drug.
2. MATERIAL AND METHOD
API: Torsemide is obtained as a gift sample from Pure chem laboratories Ltd., Ankleshwar,
Gujrat. Kollidon VA64 and HPMC K100 (matrix forming material), Micro crystalline cellulose
Instrument used for study:
1. UV spectrophotometer (Shimadzu UV-2450 Double Beam Spectrometer).
2. FTIR spectrophotometer (Shimadzu).
3. Pfizer hardness tester (Cadmach, India).
4. Roche Friabilator (Remi Electronics, Mumbai, India).
5. Single pan electronic balance (Shimadzu AUX 220)
6. Vernier calliper.
7. USP XXII Type II Dissolution apparatus DS 8000 (Lab-India, Mumbai, India).
8. UV spectrophotometer (Shimadzu UV-2450 Double Beam Spectrometer).
9. Differential scanning Calorimetry (PerkinElmer 4000)
Method:
2.1. Formulation study
2.1.1. Preliminary trial batches:
Composition of preliminary trials batches for sustained release formulation is shown in Table
.In all the formulations dose of Torsemide 20 mg was taken. Torsemide matrix tablets were prepared
by direct compression method. The excipients used were Kollidon VA64 and HPMC K100 (matrix
forming material), Micro crystalline cellulose (MCC) PH102 (filler), Talc (glidant) and Magnesium
stearate (lubricating agent).
2.1.2. Direct compression technique:
Torsemide, Kollidon VA64, HPMC K100 and MCC were mixed properly. The powder
blends were lubricated using Magnesium stearate and Talc was added finally. Tablets were prepared
using 10-station rotary compression machine. The prepared tablets were evaluated for hardness and
in vitro drug release.
Table 1: Composition of trial batches
Ingredients (mg) / batch
T1 T2 T3 T4
Torsemide 20 20 20 20 HPMC K100 60 40 70 30 Kollidon SR 60 80 40 90
MCC 102 40 40 40 40
Mg. Stearate 15 15 15 15
Talc 5 5 5 5
2.2.3. Formulation of Torsemide SR matrix tablets
In the given table the values of excipients are decided depending on the concentrations
suggested as in Book of excipients. The values are given depending on particular role of that
ingredient. HPMC here is used as sustained release matrix forming polymer, Kollidon VA 64 is
binder, MCC 102 as diluents, talc and magnesium stearate as flow enhancers.
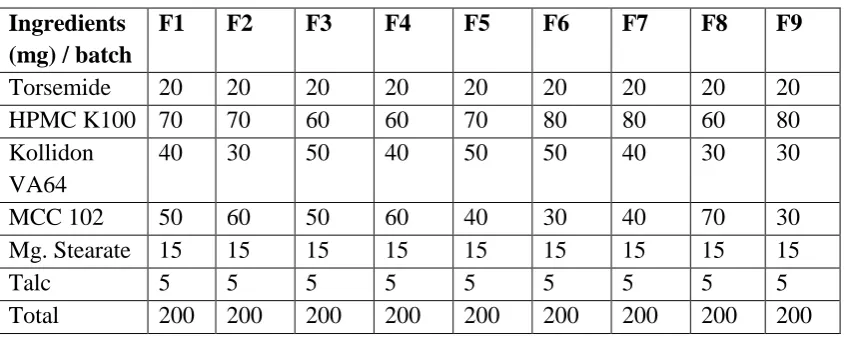
Table 2: Formulation of 32 Factorial Design Batches
Ingredients (mg) / batch
F1 F2 F3 F4 F5 F6 F7 F8 F9
Torsemide 20 20 20 20 20 20 20 20 20 HPMC K100 70 70 60 60 70 80 80 60 80 Kollidon
VA64
40 30 50 40 50 50 40 30 30
MCC 102 50 60 50 60 40 30 40 70 30 Mg. Stearate 15 15 15 15 15 15 15 15 15 Talc 5 5 5 5 5 5 5 5 5 Total 200 200 200 200 200 200 200 200 200
2.3. Preparation of Tablets:
The direct compression method was utilized for the preparation of tablets. The drug
Torsemide, HPMC K100, Kollidon VA64 and MCC PH102 were mixed thoroughly in mortar and
pestle for 5 min. The blends of the prepared powder were lubricated with Magnesium stearate and
mixed with Talc. The tablets were compressed using 9 mm punches at on multiple punches 10
station tablet machine. The formulae of all factorial batches of Torsemide SR Matrix tablet are
shown in the Table.
2.4. Evaluation of Torsemide (SR) matrix tablets
2.4.1. Appearance and thickness :
The thickness of tablet as a dimensional variable was evaluated. The tablet thickness was
controlled within ±5% of average value. The colour, odour and any other flaws like chips, cracks,
surface texture, etc. are other important morphological characteristics were observed.The thickness
of tablet was measured in mm using micrometre screw gauge and diameter defined by die used in the
preparation of tablets.
2.4.2. Hardness
Tablet hardness is defined as force required to crushing the tablet in diametric compression
between two plungers and the lower plunger is kept in contact of tablet to read as zero. The upper
plunger is forced against a spring by turning the screw until tablet fractures.
2.4.3. Weight variation test
Twenty tablets were taken and weighed and average weight of the tablet was determined.
The tablets were weighed individually and the weight variation was determined.
2.4.4. Friability
Twenty tablets were weighed and subjected to friability test in Roche friabilator. The
pre-weighed sample was placed in friabilator which revolves at 25 rpm for 4 min. dropping the tablets
through a distance of 6 inch with each revolution. This process was repeated for all formulations and
the percentage friability was calculated.
The % Friability was then calculated by,
% Friability =Winitial – Wfinal / Winitial × 100
2.4.5. Drug Content
It is determined by ten random tablets were taken and one tablet was crushed powder
equivalent to 20 mg was dissolved in 100 ml of 0.1N HCl and shaken for 20 min. solution will be
filtered and after suitable dilution using 0.1N HCl, absorbance was measured spectrophotometrically
against reagent as blank. Amount of drug present in one tablet was calculated.
2.4.6. In vitro drug release study
The drug release rate from Torsemide SR matrix tablets was determined using USP apparatus
type II (lab India, India). The dissolution test was performed using 900 ml of 0.1N HCl at 37 0.5C
and 50 rpm. A sample (10 ml) was withdrawn at a specific interval and replaced with fresh
dissolution medium of same quantity. The samples were filtered through a Whatman filter paper.
Absorbance of the solutions was measured at 237 nm by UV-Visible Spectrophotometer (UV-2450
SHIMADZU).The drug release and drug release kinetics was calculated.
2.5. Kinetics analysis of drug release:
In order to investigate the mode of release from the tablets the release data were analysed
with the following mathematical models:
A. Zero-order kinetic:
Q0 = Qt + k0t
Where, Qt is amount of drug release at time t
K0 is zero order release rate constant.
B. First-order kinetic:
ln (100 – Q) = lnQ0 – k1t
Where, Q = amount of drug release at time t
Q0 = amount of drug present initially
K1 = first order release rate constant
C. Higuchi equation:
Q = kH t1/2
Where, Q = amount of drug release at time t
KH = Higuchi dissolution constant
D. Korsmeyer-Peppas model:
Q =kPtn
Where, Kp is a constant incorporating the structural and geometric characteristics of the drug dosage
form.
n is the release exponent indicative of the mechanism of release.
This equation was further simplified and proposed by Ritger and Peppas,
Mt/M= Ktn
Where, Mt is the drug released at time t,
M is the amount of drug released at infinite time
K is a kinetic constant, and
n is the diffusional exponent.
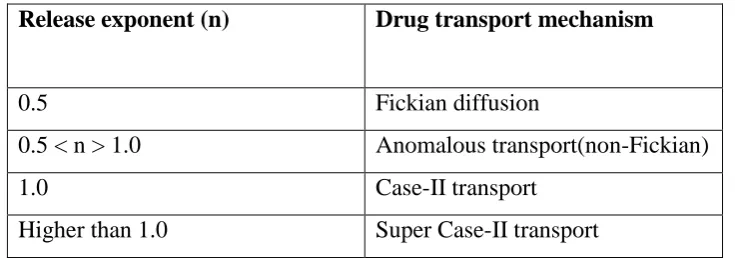
The value of n indicates the drug release mechanism. For a slab the value n = 0.5 indicates Fickian
diffusion and values of n between 0.5 and 1.0 or n = 1.0 indicate non-Fickianmechanism. In case of a
cylinder n = 0.45 instead of 0.5, and 0.89 instead of 1.0. This model is used to analyse the release
from polymeric dosage forms, when the release mechanism is not well known or when there is a
possibility of more than one type of release phenomenon involved.
Table 3: Interpretation of diffusional release mechanism from polymeric films.
Release exponent (n) Drug transport mechanism
0.5 Fickian diffusion
0.5 < n > 1.0 Anomalous transport(non-Fickian)
1.0 Case-II transport
3. RESULTS AND DISCUSSION:
3.1. Drug identification
The sample of Torsemide procured for study and was identified by melting point, UV spectrum,
ATR spectrum and DSC thermograph.
3.1.1. Organoleptic characteristic of API
Table 4: Organoleptic characteristic
Parameter Observation Result Reported Standard
Colour White White
Odour Odourless Odourless
Appearance Crystalline powder Crystalline powder Organoleptic properties of drug samples were in accordance with literature values.
3.1.2. Melting Point
Table 5: Melting Point
Sample Observed value (0C) Reported value (0C)
Torsemide 162- 1650C 163-1650C
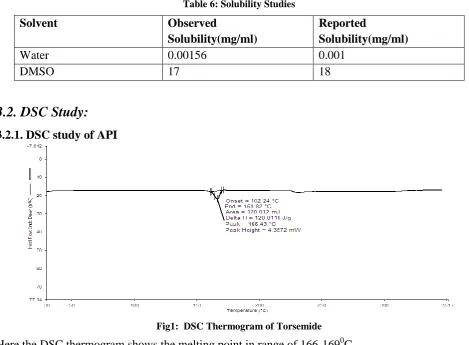
3.1.3 Solubility studies:
Table 6: Solubility Studies
Solvent Observed
Solubility(mg/ml)
Reported
Solubility(mg/ml)
Water 0.00156 0.001
DMSO 17 18
3.2. DSC Study:
3.2.1. DSC study of API
Fig1: DSC Thermogram of Torsemide
3.2.2 DSC study of Excipient and Drug Excipient Mixture
Fig2: DSC thermogram of HPMC K100
Fig3: DSC thermogram of Physical mixture
Fig4: DSC overlay plot
The melting point range observed in both thermogram is same indicating compatibility between drug
3.3. Formulation Studies
3.3.1 Preliminary trial batches
Table7: Evaluation of preliminary trial batches
Time (hrs.)
% Drug Release of trial formulations
T1 T2 T3 T4
1 6.14 2.18 5.10 11.66
3 19.17 27.28 16.32 26.25
5 26.94 38.59 23.51 30.64
8 38.77 50.78 33.56 42.90
11 48.14 61.95 43.44 53.34
14 58.03 69.32 53.87 63.25
16 64.63 72.34 59.43 69.53
18 69.33 74.15 65.28 75.69
20 74.86 75.18 71.87 77.69
22 78.10 76.31 76.59 80.14
24 81.18 71.31 82.42 81.86
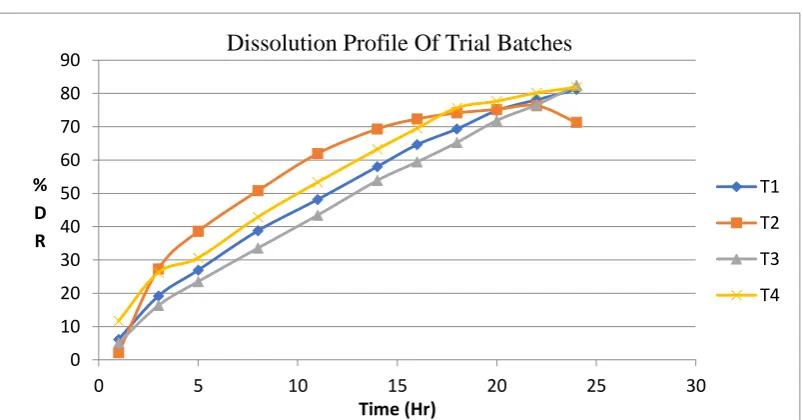
Fig 5: Drug Release of Preliminary trial batches
0 10 20 30 40 50 60 70 80 90
0 5 10 15 20 25 30
% D R
Time (Hr)
Dissolution Profile Of Trial Batches
T1
T2
T3
The release profile of trial formulations (T1 to T4) given in Table18. Formulation T1 to T4
drug release studied for 24 Hrs. T3 and T4 batch shows better drug release profile than others.
Concentration of HPMC K100 shows impact on release of active ingredient in formulations.T3
shows 82.42 and T4 shows 81.86
Table 8: Evaluation of tablet
Batch Weight
variation (mg)
Hardness (Kg/cm2)
Friability (%)
Thickness (mm)
Drug
Content (%)
F1 200±1.8 7±0.11 0.59±0.01 3.2±0.05 98.45 F2 199±1.7 7.3±0.1 0.63±0.0111 3.3±0.15 98.13 F3 198±1.0 6.6±0.17 0.68±0.009 3.2±0.15 99.09 F4 200±1.8 7±0.2 0.49±0.016 3.3±0.15 99.31 F5 199±1.9 7.1±0.31 0.51±0.008 3.4±0.05 99.57 F6 201±1.8 7.5±0.05 0.54±0.017 3.3±0.1 98.90 F7 202±1.9 7.1±0.1 0.43±0.009 3.3±0.15 99.98 F8 200±1.8 6.6±0.15 0.67±0.012 3.2±0.1 100.12 F9 200±1.3 6.7±0.05 0.69±0.014 3.2±0.11 97.63 Mean ±SD n=20
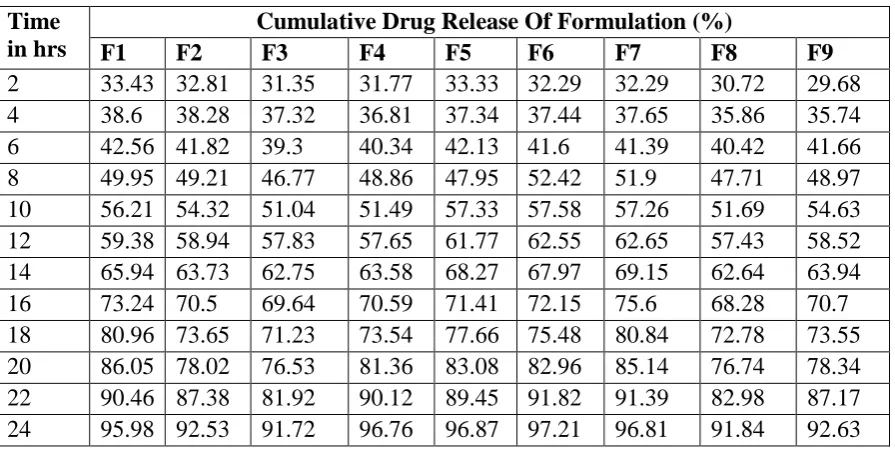
3.4. In vitro drug release studies
Formulation containing combination of HPMC K100 and Kollidon VA64 retarded the drug release
up to 24 Hrs.
Table 9: In vitro drug release studies
Time in hrs
Cumulative Drug Release Of Formulation (%)
F1 F2 F3 F4 F5 F6 F7 F8 F9
Fig 6: Drug Release of Factorial Batches
In case of trial batches the concentration was decided as suggested in the book of excipients.
Depending on results obtained from those trials the final formulation concentration was decided. The
T3 batch showed best results for the drug release and hence that point was considered to be centre
point for optimisation.
Thus DOE suggested following batches having concentration in given range keeping trial optimized
concentration as middle one.
Table 10: Experimental batches as per DOE
Factor 1 Factor 2 Response 1 Response 2 Std. Run A:HPMC K 100 B:Copovidone Drug release Hardness
Mg Mg % Kg/cm2
11 1 70 40 95.98 7
5 2 70 40 95.98 7.1
2 3 70 30 92.52 6.5
10 4 70 40 95.98 6.9
7 5 60 50 91.72 7.2
4 6 60 40 96.76 7.4
8 7 70 50 96.87 7
9 8 80 50 97.21 6.7
6 9 80 40 96.81 6.8
1 10 60 30 91.84 7.3
3 11 80 30 92.63 6.8
0 20 40 60 80 100 120
0 5 10 15 20 25 30
% C D R
TIME (Hr)
Dissolution Profile Of Factorial Batches
F1
F2
F3
F4
F5
F6
F7
F9
3.5. Optimized Batch:
The optimized batch was suggested by the DOE software depending on the onses entered in
software.
Table 11: Optimized batch as per DOE
Solutions
Number HPMC K 100 Copovidone Drug release Hardness Desirability
1 80.000 50.000 97.388 6.756 1.000 Selected
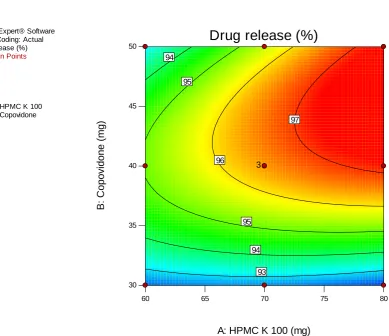
Fig 7: contour plot of Drug release
The above contour plot shows combined effect due to varying concentrations of Copovidone and
HPMC K 100 on the drug release characteristic of tablet. It could be seen that as the concentration of
copovidone increases there is proportional increase in the drug release at constant concentraton of
HPMC k 100. Solely the increasing concentration of HPMC k 100 is directly proportional to effect
only at higher concentrations of copovidone. Both these factors when increased simultaneously so
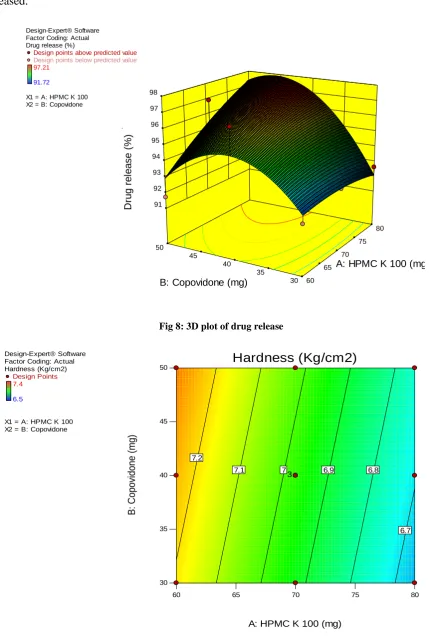
combined effect on drug release. The curvature in the 3D plot clearly indicates that the increasing
Design-Expert® Software Factor Coding: Actual Drug release (%)
Design Points
97.21
91.72
X1 = A: HPMC K 100 X2 = B: Copovidone
60 65 70 75 80
30 35 40 45
50
Drug release (%)
A: HPMC K 100 (mg)
B
:
C
o
p
o
v
id
o
n
e
(m
g
)
93 94 94
95 95
96
97
copovidone increases drug release only up to a limit beyond which the drug release is further
decreased.
Fig 8: 3D plot of drug release
Fig 9: Contour plot for Hardness
Design-Expert® Software Factor Coding: Actual Drug release (%)
Design points above predicted value
Design points below predicted value
97.21
91.72
X1 = A: HPMC K 100 X2 = B: Copovidone
30 35 40 45 50 60 65 70 75 80 91 92 93 94 95 96 97 98 D ru g r e le a se ( % )
A: HPMC K 100 (mg)
B: Copovidone (mg)
Design-Expert® Software Factor Coding: Actual Hardness (Kg/cm2)
Design Points 7.4
6.5
X1 = A: HPMC K 100 X2 = B: Copovidone
60 65 70 75 80
30 35 40 45 50 Hardness (Kg/cm2)
A: HPMC K 100 (mg)
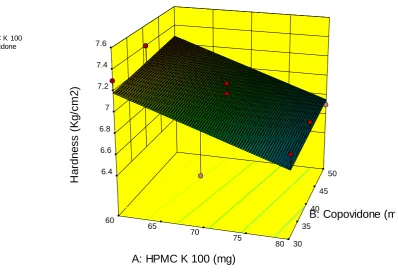
Above contour plot shows effect of HPMC K 100 and Copovidone on Hardness of the tablet. It is
seen that the HPMC K 100 is the dominant factor to have effect on Hardness. As HPMC increases
the hardness decreases and copovidone has its effect only at extreme high and low values of HPMC
K 100. To have higher hardness low concentration of HPMC and higher concentration of copovidone
is suggested.
Fig 10: 3D plot for Hardness
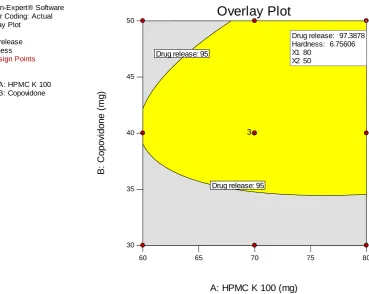
To have all the responses within limits the overlay plot shows required input variable values. Thus it
indicates a design space where all the responses are within acceptable limit at any value of input
variable in that particular design space.
Design-Expert® Software Factor Coding: Actual Hardness (Kg/cm2)
Design points above predicted value Design points below predicted value
7.4
6.5
X1 = A: HPMC K 100 X2 = B: Copovidone
30 35
40 45
50
60
65
70
75
80 6.4
6.6 6.8 7 7.2 7.4 7.6
H
a
rd
n
e
ss
(K
g
/cm
2
)
A: HPMC K 100 (mg)
Fig 11: Overlay plot of all factors and responses
Dissolution models for the optimized batch (F6)
For the dissolution model to fit in any of the mentioned case we need to conditions to fit. We have to
find a model wit least sum of square error value having higher regression value.
The above data suggests that KorsemayerPeppas model could be fitted more appropriately to the
developed system as it has least error value and comparatively a good regression coefficient. Also it
is mentioned prior that the developed system is swellable in nature which proves the suggested
model good for fit.
Table 12: Dissolution Models
Sr.
no
Model Sum of squares of
error
Regression
1 Zero Order 41142.9 0.995
2 Hiiguchi 4.918.40 0.969
3 First Order 38666.49 0.938
4 Hixon Crowel 11.8 0.995
5 KorsemayerPeppas 10.92 0.951
Design-Expert® Software Factor Coding: Actual Overlay Plot
Drug release Hardness
Design Points
X1 = A: HPMC K 100 X2 = B: Copovidone
60 65 70 75 80
30 35 40 45
50
Overlay Plot
A: HPMC K 100 (mg)
B
:
C
o
p
o
v
id
o
n
e
(
mg
)
Drug release: 95 Drug release: 95
3
Drug release: 97.3878 Hardness: 6.75606 X1 80
4. CONCLUSION
The oral route is most preferred route of administration of dosage forms. Controlled release
dosage forms are advantageous over conventional dosage form because reducing dosing frequency
and improved patient compliance. The work was carried out to design sustained release matrix tablet
of Torsemide using combination of two polymers.
The conclusions drawn from the investigations were summarized below
The polymer was selected for the sustaining the release i.e. HPMC K100 and Kollidon VA64
are compatible with the Torsemide.
Sustained release matrix tablets of Torsemide were successfully prepared using HPMC
K100(40%) , Kollidon VA64(25%) and other excipients.
The tablets were evaluated for Pharmacopoeial and non-Pharmacopoeial tests.
The 32 factorial design can be successfully applied for the optimization of the batches.The
selected independent variable exhibits significant effect on dependent variables.
The oral sustained release drug delivery system of Torsemide provides the drug release for 24 Hrs in a sustained manner to achieve the desired therapeutic profile with maximum drug
utilization, improve patient compliance.
In the trial batches the HPMC K100 (70mg) and Kollidon VA64(40mg) so the better results,
according to that the levels for factorial batches decided.
The formulation F6 shows the maximum drug release in 24hrs in sustained release manner.
5. REFERENCES
1. Bhargava A, Rathore R, Oral Sustained Release Dosage Forms: An opportunity to prolong
the release of drug, IJARPB, 2013; 3:7-14.
2. Lachman L, Lieberman H. The theory and practice of industrial pharmacy, 3rd ed., Varghese
Publishing House, Bombay, 300-330.
3. Parashar T., et.al., Novel Oral Sustained Release Technology: A Concise Review, IJRDPL,
February - March, 2013; 2(2): 262-269
4. Ansel H, Nicholas G, Ansels Pharmaceutical dosage forms and drug delivery system,9thedn.
Lippincott Williams and Wilkins, 225-256.
5. Giovanna C, Marzia C. A Review on sustained release technology. IJRAP2011;2: 1701-1708.
6. Pundir S, Badola A. sustained release matrix technology and recent advance in matrix drug
7. Swarbrick J, Encyclopedia of pharmaceutical technology, Marcel Dekker, Inc., 20
(Supplement 3):385-401.
8. Senel S., Capan Y., Hincal A. Factors affecting the formulation of sustained release potassium chloride tablets. Pharmazie.1991; 46: 792.
9. Chugh I, Seth N. Oral sustained release drug delivery system: Overview. IRJP 2012; 3:58-62.
10.Singh A, Sharma R. Sustained release drug delivery system. IRJP 2012; 3:21-24.
11.Tapaswi R, Verma P. Matrix tablets: an approach towards oral extended release drug
delivery. International Journal of Pharma Research & Review 2013; 2:12-24.
12.Lee T.W. and Robinson J. R. Controlled release drug delivery system. Remington, The
science and practice of pharmacy, 21sted, Vol.1.Mack publishing house, Easton,
Pennsylvania, 2005; 889-905.
13.Kamboj S, Gupta GD, Oberoy J. Matrix Tablets: An Important Tool for Oral
Controlled-Release Dosage Forms. Pharmainfonet 2009; 7:3-16.
14.Shaha N. et.al Review on Sustained Release Matrix Tablets: An Approach to Prolong the
Release of Drug JPSBR: 2015; 5 (3): 315-321.
15.Nokhodchi R., Raja S.,PatelP., Kofi Asare-Addo.The Role of Oral Controlled Release Matrix
Tablets in Drug Delivery Systems.Bioimpacts, 2012; 2(4):175-187
16.YihongQiu, Howard Cheskin, Jackie Briskin, Kevin Engh. Sustained release hydrophilic
matrix tablet of zileuton: formulation and in vitro/in vivo studies. Journal of Controlled
Release 1997; 45:249-256.
17.Savaser A., Ozkan Y.,IsmerA.. Preparation and in vitro evaluation of sustained release tablet
formulations of diclofenac sodium. IL Farmaco 2005; 60: 171-177.
18.Wei He, Mengmeng Wu, Shiquing Huang, Lifang Yin. Matrix tablet for sustained release of
repaglinide: preparation, pharmacokinetics and hypoglycaemic activity in beagle dogs.
International Journal of Pharmaceutics, 2015; 478: 297-307.
19.Dong-Wook Kim, Jun-Bom Park. Development and pharmaceutical approach for
sustained-release metformin succinate tablets. Journal of Drug Delivery Science and technology, 2015;
30: 90-99.
20.United States Pharmacopia (USP) Revised Bulletin Official August 1, 2014.
21.Aleksandra K., Ian G Tucker, Matrix formation in sustained release tablets: possible
mechanism of dose dumping. International Journal of Pharmaceutics, 2003; 25: 67-78.
22.Robert J, Mentz MD, et.al, Torsemide versus Furosemide in Patients with Acute Heart
23.Alexander L. Gerbes, Ute Bertheau-Reitha, Christine Falkner, Dieter Jungst and Gustav
Paumgartner, Advantages of the new loop diuretic Torsemide over furosemide in patients
with cirrhosis and ascites, Journal of hepatology; 1993;17:353-358
24.Argenziano L., Carmine Morisco et al, Efficacy and safety of Torsemide in patients with
Moderate CHF. Current Therapeutic Reserch; 1998; 59:697-709.
25.Giri S., Sellappan Velmurugan and Sahithya Chowdary. Formulation and Evaluation of
glipazide sustained release matrix tablet. International Journal of Pharmacy and
Pharmaceutical Sciences. 2013; 5:354-360.
26. Tejashwini JM, Kumar A P, Suresh V. Kulkarni. Formulation and evaluation of sustained
release matrix tablet of Voriconazole using synthetic polymers. International Journal of
Pharmaceutical Research Scholer, 2015; 4: 24-35.
27.Bose A, Wong T W, Singh N Formulation Development and Optimization of sustained
release matrix tablet of Itopride HCl by response surface methodology and its evaluartion of
releas kinetics, Saudi Pharmaceutical Journal;2013;21: 201-213.
28.Ghimre M. et al, In-vitro and in vivo erosion profile of Hydroxy propyl methyl cellulose
(HPMC) matrix tablet, Journal of Controlled Release, 2010; 147:70-75.
29.Gouthami J.,JhannsipriyaM.V. and N. Naidu, Effect of different polymers on release of the
sustained release tablets of the glipizide, JCPR, 2013; 5:111-118.
30.Costa P Lobo JMS.Modeling and Comparison of Dissolution Profiles.Eur.J Pharma Sci.2001;
13:123-133.
31.Petrovic A., Trajkovic S., IbricS.,Popadic D. Mixture design evaluation of drug release from
matrix tablets containing carbomer and HPMC. J Control Release.2006; 58-65.
32.Costa P.*, Jose´ Manuel Sousa Lobo, Review Modeling and comparison of dissolution
profiles, EJPS, 2001; 13: 123–133.