Average Cell Utilization Measure for Evaluation of
Machine- Part Matrices
Adnan A. Al-Bashir,
[email protected]
Department of Industrial Engineering, Faculty of Engineering, Hashemite University, Zarka, Jordan
Ibrahim L. Mukattash,
[email protected]
Department of Marketing, Faculty of Business Administration, Applied Science University. Amman, Jordan
Adnan M. Mukattash,
[email protected]
Department of Industrial Management, Emirates College of Technology, Abu Dhabi, UAE
Abstract-- Different grouping measures have been published in the literature for evaluation of machine-part matrices. In this paper three of these measures have been studied and analyzed against some manufacturing systems having alternative optimal solutions with the same sum of voids and exceptions and different cells size. The results of using these three measures showed the disability of distinguish between these manufacturing systems. The disability is due to the fact that cell size and quality of individual cells are not taken into consideration. To overcome these limitations a modified grouping measure based on cell utilization is proposed in this paper (Average Cell Utilization). The proposed measure has been tested and compared with these groping measures. The result shows that our proposed measure has the ability of distinguish between these manufacturing systems, which will lead to avoid or reduce the effects of some of the physical, technological, or organizational constraints and hence reduce costs.
Index Term--
Cell Formation, Grouping Measures, Average Cell Utilization
1. INTRODUCTION
The main idea of GT is to capitalize on similar manufacturing processes and features where similar parts are grouped into a part family and manufactured by a cluster of dissimilar machines (Wu, 1998).Cellular manufacturing (CM) is an important application of group technology (GT) in which sets (families) of parts are produced in manufacturing or a group of various machines, which are physical close together and can entirely process a family of parts. The identification of part families and machine groups in the design of cellular manufacturing systems is commonly referred to as cell design/formation (CF), (Mansouri et al., 2000). The primary input data are derived from route sheets. This data is in the form of a zero-one matrix where the rows represent the machines and the columns represent the parts.).
The CF techniques developed so far can be categorized into number of categories (Shailendra and Sharmai, 2014), (Boutsinas, 2013, Yin and Yasuda, 2006, Papaioannou and Wilson, 2010, and Yasuda et al., 2005)
(i) Similarity coefficient based methods,
(ii) Mathematical programming based methods,
(iii) Artificial intelligence based approaches,
(iv) Heuristics / meta-heuristics, and any combination of these.
Unfortunately, none of the above methods can find the optimal number of cells or the optimal solution of cell formation. Few papers in the literature can be found on this subject. (Jianwei W., 2013) developed an approach to determine the optimal cell number of manufacturing cell formation, (Mukattash 2000 ) (Mukkattash et al 2012) developed two different algorithms to find the optimal solution(s), (minimum sum of voids and exceptions) and (Dmitry and Boris 2012 )developed an exact model for cell formation .
The benefits of finding the optimal solution(s) are found to be:
1- It gives the facility designer the flexibility to choose between different optimal solutions
2- It is useful for small batch oriented production
3- It gives the facility designer the ability to control the cell size
4- It offers the facility designer three choices of part assignment to cells in accordance to his needs.
5- It gives the designer the flexibility of choosing the machine(s) inside the cell. Hence, the designer can choose a solution that reduces the effects of some of the physical, technological, or organizational constraints and hence reduce costs
2 . AV A I L A B LE ME A S U R E S F O R GO O D N E S S O F CE L LS
One of the first measures for evaluating the efficiency of block diagonal matrices, called “Grouping efficiency” (GE), Chandrasekhoran and Rajogopalan (1986) , it is defined as:
Grouping efficiency = q1+(1-q)2 ,
0 q 1
The number of non-zero elements in the diagonal block, ed, is given by:
ed=
r
k
i M
M
j N
N
r r
r r
1
11
11
a
ij
,Mo=0, No=0
and the number of non-zero element outside the diagonal blocks, eo. Then
1
1
2
1
1
e
M N
e
mn
M N
d r r r
k
o
r r r
k
The numerator of the expression for 1 is the number of non-zero elements in the diagonal block and the denominator the total number of elements therein . Similarly, 2 is the ratio of the number of zeros in the off-diagonal blocks to the total number of elements therein.
Grouping efficacy () Kumar and Chandrasekharan (1990) is defined as:
1
1
where:
Number of exceptional elements
Total number of operations
Number of
Total numb
voids in the diagonal blocks
er of operations
This expression has the requisite of non-negativity and zero to one range. Moreover, and are only ratios and are not affected by the size of the matrix. It also provide a quantitative basis for calculating the weighting factor q.
Below are the definitions used, Kumar and Chandrasekhoran (1990):
Block: A sub-matrix of the machine component incidence matrix formed by the intersection of columns representing a component family and rows representing a machine cell.
Voids:A zero element appearing in a diagonal block.
Exceptional element (or exception): A one appearing in the off - diagonal blocks.
Perfect block-diagonal form: A block diagonal form in which all diagonal blocks contain ones and all off-diagonal blocks contain zeros.
Another cell formation measure is the Grouping Capability Index (GCI): Hsu (1990 ) ,it is defined as:
GCI
e
e
o
1
where:
eo: number of exceptional elements in the machine-component matrix.
e: total number of one entries in the machine-component matrix.
3.SENSITIVITY ANALYSIS OF DIFFERENT EVALUATION
MEASURES
To analyze and study the behavior of the above measures two numerical problems are solved below.
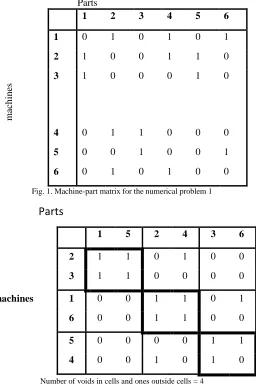
Problem 1:
Parts
1 2 3 4 5 6
1 0 1 0 1 0 1
2 1 0 0 1 1 0
m
ac
h
in
es
3 1 0 0 0 1 0
4 0 1 1 0 0 0
5 0 0 1 0 0 1
6 0 1 0 1 0 0
Fig. 1. Machine-part matrix for the numerical problem 1
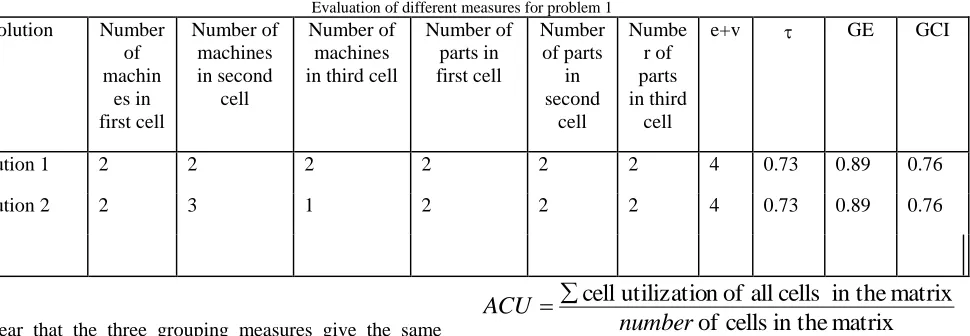
Parts
1 5 2 4 3 6
2 1 1 0 1 0 0
3 1 1 0 0 0 0
machines 1 0 0 1 1 0 1
6 0 0 1 1 0 0
5 0 0 0 0 1 1
4 0 0 1 0 1 0
Number of voids in cells and ones outside cells = 4 Fig. 2. Solution for Kusiak’s and Viswanathan’s approach
Alternative optimal solution for the same problem is shown in fig.3 (Mukattash 2000).
Parts
1 5 2 4 3 6
2 1 1 0 1 0 0
3 1 1 0 0 0 0
machines 1 0 0 1 1 0 1
4 0 0 1 0 1 0
6 0 0 1 1 0 0
5 0 0 0 0 1 1
Number of voids in cells and ones outside cells = 4 Fig. 3. Second solution
The result of cell formation gave two optimal solutions with minimum inter-cell movements. Then part assignment was done with minimum sum of voids and
Different optimal solutions will give the system designer the flexibility to choose between different solutions. For example we find machine number 5 in fig.3 isolated in the third cell. This optimal solution is badly needed since this machine may be huge, very sensitive or even dangerous machine. Whatever
the reason is, this second optimal solution gives more flexibility to the system designer.
Applying the different measures of goodness discussed earlier to evaluate the quality of the above different solutions. Table 1 below summarizes the results.
Table I
Evaluation of different measures for problem 1
Solution Number
of machin es in first cell Number of machines in second cell Number of machines in third cell
Number of parts in first cell Number of parts in second cell Numbe r of parts in third cell
e+v GE GCI
Solution 1 2 2 2 2 2 2 4 0.73 0.89 0.76
Solution 2 2 3 1 2 2 2 4 0.73 0.89 0.76
It is clear that the three grouping measures give the same results for the two solutions. Since the two solutions have different cell sizes, then these measures do not give consideration to the cell size. Moreover, the designer does not have the flexibility to choose one of these solutions since they all have the same quality of goodness. For the above reasons it is appropriate that a measure that can take into consideration all the above limitations of the existing measures be proposed.
The proposed measure is based on cell utilization which is defined as a number of non –zero elements of block-diagonal divided by block-diagonal matrix size of each cell ( Iraj et al.2007). Cell Utilization can be written as:
k
cell
of
Size
Matrix
diagonal
-Block
k
cell
in
s
Opoeration
of
Number
k
CU
And Average Cell Utilization is written as:
matrix
in the
cells
of
matrix
in the
cells
all
of
n
utilizatio
cell
number
ACU
The results of using the Average Cell Utilization (ACU) is shown in Table II. It is clear that the second solution is the best distribution between the two manufacturing systems.
TableII
Average cell utilization for the three manufacturing systems
Average cell utilization Cell 3 Cell 2 Cell 1 Cell utilization 0.916 0.75 100 100 Solution 1 0.94 100 0.83 100 Solution 2 Problem 2:
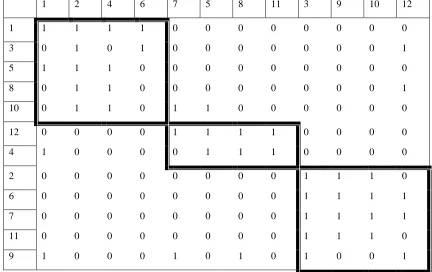
Assume a system contains 12-machines and 12-parts (Fig.4). The problem with three different alternate optimal solution is taken from the literature ( Mukattash 2003)
Ma
ch
in
e
1 2 3 4 5 6 7 8 9 10 11 12
1 1 1 0 1 0 1 0 0 0 0 0 0
2 0 0 1 0 0 0 0 0 1 1 0 0
3 0 1 0 0 0 1 0 0 0 0 0 1
4 1 0 0 0 1 0 0 1 0 0 1 0
5 1 1 0 1 0 0 0 0 0 0 0 0
6 0 0 1 0 0 0 0 0 1 1 0 1
7 0 0 1 0 0 0 0 0 1 1 0 1
8 0 1 0 1 0 0 0 0 0 0 0 1
9 1 0 1 0 0 0 1 1 0 0 0 1
10 0 1 0 1 1 0 1 0 0 0 0 0
11 0 0 1 0 0 0 0 0 1 1 0 0
12 0 0 0 0 1 0 1 1 0 0 1 0
Fig. 4 Machine-part matrix for the numerical problem 2
The following tables are three different solutions for the above problem. All the solutions have a number of exceptions equal to eight, and a number of voids equal to twelve. Moreover, the
Ma
ch
in
es
1 2 4 6 7 5 8 11 3 9 10 12
1 1 1 1 1 0 0 0 0 0 0 0 0
3 0 1 0 1 0 0 0 0 0 0 0 1
5 1 1 1 0 0 0 0 0 0 0 0 0
8 0 1 1 0 0 0 0 0 0 0 0 1
9 1 0 0 0 1 0 1 0 1 0 0 1
10 0 1 1 0 1 1 0 0 0 0 0 0
12 0 0 0 0 1 1 1 1 0 0 0 0
4 1 0 0 0 0 1 1 1 0 0 0 0
2 0 0 0 0 0 0 0 0 1 1 1 0
6 0 0 0 0 0 0 0 0 1 1 1 1
7 0 0 0 0 0 0 0 0 1 1 1 1
11 0 0 0 0 0 0 0 0 1 1 1 0
Number of voids in cells and ones outside cells = 20 Fig. 5. First solution
Ma
ch
in
e
1 2 4 6 7 5 8 11 3 9 10 12
1 1 1 1 1 0 0 0 0 0 0 0 0
3 0 1 0 1 0 0 0 0 0 0 0 1
5 1 1 1 0 0 0 0 0 0 0 0 0
8 0 1 1 0 0 0 0 0 0 0 0 1
10 0 1 1 0 1 1 0 0 0 0 0 0
12 0 0 0 0 1 1 1 1 0 0 0 0
4 1 0 0 0 0 1 1 1 0 0 0 0
2 0 0 0 0 0 0 0 0 1 1 1 0
6 0 0 0 0 0 0 0 0 1 1 1 1
7 0 0 0 0 0 0 0 0 1 1 1 1
11 0 0 0 0 0 0 0 0 1 1 1 0
9 1 0 0 0 1 0 1 0 1 0 0 1
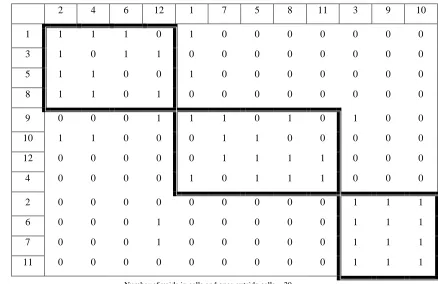
Ma
ch
in
es
2 4 6 12 1 7 5 8 11 3 9 10
1 1 1 1 0 1 0 0 0 0 0 0 0
3 1 0 1 1 0 0 0 0 0 0 0 0
5 1 1 0 0 1 0 0 0 0 0 0 0
8 1 1 0 1 0 0 0 0 0 0 0 0
9 0 0 0 1 1 1 0 1 0 1 0 0
10 1 1 0 0 0 1 1 0 0 0 0 0
12 0 0 0 0 0 1 1 1 1 0 0 0
4 0 0 0 0 1 0 1 1 1 0 0 0
2 0 0 0 0 0 0 0 0 0 1 1 1
6 0 0 0 1 0 0 0 0 0 1 1 1
7 0 0 0 1 0 0 0 0 0 1 1 1
11 0 0 0 0 0 0 0 0 0 1 1 1
Number of voids in cells and ones outside cells = 20 Fig. 7. Third solution
Applying the different measures of goodness discussed earlier to evaluate the quality of the above different solutions, the following table (Table III) was obtained.
Table III
Evaluation of different measures for problem 2
Table # machines in first cell
# machines in second
cell
# machines in third
cell
# parts in first cell
# parts in second cell
# parts in third cell
e+v GE GCI
2 4 4 4 4 4 4 20 ,64 .83 .77
3 5 2 5 4 4 4 20 .64 .83 .77
4 4 4 4 4 5 3 20 .64 .83 .77
The quality of each cell within the system cannot be determined by using the above measures. For the above reasons it is appropriate that a measure that can take into consideration all the above limitations of the existing measures be developed.
The result of using the average cell utilization (ACU) is shown in Table 4.It is clear that the third solution is the best distribution between the three manufacturing systems.
TableIV
Average cell utilization for the three manufacturing systems
Cell 3 Cell 2
Cell 1 Cell
utilization
0.75 0.875
0.687 0.687
Solution 1
0.77 0.8
0.875 0.65
Solution 2
0.779 1
0.65 0.687
4. SUMMARY AND CONCLUDING REMARKS
The existing measures in the literature do not have the ability to distinguish between any two or more manufacturing systems (matrices) having the same sum of voids and exceptions. Moreover, the existing measures in the literature do not give consideration to the cell size. Also, these measures do not have the ability to find the quality of individual cells inside the matrix. A modified grouping measure based on cell utilization (Average Cell Utilization) has been developed in this paper in order to overcome the above limitations. The result shows that our proposed measure has the ability of distinguish between these manufacturing systems. This feature of the proposed measure will give the designer to control the cell size and compare between these cells inside the same manufacturing system based on the efficiency of each cell. Finally,
the designer can choose a solution that reduces the effects of some of the physical, technological, or organizational constraints and hence reduce costs.
REFERENCES
[1] WU, N., 1998, A concurrent approach to cell formation and
assignment of identical machines in group technology.
International Journal of Production Research , 36 , 2099-2114.
[2] MANSOUR , S. A ., HUSSEIN, S. M., and NEWMAN, S.T.,
2000 , A review of the modern approaches to multi-criteria cell design .International Journal of Production Research , 38 , 1201-1218 .
[3] Shailendra K and Rajiv Kumar S.,2014,” Cell Formation Heuristic
Procedure Considering Production Data”Int. J. Prod. Manag. Eng.
2(2), 75-84
[4] Boutsinas, B. (2013). Machine-part cell formation using
biclustering. European Journal of Operational Research, 230(3):
563-572.
[5] Yin, Y., Yasuda, K. (2006). Similarity coefficient methods applied
to the cell formation problem: A taxonomy and review. Int. J. Production Economics, 101(2): 329-352.
[6] Papaioannou, G., Wilson, J.M. (2010). The evolution of cell
formation problem methodologies based on recent studies (1997–
2008):Review and directions for future research”. European
Journal of Operational Research, 206(3): 509-521
[7] Jianwei W,(2013), “An Approach to Determining the Optimal Cell
Number of Manufacturing Cell Formation”TELKOMNIKA, Vol.
11, No. 4, April 2013, pp. 1781~ 1786
[8] Mukattash, A.2000, Generation of three-cell formation algorithm
with minimum sum of voids and exception. Dirasat, Eng. Sci. Univ. of Jordan , 27: 96-109.
[9] Mukattash, A .M.,K. K. Tahboub, R.H. Fouad and A.A.
Al-Bashir,(2012),” A unified approach for desifning a cellular
manufacturing system by specifying number of cells,
Int.J.Appl.Math.Stat.,; Vol.27; No.3.
[10] Dmitry and Boris 2012,” An exact model for cell formation in group technology” Comput Manag Sci (2012) 9:323–338.
[11] Yin, Y., Yasuda K. (2005). Similarity coefficient methods applied
to the cell formation problem: A comparative investigation.
Computers &Industrial Engineering 48(3): 471-489
[12] KUMAR , C. S ., and CHANDRASEKHARAN, M. P., 1990 ,
Grouping efficacy : a quantitative criterion for goodness of block diagonal forms of binary matrices in group technology .
International Journal of Production Research , 28 ,233-243 .
[13] SARKER, B.R., and MONDAL,S., 1999 , Grouping efficiency
measures in cellular manufacturing: a survey and critical review.
International Journal of Production Research , 37 , 285-314. [14] HSU , C.P., 1990 , Similarity coefficient approaches to
machine-component cell formation in cellular manufacturing: a comparative
study, phD thesis, Industrial and Systems Engineering, University of Wisconsin- Milwaukee.
[15] KUSIAK, A., 1987a, The generalized group technology concept.
International J of Production Research, 25(4), 561 – 569
[16] Viswanathan ,S., 1996, A new approach for solving the p-median
problem in group technology. International Journal of Production Research, 34(10), 2691-2700.
[17] Harhalakis,J.,Nagi,R.and Proth,J.M.,1990,An efficient heuristic in
manufacturing cell formation for group technology applications.
International Journal of Production Research , 28 , 185-198 .
[18] Iraj,M., Babak,J. ,Kaveh.F. and Jannes.S.,2007. "Designing a new
mathematical model for cellular manufacturing system based on cell utilization". Applied Mathematics and Computation ,190 , 662-670
[19] Mukattash, A.2003, Grouping Cell Index: A Modified Cell
Formation Grouping Measure, Proceedings of the 31st