Down, P.M. (2016) Optimising decision making in
mastitis control. PhD thesis, University of Nottingham.
Access from the University of Nottingham repository:
http://eprints.nottingham.ac.uk/33913/1/PhDThesis_PeterDown_10.06.2016.pdf Copyright and reuse:
The Nottingham ePrints service makes this work by researchers of the University of Nottingham available open access under the following conditions.
This article is made available under the University of Nottingham End User licence and may be reused according to the conditions of the licence. For more details see:
http://eprints.nottingham.ac.uk/end_user_agreement.pdf
Optimising Decision Making in
Mastitis Control
Peter M. Down BVSc DipECBHM MRCVS
Thesis submitted to the University of Nottingham for
the degree of Doctor of Philosophy
2
Abstract
Mastitis remains one of the most common diseases of dairy cows and represents a large economic loss to the industry as well as a considerable welfare issue to the cows affected. Decisions are routinely made about the treatment and control of mastitis despite evidence being sparse regarding the likely consequences in terms of clinical efficacy and return on investment. The aim of this thesis was to enhance decision making around the treatment and prevention of mastitis using probabilistic methods. In Chapter 2 and Chapter 3, decision making around the treatment of clinical mastitis was explored using probabilistic sensitivity analysis. The results from Chapter 2 identified transmission to be the most influential parameter affecting the cost of clinical mastitis at cow level and, therefore, highlighted how important the prevention of transmission was in order to minimise losses associated with clinical mastitis. The cost-effectiveness of an on-farm culture (OFC) approach to the treatment of clinical mastitis was explored in Chapter 3, and compared with the cost-effectiveness of a ‘standard’ approach commonly used in the UK. The results of this study identified that the OFC approach could be cost-effective in some circumstances but this was highly dependent on the proportion of Gram-negative infections and the reduction in bacteriological cure rate that may occur as a result of the delay before treatment. Therefore, in the UK, this approach is unlikely to be cost beneficial in the majority of dairy herds.
3
In Chapters 4, 5 and 6, decision making around the control of mastitis was explored utilising data from UK dairy herds that had participated in a nationwide mastitis control plan. In Chapter 4, mastitis control interventions were identified that were not currently practised by a large proportion of herds, and the frequency at which they were made a priority by the plan deliverers was also reported. In Chapter 5 and Chapter 6, the cost-effectiveness of specific mastitis control interventions was explored within an integrated Bayesian cost-effectiveness framework from herds with a predominance of environmental intramammary infections. Results from the Bayesian microsimulations identified that a variety of interventions would be cost effective in different farm circumstances. The cost-effectiveness of different interventions has been incorporated in a decision support tool to assist optimal decision making by veterinary practitioners in the field.
4
Publications
Chapter 2
Down, P. M., Green, M. J., Hudson, C. D. 2013. Rate of transmission: A major determinant of the cost of clinical mastitis. J. Dairy Sci. 96, 6301-6314
Chapter 3
Down, P. M., Bradley, A. J., Breen, J. E., Green, M. J. Factors affecting the cost-effectiveness of an on-farm culture approach for the treatment of clinical mastitis in dairy cows. Submitted to J. Dairy Sci. 2016
Chapter 4
Down, P. M., Bradley, A. J., Breen, J. E., Hudson, C. D., Green, M. J. 2016. Current management practices and interventions prioritised as part of a nationwide mastitis control plan. Vet. Record. 178:449
Chapter 5
Down, P. M., Bradley, Breen, J. E., A. J., Browne, W. J., Kypraios, T., Green, M. J. A Bayesian micro-simulation to evaluate the cost-effectiveness of interventions for mastitis control during the dry period in UK dairy herds. Submitted to Prev. Vet. Med. 2016
5
Acknowledgements
The last 4 years have been both challenging and rewarding in equal measure and there are many people that have helped me along the way that I would like to thank.
Firstly, I would like to thank my primary supervisor, Professor Martin Green for all of the time, patience, encouragement and limitless enthusiasm that you have shown to me during this project and for making this whole experience such an overwhelmingly positive one. This was all your fault! And I will be forever grateful for your help in making this happen.
I would also like to thank my secondary supervisors, Dr Andrew Bradley, Professor Bill Browne and Dr Theo Kypraios, for your help and support at different times throughout this PhD.
A huge thanks also to Dr James Breen, for your help with technical issues with farm data and your ability to persuade vets to provide herd data when I had failed to and to Dr Chris Hudson, for your database skills and awesome macros.
This PhD was part funded by AHDB Dairy and I am extremely grateful for all of the encouragement and support that they have given to me over the years especially Dr Jenny Gibbons and Dr Ray Keatinge.
This project would not have been possible without the kind assistance of the many vets and consultants who shared their data with me. You are too many to name but you know who you are and I will happily buy any of you a beer by way of recompense to make up for the months of nagging that you have all suffered over the last few years!
Thank you to my friends and family for all of the love, prayers and support that you have given me during this PhD and for helping me to laugh during the difficult days.
Finally, a special thankyou to Shelley, Isaac and James, for your endless love, support and encouragement and for the many sacrifices that you have made to make this possible.
6
Contents
Chapter 1 Introduction ... 16 Background ... 16 1.1
The importance of mastitis in dairy cows ... 16 1.1.1
Mastitis pathogens ... 18 1.1.2
Historical perspective in the UK ... 20 1.1.3 Current UK Situation ... 21 1.1.4 Measuring mastitis ... 22 1.1.5 Mastitis Control ... 30 1.2
Risk factors associated with clinical mastitis ... 30 1.2.1
Risk factors associated with somatic cell count ... 33 1.2.2
Implications of study design ... 34 1.2.3
The Agriculture and Horticulture Development Board Dairy 1.2.4
Mastitis Control Plan ... 36 Statistical methods used in this thesis ... 38 1.3
Bayesian approach ... 39 1.3.1
Probabilistic sensitivity analysis ... 41 1.3.2
Integrated approach and micro-simulation ... 44 1.3.3
Markov Chain Monte Carlo for parameter estimation ... 45 1.3.4
Aims of the thesis ... 47 1.4
Summary ... 47 1.4.1
Overview of Chapters ... 47 1.4.2
Chapter 2 Transmission and the cost of clinical mastitis ... 50 Introduction ... 50 2.1
Materials and Methods ... 52 2.2
Model Structure ... 52 2.2.1
Model input parameters ... 60 2.2.2 Model Simulation ... 62 2.2.3 Data analysis ... 63 2.2.4 Results ... 64 2.3 Data analysis ... 64 2.3.1 Scenarios ... 65 2.3.2
7
Discussion ... 70 2.4
Conclusions ... 78 2.5
Chapter 3 The cost-effectiveness of an on-farm culture approach compared with a standard approach for the treatment of clinical mastitis in dairy cows ... 79
Introduction ... 79 3.1
Materials and methods ... 80 3.2
Model structure ... 80 3.2.1
Model input parameters ... 82 3.2.2
On-farm culture specific input parameters ... 82 3.2.3 Model simulation ... 85 3.2.4 Data analysis ... 85 3.2.5 Results ... 87 3.3 Data analysis ... 87 3.3.1
Scenario and sensitivity analysis ... 88 3.3.2
Discussion ... 91 3.4
Conclusions ... 96 3.5
Chapter 4 Current management practices and interventions prioritised as part of a nationwide mastitis control plan ... 98
Introduction ... 98 4.1
Materials and methods ... 99 4.2
AHDB Dairy Mastitis Control Plan (DMCP) ... 99 4.2.1 Farm selection ... 100 4.2.2 Data collection ... 100 4.2.3 Data analysis ... 100 4.2.4 Results ... 102 4.3 Mastitis parameters ... 103 4.3.1
Herd Management Practices ... 105 4.3.2 Discussion ... 108 4.4 EDP herds ... 108 4.4.1 EL herds ... 111 4.4.2 CDP/CL herds ... 112 4.4.3 Conclusions ... 116 4.5
8
Chapter 5 A Bayesian micro-simulation to evaluate the
cost-effectiveness of specific interventions for mastitis control during the dry
period ……….117
Introduction ... 117 5.1
Materials and methods ... 119 5.2
Data collection ... 119 5.2.1
Data analysis ... 120 5.2.2
Somatic cell count micro-simulation model ... 128 5.2.3 Results ... 129 5.3 Herd parameters ... 129 5.3.1 Interventions... 129 5.3.2 Micro-simulation models ... 130 5.3.3 Discussion ... 137 5.4 Conclusions ... 142 5.5
Chapter 6 A Bayesian micro-simulation to evaluate the
cost-effectiveness of specific interventions for mastitis control during lactation ……….143 Introduction ... 143 6.1
Materials and methods ... 144 6.2 Data collection ... 144 6.2.1 Data analysis ... 145 6.2.2 Results ... 149 6.3 Herd parameters ... 149 6.3.1 Interventions... 149 6.3.2 Micro-simulation models ... 150 6.3.3 Discussion ... 156 6.4 Conclusions ... 163 6.5
Chapter 7 Discussion and Conclusions ... 164 Discussion ... 164 7.1
Treatment of clinical mastitis ... 164 7.1.1
Mastitis control ... 169 7.1.2
Potential future work ... 173 7.1.3
Conclusions ... 175 7.2
Chapter 2 ... 175 7.2.1
9 Chapter 3 ... 176 7.2.2 Chapter 4 ... 176 7.2.3 Chapter 5 ... 177 7.2.4 Chapter 6 ... 177 7.2.5 Overall ... 177 7.2.6 References ... 179 Appendices ... 214 Appendix 1 ... 214
Example of the WinBUGS code for the cost of clinical mastitis model from Chapter 2. ... 214
Appendix 2 ... 254
Example of WinBUGS code for cost-effectiveness model from Chapter 5 ... 254
Appendix 3 ... 256
EDP Interventions investigated in Chapter 5 ... 256
Appendix 4 ... 264
10
Figures
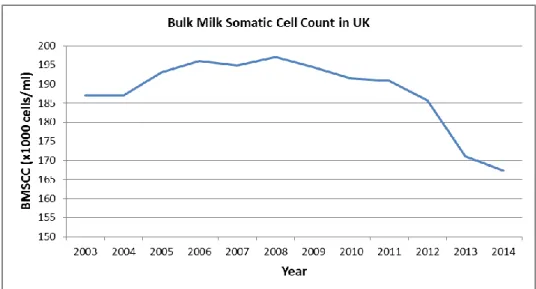
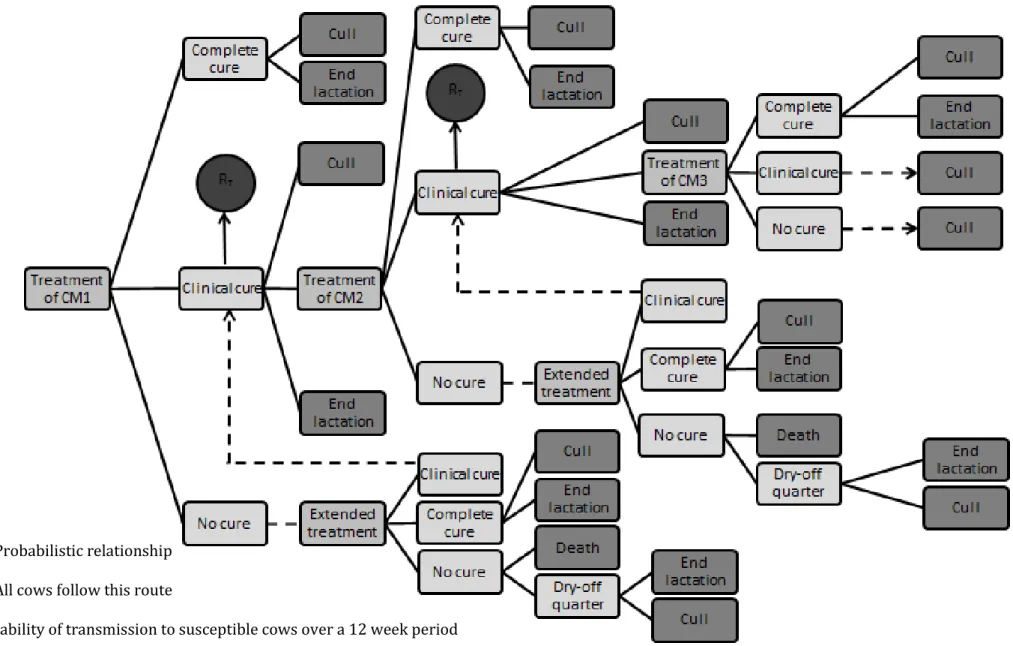
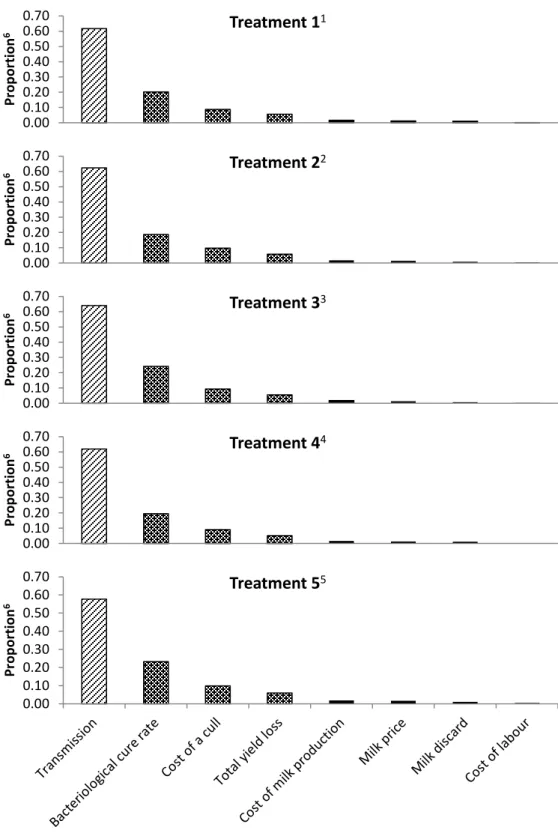
Figure 1-1 UK average bulk milk somatic cell count over time. ... 21 Figure 1-2 Cases of clinical mastitis of dry-period origin plotted over time. ... 24 Figure 1-3 Cases of clinical mastitis of lactation origin plotted over time 24 Figure 1-4 Dry period new infection rate over time. ... 27 Figure 1-5 Dry period cure rate over time ... 27 Figure 1-6 Lactation new infection rate over time ... 28 Figure 1-7 Percentage of cows infected and chronically infected over time ... 29 Figure 1-8 Apparent cure rates over time. ... 29 Figure 2-1 Schematic representation of the treatment model. ... 57 Figure 2-2 Bar charts depicting the proportion of variance in the total cost of clinical mastitis accounted for by each variable for each of the
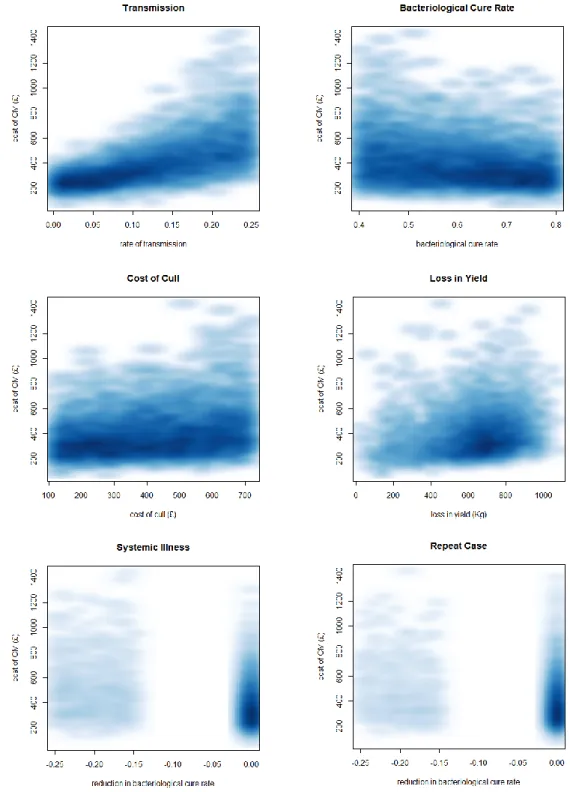
treatment protocols ... 67 Figure 2-3 Series of scatterplots demonstrating the relationship between the predictor variable and the total cost of clinical mastitis (CM) for
treatment 1 (3 days intramammary antibiotic). ... 69 Figure 2-4 Tornado plot to demonstrate the predicted effect of a given change in one of the predictor variables on the total cost of clinical
mastitis when all of the others remain constant. ... 70 Figure 3-1 Difference in cost between standard and OFC protocol (all scenarios). ... 89 Figure 3-2 Difference in cost between standard and OFC protocol (SD)... 89
11
Figure 3-3 Difference in cost between standard and OFC protocol (MD). 90 Figure 3-4 Difference in cost between standard and OFC protocol (LD). . 91 Figure 4-1 Geographical location of herds in the study ... 102 Figure 5-1 Overview of the 1-step micro-simulation procedure using the clinical mastitis micro-simulation model as an example. ... 122 Figure 5-2 Distribution of the outcome variable for the clinical mastitis regression model. ... 124 Figure 5-3 Distribution of the outcome variable for the somatic cell count regression model. ... 125 Figure 5-4 Probabilistic cost-effectiveness curve for use of individual calving pens. ... 132 Figure 5-5 Probabilistic cost-effectiveness curve for removing dung from dry-cow cubicles at least twice daily. ... 132 Figure 5-6 Probabilistic cost-effectiveness curve for removing calves within 24hrs of birth. ... 133 Figure 5-7 Probabilistic cost-effectiveness curve for checking all quarters within 24hrs of calving. ... 133 Figure 5-8 Scatterplot of observed and predicted values of the percentage change in CMDP... 134 Figure 5-9 Scatterplot of observed and predicted values of the percentage change in DPNIR. ... 134 Figure 6-1 Distribution of the outcome variable for the clinical mastitis regression model. ... 147 Figure 6-2 Distribution of the outcome variable for the somatic cell count regression model. ... 147
12
Figure 6-3 Scatterplot of observed and predicted values of the percentage change in the incidence rate of clinical mastitis after the first 30 days of lactation (CMLP). ... 153 Figure 6-4 Scatterplot of the observed and predicted values of the
monthly rate of LNIR. ... 153 Figure 6-5 Probabilistic cost-effectiveness curve for keeping a closed herd. ... 154 Figure 6-6 Probabilistic cost-effectiveness curve for having good fly
control for all lactating cows and heifers. ... 155 Figure 6-7 Probabilistic cost-effectiveness curve for using an NSAID when treating Grade 3 clinical mastitis cases. ... 155 Figure 6-8 Probabilistic cost-effectiveness curve for having a bedded lying area of 1.25m2/1000L of milk/cow. ... 156
13
Tables
Table 2-1 Probability distributions specific to the 5 defined clinical
mastitis antimicrobial treatment protocols ... 54 Table 2-2 Probability distributions applicable to all 5 antimicrobial
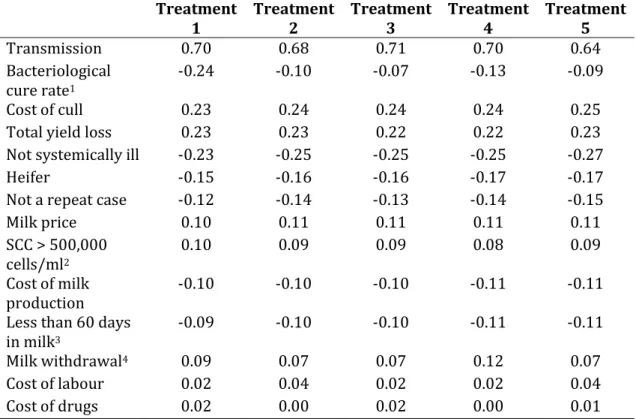
clinical mastitis (CM) treatment protocols ... 58 Table 2-3 Spearman rank correlation coefficients measuring the statistical dependence between the specified variable and the total cost of clinical mastitis estimated in the complete model. ... 66 Table 2-4 Breakdown of average (median) costs (£) associated with a case of clinical mastitis (CM) for each treatment protocol (2.5th and 97.5th percentiles given in parenthesis). ... 68 Table 3-1 Probability distributions applicable to both treatment protocols ... 84 Table 3-2 On-farm culture specific model input parameters ... 86 Table 3-3 Spearman rank correlation coefficients for on-farm specific model input parameters ... 88 Table 4-1 Mastitis parameter definitions ... 101 Table 4-2 General performance parameters and mastitis indices. Range of 12 month averages given (lowest-highest) with median value in
parenthesis ... 104 Table 4-3 Proportion of herds practising each intervention at the time of the study ... 106
14
Table 5-1 Probability of saving at least £1000 after 12 months at different incidence rates of clinical mastitis in the first 30 days after calving
(CMDP) and different costs of implementing the intervention. ... 135 Table 5-2 Probability of saving at least £1000 after 12 months at different rates of DPNIR and different costs of implementing the intervention. ... 136 Table 6-1 Probability of saving at least £1000 after 12 months at different incidence rates of clinical mastitis after the first 30 days of lactation
(CMLP) and different costs of implementing the intervention. ... 151 Table 6-2 Probability of saving at least £1000 after 12 months at different starting rates of LNIR and different costs of implementing the
15
Abbreviations
CM Clinical mastitisSCC Somatic cell count
BMSCC Bulk milk somatic cell count IRCM Incidence rate of clinical mastitis CMDP Clinical mastitis of dry-period origin CMLP Clinical mastitis of lactation origin
DPNIR Dry-period acquired new intramammary infection LNIR Lactation acquired new intramammary infection DPCR Dry-period cure rate
DMCP AHDB Dairy Mastitis Control Plan EDP Environmental dry-period
EL Environmental lactation CDP Contagious dry-period
CL Contagious lactation
RCT Randomised controlled trial PSA Probabilistic sensitivity analysis MCMC Markov chain Monte Carlo
IMI Intramammary infection
ml Millilitres
DCT Dry cow therapy
16
Chapter 1
Introduction
Background
1.1
The importance of mastitis in dairy cows 1.1.1
Bovine mastitis can be defined as ‘inflammation of the mammary gland’ and can have either an infectious or non-infectious aetiology (Bradley, 2002). Bovine mastitis can be classified as being either clinical (CM), whereby gross changes are seen in the milk, or subclinical if no such changes are visible but changes in the secretion are present, such as an increase in somatic cell count (SCC). Mastitis is the most costly infectious disease affecting dairy cattle, accounting for 38% of the total direct costs of the common production diseases (Huijps et al., 2008; Kossaibati and Esslemont, 1997). A conservative estimate for the total cost of CM to the UK dairy industry alone is in excess of £168 million annually (Bradley, 2002). The cost of subclinical mastitis to the industry is harder to quantify as it is more variable and includes more hidden costs such as reduced yield, increased risk of culling and increased risk of clinical mastitis. However, a Dutch study found that the majority (55%) of the total cost of mastitis is caused by subclinical infections (Huijps et al., 2008).
Whilst the economic consequences of mastitis are reasonably well defined, the same is not true with respect to the impact that mastitis has on the welfare of the affected cows. There is, however, an increasing awareness within the industry of this aspect of the disease (Fitzpatrick et
17
al., 1998; Huxley and Whay, 2007; Leslie and Petersson-Wolfe, 2012) and a general acceptance of welfare guidelines such as the five freedoms (Farm Animal Welfare Council Press Statement, 1979) and advice given by the Farm Animal Welfare Council (Farm Animal Welfare Council, 2009) and European Food Safety Authority (Algers et al., 2009). One of the ‘five freedoms’ is “Freedom from Pain, Injury and Disease” and therefore, it is incumbent on all those working with dairy cows to be aware of the potential impact that mastitis has on the health and well-being of the dairy cow population.
Other factors which have been shown to motivate farmers to improve mastitis management include job satisfaction, external recognition from peers and improved milk quality (Valeeva et al., 2007). In addition to these incentives for reducing mastitis in dairy cows, there is also increasing pressure on the industry to reduce the use of antimicrobial drugs in food-producing animals because of possible implications for human health through the emergence of antibiotic-resistant strains of bacteria (White and McDermott, 2001). This pressure has led to the banning of some antimicrobial drugs from use in food producing animals in certain countries already (Page, 1991) and has prompted a widespread call for governments to implement stricter controls on the use of ‘high risk’ antimicrobial drugs such as 3rd and 4th generation cephalosporins
and fluoroquinolones (EFSA, 2011). Given that the treatment of mastitis accounts for the majority of the total antimicrobial drug usage on most dairy farms (Pol and Ruegg, 2007), this represents a further compelling
18
reason for striving to reduce mastitis in dairy cows and to consider carefully how we apply the use of antimicrobial drugs in the treatment and control of mastitis.
Mastitis pathogens 1.1.2
Most cases of mastitis occur in response to a bacterial infection of the mammary gland, but other agents that are known to cause mastitis in dairy cows include mycoplasmas, yeasts and algae. More than 130 different pathogens have been associated with bovine mastitis (Watts, 1988). The vast majority of mastitis in the UK is of bacterial origin with just four species (Escherichia coli, Streptococcus uberis, Staphylococcus aureus and Streptococcus dysgalactiae) accounting for over 70% of all diagnoses made (Anon, 2009).
Mastitis pathogens have historically been classified as either ‘contagious’ or ‘environmental’ (Blowey and Edmondson, 2010). Contagious bacteria commonly exist within the mammary gland and are transmitted from cow to cow during the milking process (Radostits et al., 1994). They are associated with persistent infections which are reflected by a raised SCC. The bacteria most likely to behave in a contagious manner include Staphylococcus aureus, Streptococcus dysgalactiae and Streptococcus agalactiae. Environmental bacteria are not adapted to survive in the host but are opportunistic invaders from the cow’s environment. These are generally acquired between milkings, multiply, instigate an immune response and are rapidly dealt with by the immune system resulting in a transient increase in SCC. The bacteria most likely to infect cows via the
19
environment include the Enterobacteriacae and Streptococcus uberis. The distinction between contagious and environmental pathogens is not clear cut and there appears to be some overlap of transmission behaviour within pathogen species. This has been highlighted by studies that have demonstrated persistent infections with both Strep. uberis (Todhunter et al., 1995; Zadoks et al., 2003) and E. coli (Bradley and Green, 2001a; Döpfer et al., 1999; Hill and Shears, 1979; Lam et al., 1996b) in addition to studies that have shown that E. coli is quite capable of causing recurrent infections (Bradley and Green, 2001a; Lam et al., 1996b). It is not possible, therefore, to definitively categorise a mastitis pathogen as being contagious or environmental based on bacteriology alone and any bacteriology results should be interpreted in light of the mastitis epidemiology for a given farm (Green, 2012).
Mastitis pathogens have also historically been classified as either ‘major’ or ‘minor’ pathogens based on the inflammatory response that they engender and their propensity to cause clinical signs. The ‘major’ pathogens comprise Staph. aureus, Strep. dysgalactiae, Strep. agalactiae, Strep. uberis and the Enterobacteriacae. The ‘minor’ pathogens comprise the Corynebacterium spp. and the coagulase-negative Staphylococcus spp (CNS). The ‘minor’ pathogens are generally associated with mild immune responses and rarely with clinical signs, however, as discussed previously, this classification is often considered to be too simplistic as some strains of Staph. aureus are coagulase negative and could, therefore, be classed as ‘minor’ pathogens which they are not (Green, 2012).
20 Historical perspective in the UK 1.1.3
In the 1940’s, the average herd size in the UK was approximately 15 cows (Bradley, 2002) and the average bulk milk somatic cell count (BMSCC) was approximately 750,000 cells/ml (Booth, 1997). This situation changed considerably in the 1960’s with the introduction of the 5-point plan which was devised from research at the National Institute for Research in Dairying in Reading (Kingwill et al., 1970; Neave et al., 1969, 1966; Smith et al., 1967). The plan consisted of the rapid identification and treatment of clinical mastitis, the routine application of antibiotic dry cow therapy at drying off, post-milking teat disinfection, the culling of chronically infected cows and the routine maintenance of the milking machine. This was further compounded by the implementation of EC Milk Hygiene Directive (92/46) that stipulated an upper BMSCC of 400,000 cells/ml for milk destined for human consumption and the addition of financial bonuses offered to producers via the milk buyers for the production of milk with lower SCC. The result of the 5-point plan and the EC milk hygiene directive was a rapid reduction in BMSCC from over 600,000 cells/ml in 1967 to just over 400,000 cells/ml in 1982 (Booth, 1997) and a reduction in the incidence of CM from over 150 cases/100 cows/year to around 40 cases/100 cows/year over the same period of time (Wilesmith et al., 1986; Wilson and Kingwill, 1975). The main driver behind the success of the 5-point plan appeared to be in reducing Gram-positive infections caused by contagious pathogens, the prevalence of which has reduced dramatically since the 1960’s. A study by Wilson and Kingwill. (1975) showed that contagious pathogens accounted for almost
21
60% of clinical mastitis cases in 1967 whereas Bradley et al. (2007b) showed that they accounted for just 10% by 2005.
Current UK Situation 1.1.4
With respect to the current situation in the UK, the average herd size is currently 133 cows (AHDB Dairy, 2014) and the most recent study suggested that the incidence rate of clinical mastitis was likely to be between 47 and 65 cases per 100 cows per year (Bradley et al., 2007b). This is higher than many previous estimates (Berry, 1998; Milne et al., 2002; Peeler et al., 2000, 2002), but in line with several others (Bradley and Green, 2001b; Kossaibati et al., 1998; Wilesmith et al., 1986). All of these studies have the potential of introducing selection bias as a result of farmers having to volunteer to participate in the surveys.
The average BMSCC is currently around 167,000 cells/ml, and this has reduced each year since 2009 (DairyCo, 2015), which corresponds with the time that the national mastitis control plan was launched in the UK (Figure 1-1).
22
The aetiology of clinical mastitis in the UK, taken from the study by Bradley et al. (2007b), suggests that pathogens traditionally classified as ‘environmental’ now predominate, accounting for around 60% of positive samples, with Strep. uberis being the most common pathogen. In contrast, pathogens traditionally classified as ‘contagious’ accounted for around 13% of diagnoses made. This finding is in broad agreement with previous studies (Bradley and Green, 2001b; Milne et al., 2002; Wilesmith et al., 1986) that all show that ‘environmental’ pathogens are the main cause of clinical mastitis in most UK dairy herds.
Measuring mastitis 1.1.5
The primary measures of mastitis in dairy cows are the incidence rate of clinical mastitis (IRCM), which is typically reported in cases/100 cows/year, and somatic cell count, which is typically reported in cells/ml. Clinical mastitis
The conventional approach to CM analysis has been focused on the reporting of basic quarter and cow rates and incidences as well as certain ratios, such as the case-to-cow-case ratio (total number of quarter-cases/number of cow-cases) (Bradley et al., 2008a). Whilst the absolute rates and ratios give some indication as to the extent and likely aetiology of mastitis on a particular dairy farm, they are less informative when it comes to the targeting of mastitis control interventions and, for this, a different approach is required. One such approach is to categorise CM by its putative origin based on the temporal occurrence during the lactation cycle in which it presents, with cases that occur in early lactation
23
attributed to the dry period (Bradley et al., 2008b). This approach stems from studies that demonstrated that intramammary infections may be acquired from the environment during the dry period (Berry and Hillerton, 2002; Bradley and Green, 2001c; Eberhart and Buckalew, 1977; Oliver and Mitchell, 1983; Smith et al., 1985; Todhunter et al., 1991; Williamson et al., 1995), and that these infections are able to persist in the udder and cause CM in the subsequent lactation (Green et al., 2002; McDonald and Anderson, 1981). In the study by Green et al. (2002), it was demonstrated that over 50% of all environmental mastitis occurring in the first 100 days of lactation resulted from infections acquired during the dry period. A subsequent study demonstrated that much of the peak in clinical mastitis seen in early lactation can be attributed to dry period infections, particularly cases occurring in the first month of lactation (Green et al., 2002). Therefore, the incidence rate of clinical mastitis in the first 30 days of lactation can be a useful proxy for the rate of dry-period origin infections (Bradley et al., 2008b), and this novel approach has been demonstrated as being helpful in the targeting of mastitis interventions at herd level (Green et al., 2007b).
The target commonly used in the UK for clinical mastitis of dry-period origin is <1 in 12 (1 case for every 12 cows in the herd per year) and the target for clinical cases of lactation origin (clinical cases after the first 30 days of lactation) is typically <2 in 12, giving an overall rate of fewer than 3 in 12 cows affected in a lactation cycle (Bradley et al., 2008b) (Figure 1-2 and Figure 1-3).
24
Figure 1-2 Cases of clinical mastitis of dry-period origin plotted over time.The light
blue bars illustrate the number of cows at risk and the dark blue line illustrates the rolling 3-recording rate of dry period new infections. MAR = maximum advisable rate (target). (TotalVet©)
Figure 1-3 Cases of clinical mastitis of lactation origin plotted over time. The light
green bars illustrate the number of cows at risk and the dark green line illustrates the rolling 3-recording rate of lactation origin infections. (TotalVet©)
Somatic cell count
The majority of somatic cells found in milk are leukocytes including macrophages, lymphocytes and neutrophils (Lee et al., 1980; Sordillo et al., 1997). The number of somatic cells in milk is known to be affected primarily by intramammary infections (Schepers et al., 1997) due to the massive influx into the udder of peripheral neutrophils (Paape et al., 2002; Sordillo et al., 1997), making it a useful marker of subclinical mastitis.
25
Cow level SCC data is relatively easy to collect and readily available in most milk recorded herds, compared with CM data, and the concentrations of somatic cells are used to categorise individual cows as ‘infected’ or ‘uninfected’ according to defined thresholds. An SCC of < 100,000 cells/ml is generally accepted to indicate the absence of infection (Sordillo et al., 1997), whereas a SCC > 200,000 cells/ml is indicative of a bacterial infection (Brolund, 1985; Schepers et al., 1997). The widely accepted threshold above which cows are considered to be ‘infected’ is 200,000 cells/ml although test sensitivity is reduced at this threshold in herds with a high prevalence of ‘minor’ pathogens (Dohoo and Leslie, 1991). Therefore, most standard approaches to measuring subclinical mastitis in dairy herds focus on the movements of cows above and below this threshold. Historically, SCC analysis typically comprised the proportion of cows above 200,000 cells/ml, the proportion of the herd chronically infected (> 200,000 cells/ml for 2 or more consecutive recordings) and the bulk milk somatic cell count (SCC of composite milk sample from all milking cows). With advances in computer software, it is possible to perform an in-depth and robust SCC analysis whereby specific SCC indices are used to characterise the mastitis epidemiology for a particular dairy farm. Commonly reported SCC parameters now include the lactation new infection rate (LNIR) which is a measure of the proportion of cows moving from a SCC < 200,000 cells/ml, to a SCC > 200,000 cells/ml each month, dry period new infection rate (DPNIR) which is a monthly measure of the proportion of cows that have a SCC > 200,000 cells/ml at the first milk recording after calving that had a SCC <
26
200,000 cells/ml at the last milk recording before being dried-off and dry period cure rate which is a monthly measure of the proportion of cows that had a SCC < 200,000 cells/ml at the first milk recording after calving that had a SCC > 200,000 cells/ml at the last milk recording before being dried-off (Bradley et al., 2007a).
As with CM data, the relative importance of the dry-period may also be reflected in somatic cell count trends such as the dry-period new infection rate and the dry-period cure rate. Common targets for these are <10%/month and >85%/month respectively, however, the dry period cure rate tends to decrease as the rate of dry period new infection rate increases, as a result of reinfection of previously high SCC quarters that had cured earlier during the dry-period, and this needs to be factored into the interpretation of dry-period data (Figure 1-4 and Figure 1-5).
The lactation new infection rate (LNIR) provides a measure of the proportion of cows acquiring a new intramammary infection between consecutive milk recordings and this can also be a useful measure of the relative importance of the dry-period versus lactation (Figure 1-6). A common target is 5-7%/month moving from SCC < 200,000 cells/ml to > 200,000 cells/ml, although the UK mean is likely to be nearer 10%/month (Green, 2012).
27
Figure 1-4 Dry period new infection rate over time. The dark blue bars represent
the percentage of cows, within 30 days of calving with a somatic cell count > 200,000 cells/ml; the light yellow and light green bars illustrate the number of cows at the first recording (and < 30 days in milk) and the number defined as ‘infected’, respectively; the red line illustrates the rolling 3-monthly rate of dry period new infections and the orange line represents the target. (TotalVet©).
Figure 1-5 Dry period cure rate over time. The dark blue bars represent the
percentage of cows, within 30 days of calving with a somatic cell count < 200,000 cells/ml that had a SCC > 200,000 cells/ml at their last milk-recording prior to drying-off; the light yellow and light green bars illustrate the number of eligible cows (SCC > 200,000 cells/ml at their last milk recording prior to drying-off) at the first recording (and < 30 days in milk) and the number defined as ‘cured’, respectively; the red line illustrates the rolling 3-monthly rate of dry period cure rate and the orange line represents the target. (TotalVet©)
28
Figure 1-6 Lactation new infection rate over time. The yellow bars represent the
percentage of animals at each recording (of those eligible) that experience a lactation new infection (i.e. move from SCC < 200,000 cells/ml to SCC > 200,000 cells/ml). The light green bars indicate the number of animals experiencing a lactation new infection. The green line provides a 3-monthly rolling average rate and the orange line represents the target. (TotalVet©)
Both clinical mastitis and somatic cell count data can be used to provide an insight into whether the pathogens present on a specific dairy farm are behaving in a predominantly environmental manner or in a predominantly contagious manner. This is based on the observation that contagious pathogens tend to cause persistent infections and have a lower cure rate following treatment than environmental pathogens (Sears and McCarthy, 2003). A herd with a predominance of pathogens behaving in a contagious manner will, therefore, tend to have a high prevalence of ‘infected’ (SCC > 200,000 cells/ml) and chronically ‘infected’ cows (SCC > 200,000 cells/ml for 2 of the previous 3 consecutive recordings) at a particular time point (Bradley et al., 2007a) (Figure 1-7). They would also tend to have a reduced cure rate of the 1st clinical mastitis cases in
lactation (Figure 1-8), as defined as no recurrence of clinical disease and either 2 consecutive cow somatic cell counts < 100,000 cells/ml or 3 < 200,000 cells/ml.
29
Figure 1-7 Percentage of cows infected and chronically infected over time. The
yellow bars represent the percentage of the milking herd with a SCC > 200,000 cells/ml; the light blue bars indicate the number of animals with a SCC > 200,000 cells/ml; the red bars show the percentage of the milking herd defined as chronically infected (SCC > 200,000 cells/ml for 2 of the last 3 consecutive recordings). The green line provides a 3-monthly rolling average proportion of the herd with a SCC > 200,000 cells/ml and the blue line is the 3-monthly rolling average proportion of the herd chronically ‘infected’. (TotalVet©)
Figure 1-8 Apparent cure rates over time. The light blue bars indicate the monthly
dry-period cure rate as measured by somatic cell count (percentage of cows < 30 days in milk with a SCC < 200,000 cells/ml that had a SCC > 200,000 cells/ml at the last milk recording before drying-off); the green line indicates the 12-month rolling average clinical 1st case cure rate (no recurrence of clinical disease after a 1st clinical case and either 2 consecutive SCC < 100,000 cells/ml or 3 consecutive SCC < 200,000 cells/ml); the red line indicates the 12-month rolling average all case cure rate (no recurrence of clinical disease after a clinical case and either two consecutive SCC < 100,000 cells/ml or three consecutive SCC < 200,000 cells/ml); the blue line indicates the 12-month rolling average subclinical case cure rate (either two consecutive SCC < 100,000 cells/ml or three consecutive SCC < 200,000 cells/ml after the treatment of a subclinical case) *no subclinical cases were treated in this herd. (TotalVet©).
30
Using the CM and SCC parameters in this way to characterise the epidemiology of mastitis for a given farm, both in terms of the putative source of the majority of new infections as well as the likely behaviour of pathogens present on the farm, is one of the key features of the UK national mastitis control scheme (Green et al., 2007b).
Mastitis Control
1.2
Whilst bulk milk somatic cell counts and the prevalence of subclinical mastitis have decreased nationally, the incidence of CM remains a problem for many dairy herds. It has been demonstrated that BMSCC and IRCM are not correlated (Barkema et al., 1998b), and that as BMSCC reduces, the variation in the IRCM observed increases (Barkema et al., 1998b). It has also been reported that herds with a low BMSCC tend to have higher levels of environmental mastitis than herds with a higher BMSCC (Barkema et al., 1998b; Elbers et al., 1998; Erskine et al., 1988; Hutton et al., 1990), which is in agreement with the reported shift in the aetiology of mastitis cases in the UK, as referred to previously. The challenge with respect to environmental mastitis is that the interventions that have successfully controlled contagious mastitis do not appear to have the same efficacy against the causes of environmental mastitis and, therefore, a different approach is required.
Risk factors associated with clinical mastitis 1.2.1
During the last 40 years, there have been a vast number of published studies reporting associations between quarter-level, cow-level and herd-level risk factors and the incidence of clinical mastitis. Most of these
31
studies were performed outside of the UK and the findings are, therefore, not always applicable to the UK context. They range from small-scale studies investigating one specific risk factor (e.g. post-milking teat disinfection) to large-scale studies looking at many risk factors in a specific ‘type’ of herd (e.g. low BMSCC). Despite these limitations, a number of specific risk factors were common to two or more of these studies.
Certain aspects of management that increased the exposure of cows to environmental pathogens were consistently associated with an increased IRCM, such as housing on straw yards (Barnouin et al., 2005; Peeler et al., 2000) and cleaning out the straw yards housing the milking cows less often than every 6 weeks (O’Reilly et al., 2006). Low frequency of cubicle cleaning (Elbers et al., 1998; Schukken et al., 1991, 1990) and a low quantity of bedding in cubicles (Elbers et al., 1998; Schukken et al., 1991) were both associated with an increased IRCM. Hygiene of calving pens, specifically the frequency of disinfection/cleaning and quantity of bedding were also negatively correlated with IRCM in several studies (Barkema et al., 1999a; Elbers et al., 1998; Peeler et al., 2000). The size of the air inlet in milking cow sheds was positively correlated with the IRCM caused by Strep. uberis in one study (Barkema et al., 1999a), but the presence of an air inlet along the roof was associated with a reduced risk of clinical mastitis caused by Staph. aureus in another study (Schukken et al., 1991). The source of the cows’ drinking water was associated with an increased risk of clinical mastitis when originating from a stream or a well
32
as opposed to public sources (Barkema et al., 1999a; Schukken et al., 1991, 1990).
Aspects of management related to the milking process were also identified by several studies, including the application of post-milking teat disinfection (Barkema et al., 1999a; Elbers et al., 1998; Peeler et al., 2000; Schukken et al., 1991, 1990), the practice of foremilking (Barkema et al., 1999a; Elbers et al., 1998; O’Reilly et al., 2006; Peeler et al., 2000; Schukken et al., 1990), which were both associated with an increased IRCM. The wearing of gloves during milking (O’Reilly et al., 2006; Peeler et al., 2000) was associated with an increased IRCM, as was the wet preparation of teats before milking (Barkema et al., 1999a; Schukken et al., 1991). The drying of wet teats with a cloth after premilking preparation was associated with an increased IRCM in one study (Barkema et al., 1999a) and a decreased IRCM in another (O’Reilly et al., 2006). The proportion of cows leaking milk either just before or after milking seemed to be important, with several studies reporting a positive correlation with the IRCM (Elbers et al., 1998; O’Reilly et al., 2006; Peeler et al., 2000; Schukken et al., 1991, 1990).
Other cow-level factors that were associated with IRCM include breed and milk yield, with Meuse-Rhine-Yssel breeds being associated with an increased risk (Elbers et al., 1998; Schukken et al., 1991, 1990) as well as Holstein-Friesians (Barkema et al., 1999a) and Swedish-Holsteins (Nyman et al., 2007) and higher milk yields being positively correlated
33
with IRCM (Barnouin et al., 2005; Chassagne et al., 1998; O’Reilly et al., 2006; Schukken et al., 1990).
Risk factors associated with somatic cell count 1.2.2
Due to the relative availability of SCC data, there are a considerable number of risk factor studies relating herd management with BMSCC and these have been reviewed recently (Dufour et al., 2011). A key strength of this review was its ability to identify practices that have shown consistent associations with SCC under differing circumstances and which are therefore most likely to be relevant to the largest number of dairy farms. Management variables related to the milking process were some of the most consistent including wearing gloves during milking, which was associated with a low SCC (Bach et al., 2008; Hutton et al., 1991; Rodrigues et al., 2005), the use of automatic cluster removal systems, which was associated with a low SCC (Barkema et al., 1998a; Hutton et al., 1990; Jayarao et al., 2004; Smith and Ely, 1997; Wenz et al., 2007) and post-milking teat disinfection, which was associated with a low SCC (Barkema et al., 1998a; Erskine and Eberhart, 1991; Erskine et al., 1987; Hutton et al., 1991; Khaitsa et al., 2000). The order of milking (e.g. milking high SCC and clinical mastitis cases last) has been associated with a low SCC in several studies (Barnouin et al., 2004; Hutton et al., 1991; Wilson et al., 1995) as has inspecting the milking machine at least annually (Barkema et al., 1998a; Erskine et al., 1987; Hutton et al., 1990; Rodrigues et al., 2005) and keeping cows standing after milking (Barkema et al., 1998a; Barnouin et al., 2004). It is interesting to note that wearing gloves
34
during milking and post-milking teat disinfection were both associated with an increased incidence of CM despite being associated with a reduced SCC. This highlights how poorly correlated CM and SCC are (Barkema et al., 1998b), and why it is important, therefore, to consider the risk factors for CM and SCC separately.
With respect to housing, the use of cubicle housing (Bartlett et al., 1992; Khaitsa et al., 2000; Smith and Ely, 1997; Wenz et al., 2007) with sand beds (Bewley et al., 2001; Jayarao et al., 2004; Wenz et al., 2007) was associated with the lowest SCC, as was increased cleanliness of the calving pens (Barkema et al., 1998a; Barnouin et al., 2004).
Other variables consistently associated with a reduced SCC included the application of blanket antibiotic dry cow therapy (Barkema et al., 1998a; Erskine and Eberhart, 1991; Erskine et al., 1987; Hutton et al., 1991; Rodrigues et al., 2005; Wenz et al., 2007), the daily inspection of dry cow udders (Barkema et al., 1998a) and the application of the California Mastitis Test (Erskine et al., 1987; Rodrigues et al., 2005).
Implications of study design 1.2.3
The vast majority of our current knowledge with respect to mastitis control stems from observational studies using cross-sectional study designs. There are several potential reasons for this, including that they are relatively cheap and quick to perform and usually cover a broader range of subjects (Feinstein, 1989). However, there are significant limitations related to study design that need to be considered when appraising evidence arising from such studies such as confounding,
35
interactions and non-randomisation (Martin, 2013). Due to the systematic biases introduced by these factors and the associated propensity for the inflation of positive effects (Sacks et al., 1982), observational studies are typically used as hypothesis-generating and are considered to be a weak source of evidence for causality (Concato et al., 2000). Despite improvements in observational study design and methodology (Benson and Hartz, 2000; Concato et al., 2000), intervention or ‘experimental’ studies remain the ‘gold-standard’ for assessing the clinical effectiveness of therapeutic agents/medical interventions (Abel and Koch, 1999; Byar et al., 1976; Feinstein, 1984). However, there are relatively few intervention studies reported in the veterinary literature regarding mastitis control (Green et al., 2007b) and those that have been performed have been conducted at the cow level rather than the herd level. Some recent examples of these include blanket dry cow therapy versus selective dry cow therapy (Bradley et al., 2010), use of a mastitis vaccine (Bradley et al., 2015) and the treatment of subclinical mastitis (van den Borne et al., 2010b).
There have been several criteria proposed to assess the likelihood that the relationship between an observed risk factor and a disease is causal and these include temporality, consistency, biologic gradient and experimental evidence (Schukken et al., 1990); another simple consideration is plausibility. Plausibility simply refers to the biologic plausibility of a causal relationship given the current state of knowledge. For example, it was reported in one study that the increased cleanliness of
36
the calves was associated with a decreased risk of clinical mastitis caused by E. coli in the milking herd (Barkema et al., 1999a). It would be very difficult to arrive at a biologically plausible reason for this association to be causal but far more likely is that the cleanliness of the calves reflects some other characteristic, such as the attitude or skill of the farmer, which was not directly measured in the study, which could have a closer relationship with the incidence of clinical mastitis.
The Agriculture and Horticulture Development Board Dairy 1.2.4
Mastitis Control Plan
All of the data reported and analysed in Chapters 4, 5 and 6 of this thesis originated from UK dairy herds that had participated in the AHDB Dairy Mastitis Control Plan (DMCP). Background information and a detailed description of the DMCP process are provided below.
In 2003, the UK dairy levy board (Milk Development Council) invited tenders for a research partner to develop and test a mastitis control plan developed and based on the risk factors in the veterinary literature. This culminated in a randomised controlled clinical trial (RCT) carried out on 52 commercial dairy herds in England and Wales in 2004/2005 with the aim of determining whether a clearly defined, structured plan for mastitis control, implemented in herds with an increased incidence of clinical mastitis, would reduce the incidence of clinical and subclinical disease. Results from the RCT showed a mean reduction in the proportion of cows affected with clinical mastitis of 22% (having accounted for confounders) in intervention herds compared with the control herds, in addition to
37
reductions of around 20% in the incidence of clinical and subclinical infections (Green et al., 2007b). After some further developments, the AHDB Dairy Mastitis Control Plan (DMCP) was launched at a national level in April 2009. The DMCP was delivered by trained ‘plan users’, consisting of veterinary practitioners and dairy consultants that had participated in 2 days of training, and a level of supervision and support was provided by the group of specialist bovine veterinarians that originally devised the DMCP.
The DMCP consists of 3 main stages: i) analysis of herd data to assess patterns of mastitis and categorisation of each herd according to those patterns, ii) assessment of the current farm management and, based on deficiencies identified, prioritisation of the most important management changes required, and iii) frequent monitoring of the farm data to assess the subsequent impact on CM and SCC.
The first stage is arguably the most important (and novel) element of the DMCP, whereby SCC and CM data for each herd are interpreted using specialised analytical software and one of 4 ‘diagnoses’ assigned according to the putative origin and cause of the majority of new infections as described previously. The 4 potential diagnoses are as follows:
environmental pathogens of mainly dry period origin (‘EDP’) environmental pathogens of mainly lactation origin (‘EL’) contagious pathogens of mainly dry period origin (‘CDP’) contagious pathogens of mainly lactation origin (‘CL’)
38
The next element involves a visit to the farm during which a comprehensive questionnaire/survey is completed covering all aspects of management relevant to mastitis control (377 questions/observations). The answers to the questionnaire are inputted into a bespoke software package called the ‘ePlan’ together with the ‘diagnosis’ and management deficiencies that are relevant to the ‘diagnosis’ are highlighted. At this stage, the plan user would typically prioritise approximately 5-10 interventions to discuss further with the herd manager and agreement sought on which ones to implement in the first instance. Once the interventions have been agreed and implemented, the plan user monitors the herd data (typically at 3-monthly intervals) to ensure that the plan is kept up to date and relevant to the herd.
The key features of the DMCP approach are that it is farm-specific (unlike the 5-point plan) and utilises the farm data to help target mastitis control advice. It is also evidence-based, and has been proven to be effective in an RCT. Since the DMCP was launched at a national level in 2009, over 350 plan users have been trained to deliver it, and over 2000 UK dairy herds are estimated to have participated in the scheme.
Statistical methods used in this thesis
1.3
Economic evaluation is increasingly used to inform decisions about which healthcare interventions to fund from available resources (Briggs and Gray, 1999). There is a need for analytic methods used for economic evaluation to compare new technologies with the full range of alternative options and reflect uncertainty in evidence in the conclusions of the
39
analysis (Smith et al., 2004), all of which can be achieved with decision analytic modelling.
Decision analysis, defined as a systematic approach to decision making under uncertainty (Raiffa, 1968), has been widely established in the human healthcare sector (Hunink et al., 2014; Sox et al., 1988). A decision analytic model uses mathematical relationships to define a series of possible consequences, and the likelihood of each consequence is expressed as a probability with an associated cost and outcome (Briggs and Gray, 1999). An important feature of decision modelling is to acknowledge and incorporate the inevitable uncertainty surrounding decisions. For example, apparently very similar herds will respond differently to a specific mastitis intervention and, therefore, the likelihood of a particular response can be expressed as a probability distribution in the model. The process of populating a decision model usually involves some form of evidence synthesis, whereby evidence is compiled from multiple different sources, and there are many different approaches to this (Spiegelhalter et al., 2004). Statisticians are increasingly using Bayesian methods for evidence synthesis in decision models for economic evaluation (Ades et al., 2006b) a key feature of which is the requirement for parameters to be specified as probability distributions (Felli and Hazen, 1999).
Bayesian approach 1.3.1
A Bayesian approach has been defined as ‘the explicit quantitative use of external evidence in the design, monitoring, analysis, interpretation and
40
reporting of a health-care evaluation’ (Spiegelhalter et al., 2004). At its most fundamental level, it deals with how our pre-existing opinion about the likely effect of a specific mastitis intervention, for example (known as the prior distribution), is altered, having observed some new data (likelihood) to arrive at a final opinion about the effect of the mastitis intervention (known as the posterior distribution). The mathematical method proposed for this is known as Bayes’ theorem, after the Reverend Thomas Bayes, an 18th Century minister who first described the theorem
which essentially weights the likelihood from the new data with the relative plausibilities defined by the prior distribution (Spiegelhalter et al., 2004).
From a decision maker’s perspective, a Bayesian approach allows the combining of information from diverse sources, can encompass expert judgement, addresses quantitatively all relevant sources of uncertainty, and incorporates new information as it accrues sequentially, therefore maximising the efficiency with which new knowledge is translated into clinical practice (Parmigiani, 2002). Many clinical research questions can most naturally be answered by assessing the probability that a particular hypothesis is true or false, having observed a relevant set of data (Gurrin et al., 2000) (e.g. the probability that a specific mastitis intervention would result in a net saving of £1000 after 12 months). Unfortunately, questions such as these cannot be readily answered within the conventionally applied ‘frequentist’ framework. Statistical inference within the frequentist framework is based upon p values that reflect the
41
probability of obtaining a particular pattern of results in a repeated series of identical hypothetical experiments, on the basis of a hypothesis that is assumed to be true (Burton et al., 1998; Gurrin et al., 2000). To establish the probability that a hypothesis is true given a set of data, one first needs to consider how plausible the hypothesis was in the first place (Nuzzo, 2014; O’Hagan, 2003) and, therefore, the weight of evidence required to support it. The updating of our ‘prior’ or existing knowledge is a key component of Bayesian inference, and one of the key advantages of the Bayesian approach is that the resulting posterior distribution can be used to provide clinically relevant and direct answers to all kinds of questions, including the probability that a particular hypothesis is correct (O’Hagan, 2003). It also removes the reliance upon significance testing and the use of arbitrary thresholds of ‘significance’ (Greenland and Poole, 2013; Gurrin et al., 2000), meaning the clinician is able to make their own judgement as to what is clinically ‘significant’ according to the degree of uncertainty they are comfortable with.
There are numerous Bayesian approaches to economic decision modelling (Spiegelhalter et al., 2004), and the two simulation-based approaches used in this thesis are: (i) probabilistic sensitivity analysis, using Monte Carlo methods and (ii) a related integrated approach using Markov chain Monte Carlo methods (MCMC) and micro-simulation.
Probabilistic sensitivity analysis 1.3.2
A technique now widely adopted by the human healthcare sector for analysis of the cost-effectiveness of new and existing treatments is
42
probabilistic sensitivity analysis (PSA) (Briggs et al., 2002; Brown et al., 2006). Indeed, the National Institute for Clinical Excellence (NICE) now requires all cost-effectiveness analyses submitted to the institute to utilise PSA (Claxton et al., 2005). Whilst this form of analysis has widespread acceptance within the human healthcare sector, there are relatively few examples of its use in the veterinary literature (Detilleux, 2004; Hudson et al., 2015, 2014).
The main feature of PSA is that all input parameters are specified as full probability distributions (probabilistic), rather than point estimates (deterministic), to represent the uncertainty surrounding their values. This parameter uncertainty can then be propagated through the cost-effectiveness model so that imprecision in model outputs is transparent (Briggs et al., 2002). For example, rather than using a point estimate for the probability of clinical cure after the treatment of CM of, say, 60%, we might choose a probability distribution covering the range 40-80% instead, accepting that we don’t know the precise figure but being fairly confident that it lies somewhere within this range. Then, at each iteration of the model, a different value is taken from the specified range and used as the basis for the cost-effectiveness calculations. By repeating this process thousands of times, many different scenarios can be explored. The relative importance of different model parameter values on the outcome of interest can then be evaluated irrespective of model complexity.
43
The process of randomly drawing values from within a specified probability distribution is commonly known as Monte Carlo simulation (Metropolis, 1987) and was first utilised as a research tool for the development of nuclear weapons during the second world war. Monte Carlo methods have been used across many areas of science and business with the primary purpose of evaluating integrals or sums by simulation rather than exact or approximate algebraic analysis (Spiegelhalter, 2004). PSA has become a popular modern method for determining the uncertainty in the outcomes of cost-effectiveness studies because of the uncertainty in input parameters (Boshuizen and van Baal, 2009). There have been concerns that the use of deterministic or univariate sensitivity analysis may underestimate overall uncertainty (Briggs, 2000) and become difficult to interpret with large numbers of parameters, especially if any are correlated (Claxton et al., 2005). Such concerns have led to the development of PSA based on Monte Carlo simulation methods (O’Brien et al., 1994), as PSA permits the analyst to examine the effect of joint uncertainty in the variables of an analysis without resorting to the wide range of results generated by extreme scenario analysis (Briggs and Gray, 1999). Parameter correlation is propagated automatically, providing meaningful sensitivity analysis regardless of parameter correlation (Ades et al., 2006a).
Given that the literature is often quite sparse concerning many of the model inputs required, assumptions are usually necessary for this kind of model and this can result in unreliable conclusions being drawn if this
44
uncertainty is not properly investigated. By using PSA, we can reflect the level of uncertainty by defining the parameters as distributions that are transparent. The distributions used do require a degree of judgement and this has to be carried out in an open and transparent way and based on current literature wherever possible.
Integrated approach and micro-simulation 1.3.3
The traditional approach to cost-effectiveness analysis involves a two-stage process whereby parameter estimates and intervals are first obtained based on subjective judgements, data analysis or a combination of the two and, secondly, distributions for the parameter estimates are then assumed and inputted into a separate model to evaluate the cost-effectiveness. An alternative approach is the integrated or unified approach which is a fully Bayesian analysis that simultaneously carries out the evidence synthesis and cost-effectiveness analysis. The integrated approach requires all of the available evidence to be specified as prior distributions which are then revised by Bayes theorem using MCMC simulation to derive posterior distributions. The effects of the resulting posterior distributions are simultaneously propagated through the cost-effectiveness model which is then used to make predictions.
There are many examples of this integrated approach in the human medical literature (Bravo Vergel et al., 2007; Cooper et al., 2004, 2003; Gillies et al., 2008; O’Hagan and Stevens, 2001; Welton et al., 2008) but examples in the veterinary literature are relatively sparse (Archer et al., 2014a, 2014b, 2013a, 2013b; Green et al., 2010).
45
The key features of the integrated approach are: (i) it provides a systematic framework for relating uncertainty about model input parameters to uncertainty in the computational results of the cost-effectiveness model; (ii) it makes full allowance for any inter-relationships between model input parameters; and (iii) it removes the need to make parametric distributional assumptions and facilitates sensitivity analyses (Cooper et al., 2004).
A common problem when trying to base clinical decisions on the results of cost-effectiveness models is that it is often difficult to interpret all of the model outcomes and apply them to the decisions that need to be made (e.g. if a herd level interpretation is required from a cow-level model). For this reason, it is often helpful to perform a ‘follow-on’ simulation involving the trajectories of individual cows/herds which can then be used as an estimate of the expected outcome in a population of cows/herds. This is known as micro-simulation, and, by using this tool, it is possible to replicate carefully controlled clinical trials varying only the exposure of interest, which would often otherwise be very expensive to perform and could give rise to ethical concerns.
Markov Chain Monte Carlo for parameter estimation 1.3.4
MCMC was invented shortly after Monte Carlo methods following a study simulating a liquid in equilibrium with its gas phase (Metropolis et al., 1953). The resulting ‘Metropolis algorithm’ was generalised by Hastings to become the ‘Metropolis-Hastings algorithm’ (Hastings, 1970), a special
46
case of which became known as the Gibbs sampler (Geman and Geman, 1984) which is widely used today and was used in this thesis.
MCMC is an effective means of sampling from the posterior distribution despite the precise form of the posterior distribution being unknown. A Markov chain is created by continually updating parameter estimates until a stable state is reached, known as convergence. Each parameter estimate in the chain depends only on the previous estimate, so the chain gradually becomes independent of past values, including initial conditions. Any inferences required are derived from the sampled values which together form an approximation of the posterior distribution of interest.
A Markov Chain should converge to a stationary or non-variant state and the sampling process up to convergence is usually termed ‘burn in’. Determining if a chain has converged can be difficult (Gilks et al., 1995) but methods used in this thesis included the visual assessment of chain stability and the Brooks-Gelman-Rubin convergence diagnostic (Brooks and Gelman, 1998; Gelman and Rubin, 1992). Following convergence, Markov Chains are typically continued for thousands of iterations to estimate parameters, after which, the initial ‘burn-in’ iterations are discarded and parameter estimates at each iteration used for onward prediction and simulation.
47
Aims of the thesis
1.4
Summary 1.4.1
The overall aim of the thesis was to explore the cost of clinical mastitis and cost-effectiveness of different approaches to mastitis treatment and specific mastitis control interventions using probabilistic methods that incorporated uncertainty. The results of the decision analytic models should facilitate decision making by enabling direct statements of probability to be inferred about specific clinical hypotheses. Bayesian approaches were used throughout the thesis to capture and propagate sources of uncertainty that were identifiable.
Overview of Chapters 1.4.2
Transmission and the cost of clinical mastitis (Chapter 2)
The aim of Chapter 2 was to use probabilistic sensitivity analysis to evaluate the relative importance of different components of a model designed to estimate the cost of clinical mastitis. A particular focus was placed on the importance of pathogen transmission relative to other factors, such as milk price or treatment costs.
The cost-effectiveness of an on-farm culture approach compared with a standard approach for the treatment of clinical mastitis in dairy cows (Chapter 3)
In Chapter 3, an adaptation of the PSA model developed in Chapter 2 was used to explore factors affecting the cost-effectiveness of an on-farm culture approach versus a standard approach for the treatment of clinical mastitis. The main aim of this study was to help veterinary decision