CPS Data Streams Analytics based on
Machine Learning for Cloud and Fog
Computing: A Survey
Xiang Feia, Nazaraf Shaha, Nandor Verbaa, Kuo-Ming Chaoa, Victor Sanchez-Anguixa, Jacek
Lewandowskia, Anne Jamesb, Zahid Usmana
[email protected], [email protected], [email protected], [email protected], [email protected], [email protected], [email protected], [email protected],
aFaculty of Engineering, Environment and Computing,
Coventry University, Coventry, United Kingdom
bCollege of Science and Technology, School of Science & Technology
Nottingham Trent University, Nottingham, United Kingdom
Abstract
Cloud and Fog computing has emerged as a promising paradigm for the Internet of things (IoT) and cyber-physical systems (CPS). One characteristic of CPS is the reciprocal feedback loops between physical processes and cyber elements (computation, software and networking), which implies that data stream analytics is one of the core components of CPS. The reasons for this are: (i) it extracts the insights and the knowledge from the data streams generated by various sensors and other monitoring components embedded in the physical systems; (ii) it supports informed decision making; (iii) it enables feedback from the physical processes to the cyber counterparts; (iv) it eventually facilitates the integration of cyber and physical systems. There have been many successful applications of data streams analytics, powered by machine learning techniques, to CPS systems. Thus, it is necessary to have a survey on the particularities of the application of machine learning techniques to the CPS domain. In particular, we explore how machine learning methods should be deployed and integrated in cloud and fog architectures for better fulfilment of the requirements, e.g. mission criticality and time criticality, arising in CPS domains. To the best of our knowledge, this paper is the first to systematically study machine learning techniques for CPS data stream analytics from various perspectives, especially from a perspective that leads to the discussion and guidance of how the CPS machine learning methods should be deployed in a cloud and fog architecture.
Keywords: Cyber-physical systems (CPS), Machine learning, Cloud computing, Fog computing, Edge computing, Analytics
I.
Introduction and Motivation
1.
Cyber
physical
systems:
Definitions and characteristics
Recent advances in computing, communication and sensing technologies have given rise to Cyber-Physical Systems (CPS), not only one of the most prominent ICT technologies that pervade various sectors of the physical world, but also an integral part of everyday life [1][2][3][4]. The
term cyber-physical systems (CPS) was coined in the US in 2006 [5], with the realisation of the increasing importance of the interactions between interconnected computing systems [6]. There have been various definitions of CPS, each of them throwing some light at some of the relevant factors that revolve around CPS systems. Next, we will discuss some of the most relevant in order to provide the readers with an educated vision on what cyber-physical systems are:
The National Science Foundation [7] defines CPS as “Cyber-physical systems (CPS) are engineered systems that are built from, and depend upon, the seamless integration of computational algorithms and physical components. Advances in CPS will enable capability, adaptability, scalability, resiliency, safety, security, and usability that will far exceed the simple embedded systems of today. CPS technology will transform the way people interact with engineered systems -- just as the Internet has transformed the way people interact with information. New smart CPS will drive innovation and competition in sectors such as agriculture, energy,
transportation, building design and
automation, healthcare, and manufacturing.”
Lee [1] defines CPS as “A cyber-physical system (CPS) is an orchestration of computers and physical systems. Embedded computers monitor and control physical processes, usually with feedback loops, where physical processes affect computations and vice versa.”
The National Institute of Standards and Technology [4] defines the subject of CPS as “Systems that integrate the cyber world with the physical world are often referred to as
cyber-physical systems (CPS). The
computational and physical components of such systems are tightly interconnected and coordinated to work effectively together, sometimes with humans in the loop”
Despite their differences in length, detail and the semantics of some terms, there are some common characteristics that can be extracted from these definitions. More specifically, we argue that cyber-physical systems have the following inherent characteristics:
Integration of cyber elements (computation, software and networking), engineered
elements (physical processes)
[1][7][8][9][10][11], and human factors [4]
Reciprocal feedback loops between physical processes and computations, (simulation and
decision making), sensing and actuation elements, and monitoring and control elements [4][1][8][9][12]
It also encompasses a new generation of embedded control systems (i.e. networked embedded systems) consisting of networked CPS components and tightly coupled and interconnected cyber-physical processes that require of cooperation and coordination. [2][4][13]
In addition to this, the National Institute of Standards and Technology also highlights the fact that CPS require of the integration and cooperation of two technologies for the successful deployment of these systems [4]. Firstly learning and predictive capabilities are necessary to provide the integration of physical and digital models and, more importantly, provide the ability for the digital world to change its autonomous logic based on the state of the physical world (e.g., diagnostics and prognostics). Secondly, it is stated that CPS require of open architectures and standards that provide for modularity and composability of systems, thus allowing complex and dynamic applications. Particularly, CPS is an interconnected twin cybernetics digital system (virtual and physical worlds). The desired predictive capabilities in CPS are the ones that require these systems to potentially collect and analyse data from the physical and digital world. In the end, the predictive capability informs decision makers to take appropriate actions or control to change the course of physical world.
Finally it should be highlighted that current applications of CPS include automotive systems, manufacturing, medical devices, military systems, assisted living, traffic control and safety, process control, power generation and distribution, energy conservation, HVAC (heating, ventilation and air conditioning), aircraft, instrumentation, water management systems, trains, physical security (access control and monitoring), asset
management and distributed robotics (telepresence, telemedicine) [1].
2.
Data Stream Analytics in CPS
Mining data streams, acquired from various sensors and other monitoring components embedded in the physical systems, plays an essentially role in CPS, as it extracts the insights and the knowledge from the data streams, provides learning and predictive capabilities for decision support and autonomous behaviour, enables the feedback from the physical processes to the cyber counterparts, and eventually facilitates the integration of cyber and physical systems [14].
Silva et al. [15] provides a formal definition of a data stream as:
A data stream S is a massive sequence of data objects 𝑋1, 𝑋2…, 𝑋𝑁, i.e., 𝑆 = {𝑋𝑖}
𝑖=1
𝑁 , which is potentially unbounded
(𝑁 → ∞). Each data object is described by an n-dimensional attribute vector 𝑋𝑖 = [𝑥
𝑗𝑖]𝑗=1𝑛 belonging to an attribute
space that can be continuous, categorical, or mixed.
Data streams feature massive, potentially unbounded sequences of data objects that are continuously generated at rapid rates [15], which leads to the fundamental shift in the data analytics (information source) from traditional a priori information alone based or off-line batch approaches, to stream analytics. The key challenge in stream analytics is the extraction of valuable knowledge in real time from a massive, continuous and dynamic data stream in only a single scan [16]. The reader should additionally consider that the insights extracted from physical devices, such as sensors, feature perishable insights, i.e., they have to be provided quickly, as otherwise they lose value to feed the logic of the CPS software. In a CPS, data streams are most beneficial at the time they are produced, as any change reported by the data (e.g. a sensor anomaly, a fault in the physical process being
sensed, or a change of system state) should be detected as soon as possible, and be acted upon, for example, via a change in control policy or an output action. Furthermore, as opposed to stream analytics for purely software systems, the insights being revealed by data streams in CPS are often tied to a safety-critical action that must be performed to ensure the health of the CPS itself [14].
Analysis of these ever-growing data streams becomes a challenging task with traditional analytical tools. Innovative and effective analytic techniques and technologies are required to operate, continuously and in real-time, on the data streams and other sources data [17]. Machine learning is a discipline that aims to enable computers to, without being explicitly programmed, automate data-driven model building and hidden insights discovery, i.e., to automate behaviour or the logic for the resolution of a particular problem, via iterative learning from example data or past experience [18][19][20]. In the past, there have existed many successful applications of machine learning, including systems that analyse past sales data to predict customer behaviour, optimize robot behaviour so that a task can be completed using minimum resources, and extract knowledge from bioinformatics data[20]. In this particular survey, we will focus on
3.
Cloud and Fog Computing
The interconnection of sensor and actuator systems with decision making and analytics have traditionally been performed by either local static controllers or uploaded to the Cloud for analysis. Supported by the paradigms of Internet of Things (IoT), Cloud computing experts propose the virtualization of devices to provide their data-based capabilities and their connection as a service for users within a Sensing and Actuation as a Service (SAaaS) [21] or as Things as a Service (TaaS) [22]. Another role that Cloud computing has played in supporting CPS is focused on the analysis of the data received from devices. The
Cloud can provide a vast amount of processing and storage resources which can be used to analyse large amounts of data [23] or streams [24]. These cloud capabilities are focused in centralized and remote datacenters, which has several drawbacks. The security aspect of storing, analysing and managing data in the Cloud is an increasing concern [25], while the remote nature of the Cloud also has reliability and latency issues [26].
The paradigm of Fog computing as proposed by [27] extends the Cloud to the edge of the network to better utilize resources available on gateways and connected devices. This extension allows data to be stored and processed locally to increase reliability and security, while decreasing the latencies between devices and the processing elements [28]. Fog computing systems are typically characterized by a large number of heterogeneous nodes, increased mobility and a strong presence of streaming and real-time applications [27]. The hosts or gateways used in fog systems vary from PC based Computing Nodes [29], Mobile Devices [30] and resource constrained System on Chip Devices (SoC) [31], routers, switches, set top boxes, proxy servers and base stations [32]. These hosts all have varying storage, processing and networking capabilities. While computing nodes have the most resources and are most reliable, they usually communicate with devices using Ethernet or Wi-Fi based networks. The mobile devices and SoC based devices have fewer resources but provide a
wider range of wireless communication
possibilities for polyglot gateways [33], that can be used to connect to a wider range of heterogeneous devices using low-power Machine to Machine (M2M) communication protocols. These distinguishing properties of the Fog are essential for providing elastic resources and services to end users at the edge of networks [28]. Fog computing is rapidly finding its way into CPS and IoT.
Adopting IoT paradigms into CPS can provide several types of services, such as weather monitoring, smart grid, sensor and actuator network in manufacturing environment, smart building control and intelligent transport. These services produce a large amount of data that need to be processed for the extraction of knowledge and system control [34].
The platforms deployed in Fog computing vary based on hosts and application domains, but they can be categorized in a similar way as in Cloud computing. Infrastructure based platforms allow users to deploy Virtual Machines (VM’s) [35] or lightweight virtualization images [36]. Platform based solutions as in [37] provide a platform for users for application style system deployments. The third type of the platforms provides networking and analytics capabilities that the user can only configure and use without the need to program and deploy their own applications.
From the hosts’ perspective there are a number of differences between the Cloud and the Fog. The main difference is the resources of these hosts, while the Cloud is considered to have a virtually unlimited amount of storage and processing capabilities, in the Fog these resources are a lot more restricted so their optimal management is crucial. When we look at inter-host communication in the Cloud, due to high speed networks these delays are uniform and negligible. In the Fog, due to wireless communication and varying network types these delays can vary largely between hosts and their value also increases dramatically. When we look at device to host communication the Fog is closer to these devices while the Cloud adds significant networking delays when accessing remote devices. When we look at the differences from a platform’s perspective we can see that Cloud solutions offer full control of resources using VM’s, Docker style solutions or other Platform as a Service (PaaS) options while Fog solutions tend to share more interdependent and constraint resources between users. Cloud computing has
well established business model as compared to relatively new concept of Fog computing. However, this fact has been recognised by researchers and efforts can be seen in literature resolving billing, accounting, monitoring and pricing for a Fog business model [38].
CPS requires large computational capabilities to process, analyse, and simulate the collected data from sensors to make decisions and to instruct controllers, in a limited time, to operate the physical devices. The volume and velocity of sensor and visualization data in CPS require large storages to accommodate and software applications to process them. The division of the labour of latency tolerant and deep analytics tasks between Fog and Cloud depends upon processing power of the edge nodes and application’s domain. The edge nodes with limited computational power may only focus on performance of latency sensitive tasks. On the other hand, machine learning algorithms that require intensive computing resources should be executed in the Cloud. The cloud service model with elastic and flexible architecture presents an appropriate solution to support the emerging CPS. However, the study on how data and applications should be distributed between edge devices and the cloud has derived little attention from the academic and industry research communities. This obviously includes the decision on where machine learning methods for stream analytics should be executed: the edge or the cloud. The existing machine learning methods with different processing properties have their own strengths and weakness, so several methods or their variants have been proposed to address diverse requirements from different applications. Some methods, for example, may cope better than others in incomplete data sets or large data sets, while some may require more computational power than others.
Given the emerging and promising Cloud and Fog computing architecture and the foreseeable integration of CPS, more specifically the machine
learning based data analytics in CPS, to such an architecture, it is necessary to investigate what machine learning techniques have been employed in the context of CPS, and further, how they should be adapted and deployed in the cloud-fog-edge architecture for better fulfilment of the requirements of the application, such as mission criticality and time criticality. This research aims to identify and analyse the properties of current well-known machine learning methods employed in the context of CPS and the characteristics of stream data in CPS to provide a comprehensive study on their relation. This will help determine how to map data and machine learning methods to the Cloud and Edge computing to meet the CPS requirements. More specifically, we will focus on the analysis of the machine learning models employed in stream analytics from the perspective of the time complexity. This measure will provide important indications to the appropriateness of Edge computing to host tasks, as it has limited computational powers, RAM and storage whereas the cloud has more flexibilities, capacities and capabilities to deal with resource-intensive tasks on demand. The required qualities for the outputs and the types of results (e.g. precision and accurate rates) have significant influence on the resources and response time of the selected methods, so the correlation among them should be investigated.
To the best of our knowledge, this paper is the first to systematically study the machine learning based data stream analysis in CPS and how they should be deployed in the emerging cloud-fog-edge architecture.
The remainder of the paper is organized as follows. We present the related work in section 2. In section 3, the machine learning methods are reviewed from the perspective of the functions they provided for the typical CPS applications. Then, the time complexities of general machine learning techniques are provided in section 4, based on which discussions on how these
machine learning methods should be deployed are given for the purpose of effective and efficient integration to the Cloud and Fog computing architecture. We conclude the paper with some future research directions.
II.
Related work
Traditional CPSs may have limited computation and storage capabilities due to the tiny size of the devices embedded into the systems. Chaâri et al. [2] investigated the integration of CPSs into the cloud computing, and presented an overview of research efforts on the integration of cyber-physical systems with cloud computing in three areas: (1) remote brain, (2) big data manipulation, (3) and virtualization. More specifically, real-time processing, enabled by offloading computation and big data processing on the cloud systems were explored. Nevertheless, Chaâri et al. [2] did not include an exhaustive analysis of the emerging fog and edge computing technologies, and how these technologies should cooperate with CPS.
The authors in [16] and [15] presented a survey on data stream analytics from the perspective of clustering algorithms. Apart of summarizing the unique characteristics of data stream processing by comparison with traditional data processing, in [16], data stream clustering algorithms were categorized into five methods (i.e., hierarchical methods, partitioning methods, grid-based methods, density-based methods, and model-based methods). Similarity, [15] analysed 13 most relevant clustering algorithms employed in the context of data stream analytics. In addition to the categories listed in [15], the authors in [16] identified three commonly-studied window models in data streams, i.e., sliding windows, damped windows, and landmark windows. Differently to [15] and [16], we do not solely focus on clustering algorithms, but we also extend analytics to other types of machine learning algorithms.
In [20], the authors studied machine learning techniques employed in transportation systems, and identified various conventional machine learning methods such as regression (linear
regression, polynomial regression and
multivariate regression), decision tree, artificial neural networks (ANNs), support vector machines (SVMs) and clustering. Despite the useful insights provided by the work, the analysis is exclusively carried out in the light of a very particular type of CPS application; and further, no advanced machine learning methods, e.g. deep learning methods, was introduced.
The survey provided in [39] recognized the changes that were needed to move from a conventional technology-driven transport system into a more powerful multifunctional data-driven intelligent transportation system (D2ITS), i.e. a system that employed machine learning and other intelligent methods to optimize its performance to provide a more privacy-aware and people-centric intelligent system. The paper identified both the data sources that drove intelligent transport systems (ITS), (e.g. GPS, Laser radar, seismic sensor, ultrasonic sensor, meteorological sensor, etc.), and the learning mechanisms for real-time traffic control and transportation system analysis, such as online learning (e.g., state-space neural network, real-time Kalman filter, combination of online nearest neighbour and fuzzy inference, hidden Markov model, etc.), adaptive dynamic programming (ADP), reinforcement learning (RL) and ITS-Oriented Learning. The article offers a thorough and sound view on transport systems, but the insights are not extrapolated to other CPS domains and applications.
The authors in [40] presented an analysis on a number of existing data mining and predictive machine learning methods for big data analytics with the goal of optimising the dynamic electrical market and consumers' expectations in the smart grid. Similarity, authors in [41] review the benefits and gaps of the combination of artificial neural
networks, genetic algorithms, support vector machines and fuzzy logic for the forecasting of power grid. Another similar review is carried out in [42] to analyse the big data methods used to manage the smart grid. The authors identified different predictive tasks that can be carried out in the smart grid domain such as power generation management, power forecasting, load forecasting, operation and control fault diagnosis, and so forth. The authors mapped to the corresponding statistical or machine learning methods with the required data inputs or sources.
III.
Machine Learning Methods
in CPS Applications
1.
Typical CPS Applications
Smart Grid:
Smart grid is a complex system ranging from micro grid to national or international networks involving different levels of facilities, managements and technologies. A smart grid is considered as a cyber physical system as it monitors and manages the power generation, loading, and consumptions through a number of sensors. These sensors gather the stream data that is fed to analytic methods and control systems to balance and distribute power generation and consumption [43].
Due to complexity and dynamics of power market, and the nature volatile nature of renewable energy, it is important to have a good forecasting and prediction on the market trend and energy production to correctly estimate the amount of power to generate. In addition to this purpose, applications of analytics to the smart grid also include fault detection in infrastructure, devices, system and application levels [10]. Machine learning is a promising tool to analyse the data stream and convert them to informed decisions and actions.
Intelligent Transportation Systems (ITS)
An intelligent transportation system (ITS) is an advanced application which aims to provide
innovative services relating to transport and traffic management, and enable users to be better informed and make safer, more coordinated, and smarter use of transport networks. ITS brings significant improvement in transportation system performance, including reduced congestion and increased safety and traveller convenience [44][45][46].
ITS is a typical CPS as it meets the core characteristics of CPS. Enabled by Information and Communication Technologies (ICT), elements within the transportation system - vehicles, roads, traffic lights, message signs, etc. - are becoming intelligent by embedding microchips and sensors in them. In return, this allows communications with other agents of the transportation network, and the application of advanced data analysis and recognition techniques (e.g., machine learning techniques) to the data acquired from embedded sensors such as inductive-loop detectors, Global Positioning System (GPS)-based receivers, microwave detectors, and so forth. As a result, intelligent transportation systems empower actors in the transportation system—from commuters, to highway and transit network operators, to the actual devices, such as traffic lights, themselves—with actionable information (that is, intelligence) to make better-informed decisions, e.g. whether it’s choosing which route to take; when to travel; whether to mode-shift (take mass transit instead of driving); how to optimize traffic signals; where to build new roadways; or how to hold providers of transportation services accountable for results [39][46].
Smart Manufacturing/Industrial 4.0:
Manufacturing applications, such as object detection, force and torque sensor based assembly operations, require accuracy of object detection, pose estimation and assembly to within few micrometres. Moreover, this accuracy has to pass the test of time and repeatability (i.e., the results should be precise).
Manufacturing in general and automotive manufacturing in particular, requires operation involving handling, inspection or assembly to be completed in few seconds. For example, BMWs mini plant in Oxford has a car coming of production line every 68 seconds [47]. Applications, such as welding, require real time data processing, analysis and results. For example, to track the position of joining plates on real time basis and adjust the movement of weld guns on real time basis for precise and accurate welding at high speed [48].
2.
Machine Learning in a Nutshell
Machine learning is the discipline that aims to make computers and software learn how to program itself and improve with experience/data, with the goal of solving particular problems [49]. Typically, a machine learning algorithm is a specific recipe that tells a computer/software how to improve itself from experience. A model is the result of training a machine learning algorithm with a set of data or experiences of a given problem, and it can be employed to solve future related problems.
The problems faced by machine learning algorithms fall into one of the following categories attending to the nature of the data that is employed to improve the learning: supervised learning, unsupervised learning, and reinforcement learning. Next, we briefly discuss each of these categories and describe some of the most relevant techniques for each category:
In supervised learning, the aim is learning a mapping from an input to an expected output that is provided by a supervisor or oracle (i.e., labelled data) [18]. Depending on the type of output, we say that we either have a classification or a regression problem. In the first case, we aim to produce a discrete and finite number of possible outputs, while in the second case the range of possible outputs are infinite and numeric [18].
In unsupervised learning, there is no such supervisor and only the input data is present. The aim of these algorithms is finding regularities in the input [18][20].
Finally, reinforcement learning applies to the cases where the learner is a decision-making agent that takes actions in an environment and receives reward (or penalty) for its actions in trying to solve a problem. Thus, the learning process is guided by a series of feedback/reward cycles [20]. Here, the learning algorithm is not based on given examples of optimal outputs, in contrast to supervised learning, but instead it must discover them by a process of trial and error [50]
Next, we describe some of the most usual machine learning algorithms employed in the context of CPS data stream analytics.
Decision Trees and random forests:
A decision tree is a supervised machine learning algorithm that is organized in a tree-like hierarchical structure composed by decision nodes and leaves. Leaves represent expected outputs, and decision nodes branch the path to one of the expected outputs according to the value of a specific input attribute. Decision tree algorithms exist in the form of classification and regression algorithms [18]. One of the main advantages of decision trees is that the model is human readable and understandable.
A random forest is an ensemble of random trees constructed by means of bagging. By this process, a training dataset of N samples is divided into k different datasets of N’ samples uniformly sampled with replacement from the original dataset, and consisting of a random selection of the input attributes. Then, each dataset is employed to train a different decision tree, guided by the heuristic that the combination of the resulting models should be more robust to overfitting. Each tree provides an output that can be aggregated by a wide variety of rules [51][52]. Artificial Neural Networks (ANNs) and variants:
ANNs are machine learning algorithms that resemble the architecture of the nervous system, organized as interconnected networks of neurons organized in layers. These versatile algorithms are typically employed for supervised, unsupervised, and reinforcement learning. The inputs of the network (input layer) are transformed by weighted (non) linear combinations that generate values that can be further transformed in other layers of the network until they reach the output layer. Due to their ability to represent potentially complex relationship between the inputs and the expected output, ANNs, such as the multilayer perceptron (MLP), have gained popularity in machine learning and data analytics realm. The multilayer perceptron is a nonparametric estimator that can be used for both classification and regression.
Convolutional Neural Networks (CNNs) exploit translational invariance within their structures by extracting features through receptive fields and learning by weight sharing. CNNs usually include two parts. The first part is a feature extractor,
which learns features from raw data
automatically and is composed of multiple similar stages and layers. The second part is a trainable fully-connected MLP or other classifiers such as SVM, which performs classification based on the learned features from the previous part [53][54]. Recurrent Neural Networks (RNNs) are a family of neural networks that has gained popularity in the last few years [55], and they are of special relevance to stream analytics due to this characteristic. In addition to this, the surge of data and computing power present in the last decade have given rise to deep neural networks [56] that stack multiple non-linear layers of neurons to represent more complex relationships between inputs and outputs or more efficient representations of the inputs. For various closely related definitions of deep learning, please refer to [56].
Support Vector Machines (SVMs):
Support vector machines (SVMs) are supervised learning methods that classify data patterns by identifying a boundary or hyperplane with maximum margin between data points of each class/category [20][51]. The support vector machine is fundamentally a two-class classifier, although multiclass classifiers can be built up by combining multiple two-class SVMs. Despite the fact that they were initially devised for classification tasks, SVMs have been further extended to regression problems [57].
Bayesian networks and variants
Bayesian networks are probabilistic graphical models based on directed acyclic graphs where the nodes are random variables and the direct arcs indicate the direct influences, specified by the conditional probability, between two random variables [18][58].
Some popular machine learning algorithms such as Naïve Bayes, a popular supervised classifier, and Hidden Markov models (HMMs) can be considered as special cases of Bayesian networks. The second specializes at processing sequences of outputs by learning implicit states that generate outputs [18] [50]. This paradigm has been used for both supervised and unsupervised tasks. Evolutionary computation:
Evolutionary Computing is the collective name for a range of problem-solving techniques based on the principles of biological evolution, such as natural selection and genetic inheritance. The
fundamental metaphor of evolutionary
computing relates this powerful natural evolution to a particular style of problem solving – that is a pseudo trial-and-error guided by the value of a given fitness function that measures the goodness of the evolved individual/solution [59]. Evolutionary computing techniques mostly involve metaheuristic optimization algorithms, such as genetic algorithms and swarm intelligence. Genetic algorithms have been employed in
supervised[60], unsupervised [61], and
reinforcement learning problems[62]. Clustering:
Clustering is an unsupervised family of algorithms that involve processing data and partitioning the samples into subsets known as clusters. The aim of this process is to classify similar objects into the same cluster while keeping dissimilar objects in different clusters [16]. The separation criteria may include (among others) maximization of similarities inside clusters, minimization of similarities between different clusters, and minimization of the distance between cluster elements and cluster centres. One of the most popular clustering algorithms is called k-means clustering where k denotes the number of clusters.
Self-organizing map (SOM):
SOM is an automatic data-analysis method widely applied to clustering problems. SOM represents a distribution of input data items using a finite set of models. These models are automatically associated with the nodes of a regular grid in an
orderly fashion such that more similar models become automatically associated with nodes that are adjacent in the grid, whereas less similar models are situated farther away from each other in the grid. This organization, a kind of similarity diagram of the models, makes it possible to obtain an insight into the topographic relationships of data, especially of high-dimensional data items [63].
Q-learning:
Q-learning is a kind of reinforcement learning
technique that is a simple way for agents to learn how to act optimally in controlled Markovian domains. It amounts to an incremental method for dynamic programming which imposes limited computational demands. It works by successively improving its evaluations of the quality of particular actions at particular states [64].
3.
Machine Learning Methods in CPS
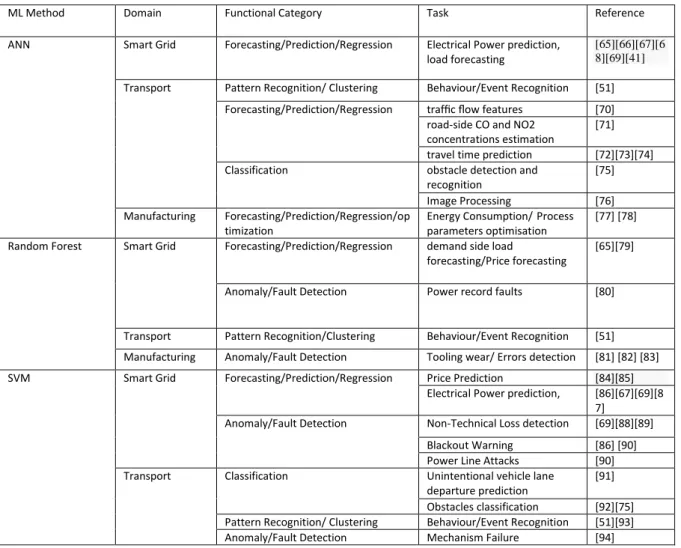
Table 1: Overview of machine learning methods in the context of CPS
ML Method Domain Functional Category Task Reference
ANN Smart Grid Forecasting/Prediction/Regression Electrical Power prediction, load forecasting
[65][66][67][6 8][69][41]
Transport Pattern Recognition/ Clustering Behaviour/Event Recognition [51] Forecasting/Prediction/Regression traffic flow features [70]
road-side CO and NO2 concentrations estimation
[71] travel time prediction [72][73][74] Classification obstacle detection and
recognition
[75] Image Processing [76] Manufacturing Forecasting/Prediction/Regression/op
timization
Energy Consumption/Process parameters optimisation
[77] [78] Random Forest Smart Grid Forecasting/Prediction/Regression demand side load
forecasting/Price forecasting
[65][79]
Anomaly/Fault Detection Power record faults [80]
Transport Pattern Recognition/Clustering Behaviour/Event Recognition [51] Manufacturing Anomaly/Fault Detection Tooling wear/ Errors detection [81] [82] [83] SVM Smart Grid Forecasting/Prediction/Regression Price Prediction [84][85]
Electrical Power prediction, [86][67][69][8 7]
Anomaly/Fault Detection Non-Technical Loss detection [69][88][89] Blackout Warning [86] [90] Power Line Attacks [90] Transport Classification Unintentional vehicle lane
departure prediction
[91] Obstacles classification [92][75] Pattern Recognition/ Clustering Behaviour/Event Recognition [51][93] Anomaly/Fault Detection Mechanism Failure [94]
Forecasting/Prediction/Regression Travel time prediction [95][74] Manufacturing Forecasting/Prediction/Regression Machine Maintenance [96]
Design / Configuration Feature Design; Production Processing
[97][98] Anomaly/Fault Detection Quality Control [99][100] Smart Home Pattern Recognition/ Clustering Activity recognition [101][102] Decision tree Smart Grid Anomaly/Fault Detection fault detection
predict an energy demand
[103] [104] Forecasting/Prediction/Regression [104] Transport Forecasting/Prediction/Regression To predict the traffic
congestion level and pollution level; bus travel time
[105] [106] [106] Anomaly/Fault Detection Cyber Attacks / detect
stereotypical motor movements
[107]
Manufacturing Classification/Diagnosis Quality Control/Fault diagnosis [108][109] Bayesian Network Transport Classification Event and behaviour detect [51]
Smart Grid Anomaly/Fault Detection Non-technical losses and fault detection
[103] Manufacturing Anomaly/Fault Detection Fault detection in the
production line
[110] Forecasting/Prediction/Regression Tool wear prediction/Energy
consumption prediction
[111][112] Self-Organising Map Transport Clustering Obstacle detection and
recognition
[75] Evolutionary
Computing
Smart Grid Optimisation/ Forecasting/Prediction Short Term load forecasting [113] Swarm Computing Smart Grid Optimisation economic load
dispatch/feature Selection
[114][115] Manufacturing Anomaly/Fault Detection/Process
optimisation
Fault detection, classification and location for long transmission lines/Process optimization
Automatic fault diagnosis of bearings
[116][117][11 8]
HMM Smart Grid Optimisation
Optimal decisions on smart home usage
[119] Manufacturing Anomaly/Fault Detection
Automatic fault diagnosis of bearings [117][120] Reinforcement learning /Q-learning-based ADP algorithm
Smart Grid Optimisation Aided Optimal Customer Decisions for an Interactive Smart Grid
[119]
Transport Optimisation the road latent cost [121] Deep Learning/ Autoencoder model/ convolutional neural network (CNN)/Recurrent Neural Networks (RNNs)
Smart Grid Forecasting/Prediction/classification/ Regression
Building Energy consumption [122]
Transport Traffic flow prediction;
processing roads images / commanding Steering; detecting train door anomaly and predicting breakdowns Anomaly-based detection of malicious activity
[123][124][12 5] [126] [94]
Other To classify various human
activities; To detect congestive heart failure
[54] Other
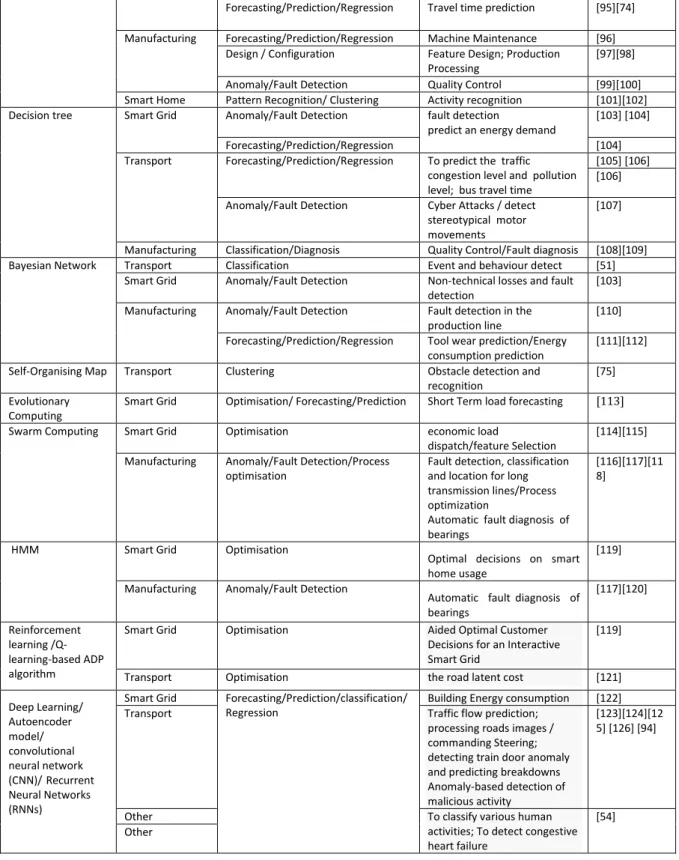
Table 1 shows an overview of machine learning methods where they have been used in the loose context of CPS. They have been used to carry out
tasks in three different applications and domains: smart grid, transport and manufacturing.
ANN is one of the most popular methods having been used in the various domains and applications, as it is capable of doing long term forecasting by regressing the stream data generated by multiple interdependent factors or single variable from time series to predict the trend in power generations, consumptions and bus travel time estimations. For example, in smart grid and manufacturing, ANN is efficient to predict the consumption of consumer and production line for the demand side management and load management power generation management. Only few researchers use ANN in the real-time or short-term predication [84][68], as it requires considerable time to process and tune the parameters before it can be deployed. Most applications require large amount of input data and training time to produce meaningful model with certain degree of accuracy and confidence [65][41][70]. Even though ANN can work alone and produce acceptable results, but it often works with other learning methods such as SVM, GA, Bayesian etc. to compliment ANN to improve training efficiency or modelling accuracy [41]. In the table, term ANN was broadly used, but it has a lot of variants with various activation functions and structures and form a hybrid model to meet the purposes such as forecasting, classification, clustering, and regression for different applications. Ref [41] has carried out detailed analysis of these variations and hybrid approaches. Here, we classify applications into this category using ANN as the main body for their solutions.
SVM has been widely adopted to address the issues in product feature design, fault detection, forecasting, clustering and pattern recognition across the application domains such as manufacturing, smart grid, transportation as well as smart home due to its maturity and transparency. The method can take different sizes of input data to carry out the classification and regression, so it has been used in the applications that require short response time such as [85][86]. It also used in conjunction with other machine
learning methods such as ANN, and Bayesian etc. by exploiting its characteristics to provide complimentary functions to address complex problems [68][96][97]. The authors in [97] used a trained SVM classifier from the classified design examples such as features and components, which are obtained from a hierarchical clustering, to recommend different Additive Manufacturing design features. In the case study, it only shows 21 design features from over hundreds that were used to train and to build model.
The faults in products or tools in manufacturing can lead to a big loss of time and a serious consequence if they are not detected and resolved earlier. Authors in [81]and [82] reported the use of the Random forest to analyse the big data for tooling condition monitoring in milling production and silicon in semiconductor Manufacturing. It also has been used in predicting the short term electricity price from the historical data [79] and detecting the false electricity records from the sensors [80]. Ref [51] reported the use of Random forest to model a driver profile effectively. From these reports, they all require a reasonable amount of historic data for the training and to make the accurate classification and time was not considered as a crucial factor in these applications.
Decision tree is a well-known method for classification, so it is predicable that the researchers have used it to detect the faults in the power system and motor movement and for quality management in the production. It also has been used to predict the energy demand, bus travelling time, and to determine the correlation between traffic congestion and air pollution. The accuracy of fault detection, quality prediction, classification and rare events forecasting are associated with probabilities, as all the input factors cannot be certain due to the dynamic environments and complex human behaviour and interactions. The Bayesian network is a well-studied method to model complex probability networks as it has been used in different
applications to explain the possible occurrences of outputs with input variables. It does not require large amount input data to form the network, if the probability of variables is known. The network can be large and complex, but its processing time is linear. Ref [51][103][110] showed the consistent characteristics in these applications.
Table 1 also shows where the Machine Learning (ML) methods have been used across four application domains and the tasks have been carried out to gain the benefits of analyzing and interpreting large volume of data streams generated. The most common area for the researchers and industry practitioners adopting the methods is to increase accuracy of predication and forecasting in their CPS
applications. The authors in
[41][65][66][67][68][69][79][104] reported adoption of ML to predict electrical power consumption, demand, supply and load in order to improve demand response management in smart grid. ML is a well employed tool to predict traffic flow, air population emitted by cars, traffic congestion and travel time by transport [70][71] [72][73][74][105][106][94][123][124][125][126]. ML also has been extensively applying in manufacturing by predicting energy consumption in production line, machine maintenance, and tool wearing [77] [78] [102] [111][112]. Diagnosis and Fault detection is another function the ML has been widely used in manufacturing to detect root cause of power faults in the production, tooling wearing and mechanic faults, cause of the fault components/products, and quality control [51][99][100][110][117][120]. Smart grid also has several ML applications to anomaly and fault detections such as non-technical loss detection, blackout warning, power line and cyber attacks, faults in demand management and power line faults [69][88][89][86][90][80][103][104] . The utilization of ML for mechanical fault diagnosis and prevention of cyber attacks in transport system can be more explored, as only
two [94][107] reported the benefits of ML in this area. ML is also a popular solution to configure
plant/production, optimize electrical
load/dispatch, and reduce road latent cost, forecast short term in electricity usage and etc. [75][97][98][113][119][121]. ML has been exploited in other applications such as clustering road obstacles, classifying driving behaviours and traffic incidents and improving production quality [51][75][91][108][109].
From Table 1, it can be seen that functions of MLs have brought various benefits to different applications and they have generated different levels of impacts in various areas, but the potentials of MLs are not fully realized yet, as they still evolve and their complexity may hinder the popularities.
IV.
Temporal Complexity
Analysis
Machine learning algorithms are able to learn from selected samples to derive rules, trends, patterns or properties of a true population. The concept or hypothesis space, however, can be large and complex that cannot be learned or
modelled in polynomial time learning
algorithms, but exponential time. In these cases, learning to achieve highly accurate results by exhaustively exploring parameter values may not be possible in computational term, but approximation to the true value. As it is natural, the goal of all machine learning applications is to minimise the differences between the target concept and the output produced by the trained models. The representation, quality and quantity of the selected samples, which are input parameters, to the learning algorithms are important attributes to increase the possibility of the successful learning. The probability of reaching successful learning by increasing accuracy of approximating to the target concept also depends on the complexity of learning and time. Learning is a trade-off between time and accuracy. In principle, the higher accuracy, the more time is required for training. Information
and computation are two main dimensions to measure the complexity of learning algorithms. The sample complexity is concerned with number of training samples, distribution and sufficiency leading to accuracy of prediction, classification or etc. The computational complexity of a solution method is to measure the computational resources required to derive the concepts from the training data. This can be further classified into time and space complexity. Space complexity denotes the memory required for the computational model being selected to store the solution. The time complexity is measured by the number of computational executions in the model to reach or approximate to the target concept. In this paper, we are more
interested in time complexity with
computational complexity than others. We intend to show theoretical complexity rather than the actual runtime of the algorithms which will be various depending on its operating computational environment including hardware and software.
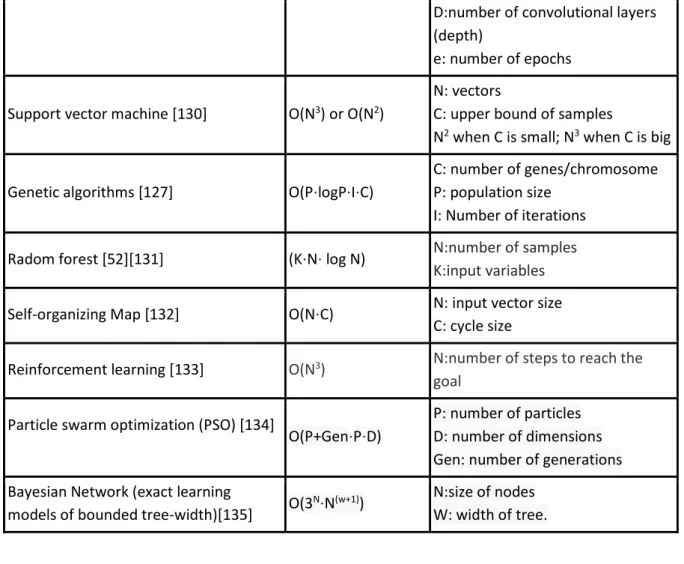
Table 2 shows a list of machine learning methods used by the applications illustrated in Table 1 and their corresponding time complexities, represented in big O, and the factors contributing to the complexities. Since there are many different variants to each machine learning method, it is not feasible to list them exhaustively, but some examples to illustrate measurement of complexity. For example, varieties of Bayesian Network models derived from various approximate and exact inference algorithms to infer unobserved variables, at least ten common ones, can lead to different computational complexities. Several hybrid learning methods including at least two existing learning methods have been proposed to resolve or improve the insufficiency of one individual method that complicate the measurement of the runtime due to the interdependency, as one method may reduce the complexity for the other in the model, but the overall complexity calculation still need to consider all the methods involved. More algorithms and their time complexity can be found in [127].
Table 2: Time complexity of some of the most common machine learning algorithms
Machine learning method Theoretical Time
complexity Factors
Decision Tree Learning[128] O(M⋅N2 ) M: size of the training samples
N: number of attributes Hidden Markov model
Forward-backward pass [52] O(N
2⋅M) N: number of states
M: number of observations
Multilayer Perceptrons [127] O(n⋅M⋅P⋅N⋅e)
n: input variables
M: number hidden neurons P: number outputs
N: number of observations e: Number of epochs
Deep Learning (Convolutional Neural
Networks) [129] O(D⋅N⋅L⋅S
2⋅M2⋅e)
L: number of input variables N:number of filters (width) S: spatial size (length) of the filter M:size of the output.
D:number of convolutional layers (depth)
e: number of epochs
Support vector machine [130] O(N3) or O(N2)
N: vectors
C: upper bound of samples
N2 when C is small; N3 when C is big
Genetic algorithms [127] O(P⋅logP⋅I⋅C)
C: number of genes/chromosome P: population size
I: Number of iterations
Radom forest [52][131] (K⋅N⋅ log N) N:number of samples
K:input variables
Self-organizing Map [132] O(N⋅C) N: input vector size
C: cycle size
Reinforcement learning [133] O(N3) N:number of steps to reach the
goal Particle swarm optimization (PSO) [134]
O(P+Gen⋅P⋅D)
P: number of particles D: number of dimensions Gen: number of generations Bayesian Network (exact learning
models of bounded tree-width)[135] O(3
N⋅N(w+1)) N:size of nodes
W: width of tree.
For example, [119] used Q-learning algorithms to model the interaction with users in smart home with maximum 20 steps to interact with users
before it can propose appropriate
recommendation. Its theoretical time complexity is up to 203 and the authors have concluded that
Q-learning algorithm outperformed greedy or random decision strategies [119] in their simulated cases. Figure 1 shows the complexity level in big O when the number of steps decreases in the simulation. The authors did not report the actual runtime, so it cannot be correlated the theoretical complexity to experimental one.
Figure 1: Complexity level and number of steps in Q-learning
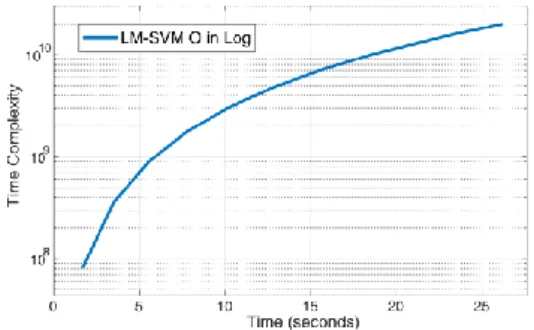
Ref [66] used three machine learning methods, SVM, LS-SVM and BPNN, for energy usage forecasting over 283 households with 500 point data (hours) for each. The total number of data points for training in the experiments is 141,500 (283*500). In their empirical study, the computational times of these methods are 335.39, 26.22, and 29.28 seconds respectively over a laptop to produce reasonable accurate results.
The authors recommend running these
approaches in cloud and distributed computing to improve the performance. SVM has better accuracy in reducing errors, but it took more time
than others due to the overhead of using GA to find key parameters for SVM. The BPNN has more errors than the other two and it requires a bit more runtime than LS-SVM. The authors, however, did not include key parameter values such as generations and input points etc. for GA and BPNN, so to derive their time complexity in relation to actual runtime cannot be fulfilled. The time complexity of LS-SVM is O(1415002). Figure
2 shows the time complexity of LM-SVM by applying the data from [66] with simulation output and the actual runtimes in seconds. This shows actual runtimes against the complexity level and the correlation between them without carrying out the actual experiments, the researchers can estimate its actual runtime by giving the number of samples when the underlying machine or environment has the same characteristics.
Figure 2: Time complexity of LM-SVM
The authors in [136] report the applications of Particle swarm optimization method to balance different loads by considering price to dispatch them. The test case one includes 6 factors (dimensions), 6 generators (particles) and 100 generations to evolve, and its time complexity in theory is 3606 (6+6*100*6) before it has a satisfactory convergent result. In their test case two, it increases to 7 factors, 40 generators and 400 generations, so 40+40*400*7 (is the theoretical time complexity is 112,040. In another test case it has 5 factors, 20 generators, and 400 generations (40,020 in O) and its actual computational runtime is 0.29282 second that is around 10 and 200 times slower than the other approaches [136] in the simulation. Figure 3 shows the relationship between complexity and actual runtime by extending the figures given in the paper. The line is the time complexity in log and
the solid line is actual runtime. The researchers can refer this to approximate the actual runtime of an application with the same computational resources by giving key parameter values of the learning method. The approximation is not rigid, as we assume that the space complexity is changing linearly.
Figure 3: relationship between complexity and actual runtime of particle swarm optimization method
For deep NN learning methods such as CNN, the weights in the convolutional layers are trained and updated in a similar way as traditional ANNs/MLPs (Multilayer Perceptrons) except that the number of filters and layers are orders of magnitude higher than those in traditional MLPs. The authors in [129] report their experimental results on computational time complexity of a CNN model by varying different key parameters such as depth, filter size and number, width and pooling layer etc. of the network to find their trade-offs between two parameters to investigate the overall performance in terms of time complexity and output accuracy. We share the same view with the authors [129] that introducing computational time and memory constraints can give better understanding the value of machine learning methods in realistic business applications.
The training of these deep NN models needs massive resources (e.g. to accommodate the training data) and time, they should be carried out on the Cloud. However, the operation time of these models is only proportional to the number of neurons no matter how large the training data
is, the on-line analysis tasks can be deployed on the Edge/Fog.
As it has been observed in this analysis, only a few works report the empirical time complexity of their approaches. Therefore, the estimation on the empirical time complexity of a training algorithm still has rooms for more extensive study. This information may be vital for decision making on-the-fly if a learning task can be deployed in the edge devices.
V.
Online Learning Methods
If we take a look at Table 2 we will observe that the theoretical complexity of the classic learning algorithms reported in the literature review normally takes into consideration many terms (e.g., number of samples, iterations, structure parameters, etc.). In theory, this could result in high order polynomial behaviour, which would deter the deployment of the learning phase in edge devices. This is because firstly over time, more and more streaming data will be accumulated and it is impractical and often infeasible to accommodate large volumes of streaming data in the machine’s main memory; secondly, it is also infeasible to regularly reconstruct new models from the scratch with accumulated streaming data in real-time; further CPS data streams feature the perishable insights, i.e., information that must be acted upon fast, as insights obtained from streaming data, such as from sensors, quickly lose their value if they were to be processed in ‘batch mode’) [16]. As a result, a new paradigm of learning, i.e. incremental and On-line learning algorithms should be adopted. Losing et al. [137] gives the definition of incremental learning for supervised learning as below (we change the notations/symbols for consistency reasons).
An incremental learning algorithm generates, on a given stream of training data 𝑆1, 𝑆2…, 𝑆𝑁, a sequence of models 𝐻1, 𝐻2…, 𝐻𝑁, where 𝑆𝑖 is labeled
training data 𝑆𝑖 = (𝑋𝑖 , 𝑌𝑖) ∈ 𝑅𝑛 ×
{1, . . . , C} and 𝐻𝑖 : 𝑅𝑛 {1, . . . , C} is a
model function solely depending on 𝐻𝑖−1 and the recent p examples
𝑆𝑖 ,. . . , 𝑆𝑖−𝑝 , with p being strictly
limited.
Losing et al. [137] further specify on-line learning algorithms as incremental learning algorithms which are additionally bounded in model
complexity and run-time, capable of
endless/lifelong learning on a device with restricted resources.
Incremental and on-line learning algorithms aim for minimal processing time and space; and thus fit in CPS data processing environments.
Losing et al. [137] evaluate eight popular incremental methods representing different algorithm classes such as Bayesian, linear, and instance-based models as well as tree-ensembles and neural networks. Experiments are carried out to evaluate these algorithms with respect to accuracy, convergence speed as well as model complexity, aiming at facilitating the choice of the best method for a given application. However, it primarily covers supervised incremental learning algorithms with stationary datasets, although robustness of the methods to different types of real concept drift are also investigated.
Gama et al. [138] considers dynamically changing and non-stationary environments where the data distribution can change over time yielding the phenomenon of concept drift, which applies to most of the real world CPS applications. Adaptive learning algorithms, defined as advanced incremental learning algorithms that are able to update predictive models online during their operation to react to concept drifts, are explored. Taxonomy for adaptive algorithms, presented in four modules as memory, change detection, learning, and loss estimation, is proposed; and the methods within each module are also listed. Gama et al. [138] focuses on online supervised learning.
Ade et al. [139] includes some unsupervised incremental learning approaches that learn from
unlabelled data samples to adjust pre-learned concepts to environmental changes. Most of the incremental clustering algorithms for pattern discovery rely on similarity measure between the data points. An exemplary approach is called Concept Follower (CF) that includes CF1 and CF2 [140]. CF1 and CF2 learn from unlabelled data samples to adjust pre-learned concepts to environmental changes. Initially, a supervised learner is used to learn and label a set of concepts. When a new sample is collected, CF1 calculates the distance of the sample to all concepts and the
concept with the minimal distance to the sample
is identified. If the distance is smaller than the predefined threshold, CF1 considers the concept a match and then slightly shifts, by a learning rate parameter, towards the classified sample to adjust to the concept drift; otherwise CF1 detects the abrupt change and repeats the initial supervised learning stage. Compared to CF1, CF2 supports problems areas with unbalanced sample ratio between concepts. This is done by CF2 adjusting all concepts in the proximity of the sample instead of, as does CF1, adjusting only the
concept closest to the sample.
Next, we discuss on some of the most relevant online approaches to the machine learning algorithms identified in this article.
Artificial Neural Networks
Classically, artificial neural networks are trained using a training set and optimization methods such as gradient descent and backpropagation to minimize a cost function correlated to the error derived from the current state of the network. The online version can adapt to the arrival of new data consists of pre-training the network with all the available training set, and then adapt the pre-trained network by using stochastic gradient descent over the new series of available data. This type of setting would benefit from a combination of both cloud technologies (i.e., for pre-training the network), and edge computing (i.e. for adapting the network).
While the use of stochastic gradient descent allows adopting a batch algorithm like backpropagation in a non-batch setting, there are specialized learning algorithms, called online sequential learning methods, for training neural networks in an online setting in which data
becomes available with time
[141][142][143][144]. They can be efficient and more adequate for being deployed in an edge device as they do not require to store past training samples. The online sequential learning methods tend to be ad-hoc for networks with specific activation functions, or with specific architectures (e.g., single hidden layer). Therefore, the complexity of problems represented by these networks may not be as vast as the one represented by classic neural networks or deep learning approaches.
Decision trees
The classic learning decision trees require that all of the training samples are considered when computing information gain [145]. This is hardly applicable in a stream analytics context, as training samples arrive constantly. Therefore, it requires different learning mechanisms to properly learn decision trees in a stream analytics context, which the trees can evolve from a stream of data. Some approaches with a default tree structure provide a series of greedy steps to adapt to the new training samples. These includes ID5R algorithm [146], an adaptation of the popular ID3 learning algorithm for stream data, and ITI [147]. Nevertheless, these greedy changes were in some cases suboptimal and ended up in inappropriate adaptations to change.
The other approach to learning decision trees from streams is to maintain a set of statistics at nodes and only split a node when sufficient and statistically significant information is available to
make the split. Hoeffding inequality
[148][149][150] are the backbones to these approaches, which provide bounds for the number of observations that are necessary to obtain an estimated mean that does not differ
from the mean of the underlying random variable. Some researchers [REF] have recently argued that the assumptions underlying the Hoeffding inequality are not appropriate when constructing online trees. Some methods split at nodes of the decision tree base on other modeling paradigms such as McMiarmid’s bound [151], or Gaussian processes [152].
Random forests
The general idea behind online random forests consists of providing both a method to carry out online bagging, and a method to carry out online learning of random trees. Abdulsalam et al. [153] take an approach that carries out online bagging by dividing the incoming samples of data into blocks with a certain size. Then, blocks of data randomly selected are employed for either training or testing a tree in the model. The training block is redirected to a chosen tree, and an online learning algorithm for trees is employed to update the current tree. Later on, the learning model is enhanced to adapt to the random arrival of labeled examples in the stream, with blocks of different sizes and frequency [154].
Another alternative to the online bagging process described above is employed by Saffari et al. [155]. In this case, each new sample is presented in a number of times that is controlled by a Poisson distribution, to each random tree in the model. Then, the random trees gradually grow by creating random tests and thresholds at decision nodes and choosing the best one after a number of statistics have been gathered that guarantee that the test is the best from the ones randomly created at the decision node.
Other approaches opt for avoiding online bagging at the forest level, and the subsampling is carried out at the tree level [156]. When a new sample arrives to the random forest, this sample is presented to all of the trees. Then, the individual tree decides if the sample will be used to influence the structure of the tree or used to
estimate class membership probabilities in the leaf they are assigned to.
Support vector machines
Classification in support vector machines are based on the idea of finding the maximum margin hyperplane that separates elements from different categories. By definition, one should have access to the entire training dataset in order to build such maximum margin hyperplanes. Otherwise, there would be no guarantee that estimated hyperplanes are optimal. This assumption limits the applicability of classic support vector learning algorithms to an online setting, and it forces scholars to devise new methods that are adapted to the online setting. The incremental approach to support vector learning typically requires to determine if a new sample should become a support vector that modifies the current hyperplane. The algorithm also needs to determine if previously calculated support vectors still yield as relevant after the observation of the new sample, and remove those that are no longer relevant. Otherwise, online approaches to support vector learning incur in the risk of growing linearly with the infinite number of samples [157]. To tackle this problem, there have been a number of proposals that aim to build a support vector model with adequate predictive performance while also minimizing the number of support vectors in the resulting model [157][158][159][160].
VI.
Discussions
So far machine learning methods of various categories, including some deep learning ones) have been employed for various data streams analysis purposes. Little literature has studied the integration of these methods to the Cloud and Fog computing architecture.
The very nature of CPS requires a computing paradigm that offers latency sensitive monitoring, intelligent control and data analytics for intelligent decision making. In contrast to the Cloud, the Fog performs latency-sensitive