SN Applied Sciences (2020) 2:1243 | https://doi.org/10.1007/s42452-020-3051-2
Detection of colon cancer based on microarray dataset using machine
learning as a feature selection and classification techniques
A. S. M. Shafi1,2 · M. M. Imran Molla2 · Julakha Jahan Jui3 · Mohammad Motiur Rahman1 Received: 31 December 2019 / Accepted: 10 June 2020 / Published online: 18 June 2020
© Springer Nature Switzerland AG 2020
Abstract
Microarray data is an increasingly important tool for providing information on gene expression for analysis and interpreta-tion. Researchers attempt to utilize the smallest possible set of relevant gene expression profiles in most gene expression studies to enhance tumor identification accuracy. This research aims to analyze and predicts colon cancer data employing a machine learning approach and feature selection technique based on a random forest classifier. More particularly, our proposed method can reduce the burden of high dimensional data and allow faster calculations by combining the “Mean Decrease Accuracy” and “Mean Decrease Gini” as feature selection methods into a renowned classifier namely Random Forest, with the aim of increasing the prediction model’s accuracy level. In addition, we have also shown a comparative model analysis with selection of features and model without selection of features. The extensive experimental results have demonstrated that the proposed model with feature selection is favorable and effective which triumphs the best performance of accuracy.
Keywords Colon cancer · Microarray data · Feature selection · Machine learning · Random forest · Cross validation
1 Introduction
Colon cancer is a substantial public health problem and the global incidence of this cancer has risen quickly with population growth. World Health Organization (WHO) GLOBOCAN database study 2018 reported 1,849,518 new cases of Colorectal Cancer (CRC) and 880,792 deaths asso-ciated with CRC [1]. CRC is the third leading cause of can-cer related death in the United States, 2019 [2]. A recent study [3] indicates that approximately 25% of CRC cases have a genetic predisposition. Golub et al. [4]. first devel-oped a generic cancer classification approach based on DNA microarray gene expression monitoring. They also
proposed that such microarrays might provide a classifica-tion tool for cancer. Microarray based gene expression has been widely used in the diagnosis and analysis of colon cancer. Early detection of colon cancer is very important for proper diagnosis and treatment. Microarray dataset consists of thousands of genes and the number of samples is usually small. It is a challenging task to identify the most relevant genes from such types of microarray data as not all genes have sufficient follow-up-information and many of them are redundant. Feature transformation and feature selection are the two current methods of obtaining feature genes for cancer classification based gene expression data [5]. Feature transformation is a process in which to create Electronic supplementary material The online version of this article (https ://doi.org/10.1007/s4245 2-020-3051-2) contains
supplementary material, which is available to authorized users.
* A. S. M. Shafi, [email protected] | 1Department of Computer Science and Engineering, Mawlana Bhashani Science
and Technology University, Tangail 1902, Bangladesh. 2Faculty of Computer Science and Engineering, Khwaja Yunus Ali University,
Enayetpur, Sirajgonj 6751, Bangladesh. 3Faculty of Electrical and Electronics Engineering, Universiti Malaysia Pahang, 26600 Pekan, Pahang,
a new set of features from original features to achieve the purpose of feature reduction. Although they have high discriminatory power, sometimes they do not retain the biological information of the original gene expression. Transformation of data reflects the loss of data interpret-ability and makes it impossible to identify the target genes associated with cancer. Unlike feature transformation methods, feature selection methods do not create a new subset of features. They work by removing non-relevant or redundant features and retains the best classification accuracy. Feature selection does not involve transforma-tion of the original features thus decrease the dimension-ality problem and builds a robust learning model from the selected data [6]. Therefore, the methods of feature selec-tion have gained further interest. The most common fea-ture selection methods can be separated into three main categories: filters, wrappers, embedded techniques [7, 8]. Filter methods are the process of selecting features based on some statistical performance of the features and are independent of any subsequent machine learning algo-rithms. They are very fast computationally and rely entirely on data set features. One of the main disadvantages is that they ignore correlation between features. Wrapper meth-ods are based on greedy search algorithms that search by iteratively selecting features on a specific machine learn-ing algorithm for optimal subset of features. For a dataset with many features, they are slower than filters and com-putationally expensive. Embedded methods interact with the classification model for feature selection and are less computationally intensive and faster as compared to fil-ters and wrappers. Common embedded method includes various types of decision trees, random forest, and artificial neural networks. In this study, we proposed a method to select variables using Mean Decrease Accuracy (MDA) and Mean Decrease Gini (MDG). Then, a random forest classifier [9, 10] is constructed for colon cancer prediction.
The rest of the paper is organized as follows: Sect. 2
presents the previous work done in colon cancer detec-tion based on machine learning tools related to microarray dataset; Sect. 3 describes the architecture and methods of the proposed system. Section 4 deals with the analysis of experimental results and discussion. Finally, the conclu-sions of this study are summarized in Sect. 5.
2 Related works
Recently, a lot of research has been developed to work on healthcare data by incorporating machine learn-ing techniques with feature selection methods. Park & Kim developed a model with 20 datasets of microarray gene expressions to examine the property of the model based on sequential random k-nearest neighbor feature
selection method [11]. An intelligent technique based on feature selection using t-statistic was proposed for colon cancer prediction. Authors achieved almost 85% accuracy using t-statistic feature selection method and Support Vec-tor Machine (SVM) classifier [12]. A Fuzzy Decision Tree (FDT)-based feature selection algorithm was introduced by S.A. Ludwig et al. [13] to analyze gene expression for colon cancer data classification and achieved 80.28% accu-racy by selecting 20 features. Modified Analytic Hierarchy Process (MAHP) with Probabilistic Neural Network (PNN) was introduced in [14] as a novel aggregate gene selection method for microarray data classification. The experimen-tal results demonstrated that the proposed MAHP method obtained the top accuracy of 88.89% for colon cancer diag-nosis with a benefit of inexpensive computational cost. Authors [15] used Fast Correlation Based Feature Selection (FCBFS) method with SVM as optimized by Particle Swarm Optimization (PSO) and Artificial Bee Colony (ABC) to improve cancer classification quality. They observed that the classification model based on PSO and ABC attained 93.55% classification accuracy for colon cancer prognosis. Maolong et al. [5] developed a Binary Quantum-Behaved Particle Swarm Optimization (BQPSO) and SVM with leave-one-out cross validation (LOOCV) based method for cancer feature selection and classification. They con-cluded that the proposed algorithm produced the clas-sification results, with best accuracy of 93.55% and mean accuracy of 92.52% for colon cancer datasets. Authors [16] relies on the methodology that uses Information Gain (IG) for feature selection, Genetic Algorithm (GA) for feature reduction, and Genetic Programming (GP) for cancer clas-sification based on the gene expression profiles. For colon tumor classification, the suggested algorithm achieved an accuracy of 85.48%. A method of selecting features using Genetic Algorithm (GA) was proposed to select the best subset of features for breast cancer diagnosis system [17]. Random forest is an ensemble based classifier consist-ing of a collection of trees of classification and regression (CART). Compared to other classifiers like Adaboost, SVM, neural network, decision tree, it reduces overfitting and therefore is more accurate. It is also used as a feature selec-tion approach to rank the feature importance.
3 Methodology
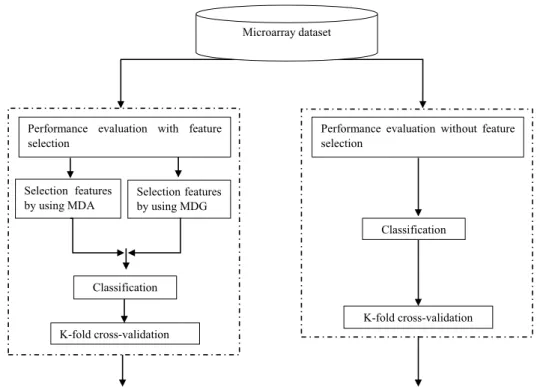
Figure 1 shows this study’s methodology. The process starts with data collection. The first phase data was then transferred for classification purposes to the second phase. In the third phase, we applied two MDI and MDG-based feature selection algorithms that were used to train and test the data. We performed a comparative design study
SN Applied Sciences (2020) 2:1243 https://doi.org/10.1007/s42452-020-3051-2
without selecting features and models that used feature selection in the final research phase.
3.1 Phase 1 data acquisition
Colon cancer gene expression data has been obtained from [18] in the data acquisition phase. The datasets are made up of 62 cases (tests) and 2000 genes (attrib-utes) from patients with colon cancer. Among them are 40 tumor biopsies (marked as abnormal) and 22 normal. Colon tumor sample data can be seen in Table 1.
3.2 Phase 2 evaluation of classification without feature selection
In this phase, a RF classifier with tenfold cross-validation was performed with all the attributes to evaluate the per-formance of the model.
3.3 Phase 3 evaluation of classification with feature selection
MDA and MDG ware performed as feature selection tech-niques with an end goal to pick the significant important features. At that point, we built a robust model by utilizing the selected features and performed a similar procedure as described in the above phase.
3.4 Phase 4 comparative analysis
In this phase, we compared the model’s output without selection of features and the model with selection of fea-tures. We used recall, precision, accuracy, and F1-score metrics to assess the reliable performance of the clas-sification. Such output measures are extracted from the confusion matrix, which is used for evaluating classifier performance. Representation of confusion matrix and the Fig. 1 Framework of the
pro-posed model Microarray dataset
Performance evaluation with feature
selection Performance evaluation without feature selection
Selection features
by using MDA Selection features by using MDG
Classification K-fold cross-validation
Classification
K-fold cross-validation
Comparison between the model based on feature selection and the model build without feature selection
Table 1 Colon tumor data samples
No Attribute_1 Attribute_2 Attribute_3 Attribute_4 Attribute_5 … Attribute_2000 Class 1 8589.416 5468.2407 4263.4077 4064.9358 1997.893 … 28.70125 Abnormal 2 9164.254 6719.5293 4883.4487 3718.159 2015.2214 … 16.77375 Normal 3 3825.705 6970.3613 5369.9688 4705.65 1166.5536 … 15.15625 Abnormal 4 6246.4487 7823.534 5955.835 3975.5642 2002.6132 … 16.085 Normal …… …… …… …… …… …… … …… …… 62 7472.01 3653.934 2728.2163 3494.4805 2404.6655 … 39.63125 Normal
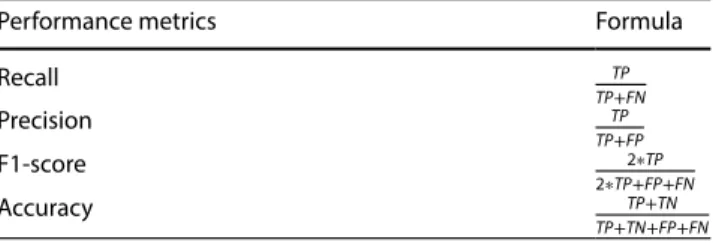
formula for the measurement of performance metrics are shown in Tables 2 and 3 respectively.
Recall also known as sensitivity is the ratio of correctly predicted positives cases to the all observations in actual class. The precision metric indicates the correct positive outcomes out of all the positive outcomes. The accuracy of a classifier is simply the ratio of correctly predicted class to total class. F1-score is estimated by applying the weighted average over precision and recall. In case we have an une-ven class proportion, F1-score is generally more valuable than precision because it takes both false positives and false negatives into account.
3.5 Feature selection algorithms description
Feature selection plays an important role for interpreta-tion and predicinterpreta-tion. It also makes the classificainterpreta-tion pro-cess easier rather than incorporating unnepro-cessary features. Feature selection discovers the most significant features for microarray or high dimensional dataset, reducing the classifier’s workload and accordingly improves the classifi-cation accuracy. For feature selection, two indices are con-sidered in this paper: Mean Decrease Accuracy (MDA) and Mean Decrease Gini (MDG) [19]. These two techniques take into account the importance of variable’s impurity and the importance of out-of-bag (OOB) error [20].
3.5.1 Mean decrease accuracy
MDA is also called permutation importance. OOB error is a subsampling technique used to calculate prediction error and then evaluate the variable importance. MDA is a method that is usually described as a decrease in the model accuracy from permuting the values in each feature. The formula for Mean Decrease Accuracy [21] is
where VI(xj) is the variable importance of xj(j = 1, 2, 3,…, M, where M is the number of all variables) in tree t, t ∊ (1, 2, 3, …, ntree ) denotes the number of trees, yi =f
(
xi) is the OOB error on the tree t before permuting the values of xj , and yi =f(xji) is the OOB error on the tree t after
permut-ing the values of xj . A variable is considered to be as more important whose exclusion (or permutation) decrease the accuracy of random forest. That’s why variables with a large mean decrease in accuracy are more important for classification.
3.5.2 Mean decrease gini
Mean Decrease Gini is a forest-wide weighted average of the decrease in the Gini Impurity which is a metric used in decision trees to determine how a variable splits between the parent and child nodes. It can be defined as averaging the total decrease in node impurity across all the trees that forming the forest. We can calculate variable importance ( VI ) for variable xj for MDG method as described by the following equation [21]:
It simply records the decrease in Gini Impurity for all variables from 1 to ntree. A variable with higher Mean
Decrease in Gini indicates higher variable importance.
3.6 Classification algorithm description
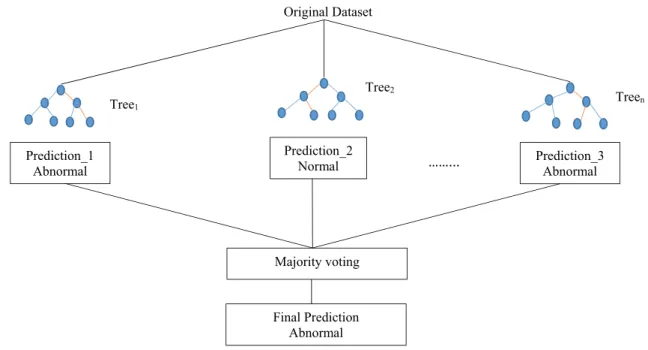
In this study, a renowned classification algorithm for the prediction model namely random forest was evaluated in the prediction of colon cancer. RF is a combined classi-fier formed by combining a collection of unpruned deci-sion trees, i.e., CART (classification and regresdeci-sion trees). A detailed overview of CART procedure can be found in Chang and Wang [22] and Harb et al. [23]. The RF pre-diction when conducting classification analysis is the unweighted majority of individual trees class votes. Fig-ure 2 represents a RF model’s architecture for predicting the class of colon.
3.6.1 Random forest algorithm description [24]
For the original dataset D(X, Y), RF constructs the basic decision trees: (1) VI�xj � = 1 ntree ntree � t=1 ∑ i∈OOBI � yi=f � xi �� −∑i∈OOBI�yi =f � xij�� �OOB� (2) VI(xj)= 1 ntree [ 1− ntree ∑ k=1 Gini(j)k ] Table 2 Confusion matrix
Actual class Predicted class
Positive Negative Positive True positive, TP False negative, FN Negative False positive, FP True negative, TN
Table 3 Performance measure representation
Performance metrics Formula
Recall TP TP+FN Precision TP TP+FP F1-score 2∗TP 2∗TP+FP+FN Accuracy TP+TN TP+TN+FP+FN
SN Applied Sciences (2020) 2:1243 https://doi.org/10.1007/s42452-020-3051-2
where, n is the number of training observations con-sists of a set of instances whose class membership is known, K is the number of class and (xi, yi) ϵ (X, Y). Find an optimal classifier hK(X) that minimizes the error with respect to the original dataset, then the combined clas-sifier can be described as:
3.6.2 K‑fold cross‑validation description
Cross-validation is a resampling procedure used to eval-uate machine-learning models on a limited data sample. The method has a single parameter called k which cor-responds to the number of groups to be divided into a given data sample. Therefore, the technique is often referred to as k-fold cross-validation. When the specific value of k is chosen to be 10 then the model is called tenfold cross-validation.
K-fold cross-validation is carried out according to the following steps:
• Spilt the whole dataset into k equal parts where each spilt of the data is called a fold. Let f1, f2,……fk be the name of each fold.
(3) D(X,Y) ={(x1,y1),(x2,y2)… … …(xn,yn)} (4) h={h1(X),h2(X),… … …hK(X) } • for i = 1 to k
o Keep the fold fi as a validation set and the remain-ing k-1 folds in the trainremain-ing set.
o Fit a model on the training set and evaluate the accuracy of the model on the validation set. • Calculate the model’s accuracy by averaging the
accu-racy of all k-fold cross-validation cases.
4 Results and discussion
This section explains briefly the experimental results obtained in the three phases namely evaluation of clas-sification phase without feature selection, evaluation of classification phase with feature selection, and compara-tive analysis phase. For experimental testing, we have considered each of the 2000 genes to classify the whole dataset into two classes: normal and abnormal. Table 4
shows the confusion matrix and the performance analysis with respect to recall, precision, F1-measure, and accuracy scores across the two different classes is shown in Table 5.
As can be seen in Tables 4 and 5, the results of our clas-sification model based on random forest that can cor-rectly detect 52 items out of a total of 62 items, resulting in a weighted recall, precision, and F1-score of 83.68%, 83.87%, and 83.68% respectively. The overall accuracy of
Original Dataset
Prediction_1
Abnormal Prediction_3 Abnormal
Prediction_2 Normal Majority voting Final Prediction Abnormal Tree1 Tree2 Treen ……...
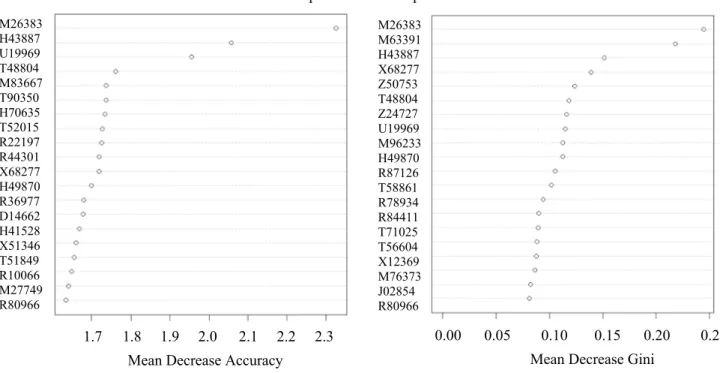
this model is 83.871% using all genes. We have applied mean decrease accuracy and mean decrease gini as a fea-ture selection procedure to remove the most irrelevant and redundant genes from the whole dataset. The aim is to identify a subsets of discriminatory genes that improves the performance of learning models. Figure 3 shows the selection of top 20-genes.
From Fig. 3, the outcomes indicate that the top 20-genes selected by the two feature selection meth-ods, the top 7-genes (M26383, H43887, U19969, T48804, X68277, H49870, and R80966) are common among these
40. Considering the common 7-genes, the total number of top selected genes is 33 that has been used to build up a robust learning method. The final confusion matrix and the performance metrics based on the top selected 33 genes are depicted in Tables 6 and 7 respectively.
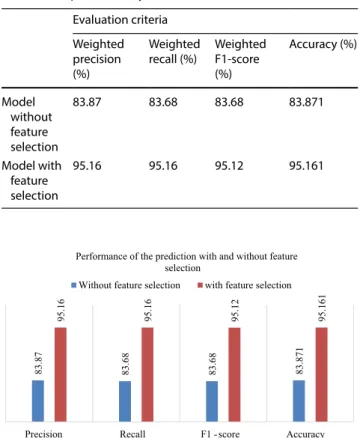
The model based on the top 33 selected genes can cor-rectly detect 59 samples out of 62 samples with an accu-racy of 95.161%. The models also achieved the weighted recall, precision, and F1-score of 95.16% and 95.12% respectively. Table 8 exemplifies the comparative study of the model with and without feature selection.
The results in Table 8 demonstrate that when using the model with feature selection, all the analysis metrics out-performed their counterparts without the model without feature selection. The graphical representation of the over-all results of the model based on the performance metrics is as shown in Fig. 4. Table 9 shows the comparison of our proposed method with existing approaches.
From Table 9, it proves that the performance of our method is better than all other methods which have lower performance on this gene expression data.
Table 4 Confusion matrix of the model without feature selection Actual class Predicted class
Abnormal Normal
Abnormal 36 4
Normal 6 16
Table 5 Performance analysis of the model without feature selec-tion
Class Recall Precision F1-score Accuracy (%) Abnormal 0.85714 0.90 0.8780 Normal 0.80 0.72727 0.7619 83.871 Weighted measure (%) 83.68 83.87 83.68
Top 20-Variable Importance
1.7 1.8 1.9 2.0 2.1 2.2 2.3 0.00 0.05 0.10 0.15 0.20 0.25
Mean Decrease Accuracy Mean Decrease Gini
M26383 H43887 U19969 T48804 M83667 T90350 H70635 T52015 R22197 R44301 X68277 H49870 R36977 D14662 H41528 X51346 T51849 R10066 M27749 R80966 M26383 M63391 H43887 X68277 Z50753 T48804 Z24727 U19969 M96233 H49870 R87126 T58861 R78934 R84411 T71025 T56604 X12369 M76373 J02854 R80966
Fig. 3 Feature selection result
Table 6 Confusion matrix of the model with feature selection Actual class Predicted class
Abnormal Normal
Abnormal 39 1
SN Applied Sciences (2020) 2:1243 https://doi.org/10.1007/s42452-020-3051-2
5 Conclusion
In this examination, we assessed the utilization of machine learning techniques for the order of classification of colon cancer prediction/prognosis dependent on the variation in gene expression. We additionally examined to discover the dependability of the most significant gene expression or patterns from a natural point of view. For this reason, we have presented the results of our experiments with and without feature selection algorithm. We also compared the attributes identifiers of top 33 selected genes with those obtained from 2000 genes. We achieved the best predic-tion accuracy by applying the feature selecpredic-tion methods comprising 33-genes rather than every one of the 2000 genes. From the analysis of experimental results, we may infer that the combination of different types of feature selection methods and classification models can give good outcomes in the field of detecting and classifying several categories of cancer. In future we will extend our research that can integrate more sophisticated methods for feature selection.
Acknowledgements Authors are very grateful to Khwaja Yunus Ali Medical College and Hospital, Bangladesh for valuable supports and suggestions.
Author contributions Methodology, Original draft, Writing-review and editing: A. S. M. Shafi; Formal Analysis, Software: M. M. Imran Molla; Writing-review and editing: Julakha Jahan Jui; Supervi-sion: Mohammad Motiur Rahman.
Availability of data and material Not applicable.
Code availability Not applicable.
Compliance with ethical standards
Conflict of interest On behalf of all authors, the corresponding au-thor states that there is no conflict of interest.
References
1. World Health Organization (WHO) Cancer. Updated September 12, 2018. Accessed November 26, 2019
2. Siegel Rebecca L, Kimberly D, Miller JA (2019) Cancer statistics. CA Cancer J Clin 69(1):7–34
3. Wong Martin CS, Ding H, Wang J, Chan SFP, Huang J (2019) Prevalence and risk factors of colorectal cancer in Asia. Intest Res 17(3):317–329
4. Golub TR, Slonim DK, Tamayo P, Huard C, Gaasenbeek M, Mesirov JP, Bloomfield CD (1999) Molecular classification of cancer: class
Table 7 Performance analysis of the model with feature selection Class Recall Precision F1-score Accuracy (%) Abnormal 0.95122 0.975 0.9629 Normal 0.95238 0.90909 0.9302 95.161 Weighted measure (%) 95.16 95.16 95.12
Table 8 Comparative analysis of the model Evaluation criteria
Weighted precision (%)
Weighted
recall (%) Weighted F1-score (%) Accuracy (%) Model without feature selection 83.87 83.68 83.68 83.871 Model with feature selection 95.16 95.16 95.12 95.161 83.8 7 83.6 8 83.6 8 83.871 95.1 6 95.1 6 95.1 2 95.161
Precision Recall F1 -score Accuracy
Performance of the prediction with and without feature selection
Without feature selection with feature selection
Fig. 4 Graphical comparison of the model for different evaluation criteria
Table 9 Performance comparison among different methods Publication Method No. of
attrib-utes
Accuracy
Simone A. Ludwig et al.
[13] FDT 20 80.28%
Nguyen T et al. [14] MAPH + PNN 5 88.89% Lingyun Gao et al. [15] FCBFS + SVM 14 93.55% Salem H et al. [16] IG + GA + GP 60 85.48% Proposed method MDA + MDG + RF 33 95.16%
discovery and class prediction by gene expression monitoring. Science 286(5439):531–537
5. Xi M, Sun J, Liu L, Fan F, Wu X (2016) Cancer feature selection and classification using a binary quantum-behaved particle swarm optimization and support vector machine. Comput Math Meth-ods Med 2016:1–9
6. Ghazavi SN, Liao TW (2008) Medical data mining by fuzzy mod-eling with selected features’. Artif Intell Med 43(3):195–206 7. Blum AL, Langley P (1997) Selection of relevant features and
examples in machine learning. Artif Intell 97(1–2):245–271 8. Das S (2001) Filters, wrappers and a boosting-based hybrid for
feature selection. In: Proceedings of the 18th international con-ference on machine learning. kaufmann publishers, San Fran-cisco, Calif, USA
9. Nguyen HN, Vu TN, Ohn SY, Park YM, Han M.Y, Kim CW (2006) feature elimination approach based on random forest for can-cer diagnosis. In: Mexican international conference on artificial intelligence. Springer
10. Ram M, Najafi A, Shakeri M (2017) Classification and biomarker genes selection for cancer gene expression data using random forest. Iran J Pathol 12(4):339–347
11. Park CH, Kim SB (2015) Sequential random k-nearest neighbor feature selection for high-dimensional data. Expert Syst Appl 42(5):2336–2342
12. Alladi SM, Shinde SP, Ravi V, Murthy US (2008) Colon cancer prediction with genetic profiles using intelligent techniques. Bioinformation 3(3):130–133
13. Ludwig SA, Picek S, Jakobovic D (2018) Classification of cancer data: analyzing gene expression data using a fuzzy decision tree algorithm. Springer, Berlin, pp 327–347
14. Nguyen T, Khosravi A, Creighton D, Nahavandi S (2015) A novel aggregate gene selection method for microarray data classifica-tion. Pattern Recognit Lett 60–61:16–23
15. Gao L, Ye M, Wu C (2017) Cancer classification based on support vector machine optimized by particle swarm optimization and artificial bee colony. Molecules 22(12):2086
16. Salem H, Attiya G, El-Fishawy N (2017) Classification of human cancer diseases by gene expression profiles. Appl Soft Comput 50:124–134
17. Aalaei S, Shahraki H, Rowhanimanesh A, Eslami S (2016) Feature selection using genetic algorithm for breast cancer diagnosis: an experiment on three different datasets. Iran J Basic Med Sci 19(5):476–482
18. Alon U, Barkai N, Notterman DA, Gish K, Ybarra S, Mack D, Levine AJ (1999) Broad patterns of gene expression revealed by clus-tering analysis of tumor and normal colon tissues probed by oligonucleotide arrays. Proc Natl Acad Sci USA 96:6745–6750 19. Breiman L (2001) Random forests. Mach Learn 45(1):5–32 20. Han H, Guo X, Yu H (2016) Variable selection using mean
decrease accuracy and mean decrease gini based on random forest. In: 7th IEEE international conference on software engi-neering and service science, Beijing, 219–224
21. Strobl C, Boulesteix AL, Kneib T, Augustin T, Zeileis A (2008) Con-ditional variable importance for random forests. BMC Bioinform 9(1):307
22. Chang LY, Wang HW (2006) Analysis of traffic injury severity: an application of non-parametric classification tree techniques. Accid Anal Prev 38(5):1019–1027
23. Harb R, Yan XD, Radwan E, Su XG (2009) Exploring precrash maneuvers using classification trees and random forests. Accid Anal Prev 41:98–107
24. Dai B, Chen RC, Zhu SZ, Zhang WW (2018) Using random for-est algorithm for breast cancer diagnosis. In: 2018 international symposium on computer, consumer and control (IS3C), IEEE
Publisher’s Note Springer Nature remains neutral with regard to jurisdictional claims in published maps and institutional affiliations.