© 2017, IRJET | Impact Factor value: 6.171 | ISO 9001:2008 Certified Journal
| Page 1101
SEISMIC ANALYSIS OF MULTISTORIED BUILDING FOR DIFFERENT
PLANS USING ETABS 2015
Pushkar Rathod
1, Rahul Chandrashekar
21
Undergraduate, Dept. of Civil Engineering, Datta Meghe College of Engineering, Airoli, Navi Mumbai, India.
2
Larsen & Toubro Limited, Buildings & Factories, Residential Buildings, EDRC, Mumbai 400093, India.
---***---Abstract
- Seismic analysis of any type of structure is an important consideration while working in high earthquake prone areas. With the help of seismic analysis, the structure can be designed and constructed to withstand the high lateral movement of earth’s crust during an earthquake. Any type of basic or a highly advanced structure which maybe under static or dynamic conditions can be evaluated by using ETABS. ETABS is a co-ordinated and productive tool for analysis and designs, which range from a simple 2D frames to modern high-rises which makes it one of the best structural software for building systems.Key Words:Seismic Analysis, ETABS, Storey Stiffness, Centre of Mass Displacement, Modal Analysis, Indian Code IS
456 (2000).
1. INTRODUCTION
The main aim is to generate and perform dynamic analysis of 4 different shapes of structure: Rectangular, T-Shaped, I-Shaped, L-Shaped and to compare their results for various types of forces, moments and displacements. It is expected that these structures will sustain all the loads and deformations of normal construction and have adequate durability and resistance to seismic effects.
Earthquake engineering has developed a lot since the early days. Due to emergence of earthquake prone areas, earthquake engineering is becoming one of the key aspects in the analysis and designing of any structure. It is part of the process of structural design, earthquake engineering or structural assessment and retrofit in regions where earthquakes are prevalent.
Structural analysis methods can be divided into the following five categories.
1. Equivalent static analysis
2. Response spectrum analysis
3. Linear dynamic analysis
4. Nonlinear static analysis
2. TYPES OF RCC FRAMES
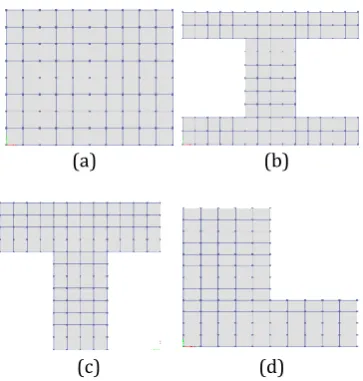
We have considered a 3D RCC frame with the dimensions for 4 different shapes. These shapes have same area. The 4 shapes are as follows:
1. Rectangular plan
2. I-shaped plan
3. T-shaped plan
© 2017, IRJET | Impact Factor value: 6.171 | ISO 9001:2008 Certified Journal
| Page 1102
(a) (b) [image:2.595.207.389.97.288.2](c) (d)
[image:2.595.121.472.345.585.2]Fig 1: Plan (a) Rectangular shaped (b) I-shaped (c) T- shaped (d) L-shaped of the building.
Table 1
Building Description And Material Specification
Number of storey 15
Support condition Fixed
Storey height 3m
Grade of concrete 30MPa
Grade of steel Fe415
Size of column(floor 1-5) 650mm X 650mm
Size of column(floor 6-15) 500mm X 500mm
Size of beam 450mm X 300mm
Thickness of main wall 230mm
Density of concrete 25KN/m3
Density of brick walls consider 20KN/m3
3. LOADING
The structures are acted upon by different loads such as dead load, live load, earthquake load.
1. Self-weight of structure comprises of weight of the beam, column and slab of the structure.
2. Dead load of the structure consists of wall load, parapet wall load and floor load according to IS 875 – part 1.
I. Wall load: weight unit of brick masonry * thickness of wall * height of wall = 20kN/m3 * 0.23m * 3m =
13.8kN/m3.
II. Wall load (parapet wall at top floor): weight unit of brick masonry * thickness of wall * height of wall =
20kN/m3 * 0.115m * 0.9m = 2.07KN/m.
3. Live load: It consists of floor load which is taken as 4KN/m2 and roof load as 2kN/m2 according to IS 875 part 2.
4. Seismic load: The different seismic parameters are taken as follows, IS 1893 part 1 : 2002
© 2017, IRJET | Impact Factor value: 6.171 | ISO 9001:2008 Certified Journal
| Page 1103
2. Soil type : II
3. Importance factor : 1
4. Response reduction factor : 5
5. Dumping : 5%
4. RESULTS & DISCUSSION
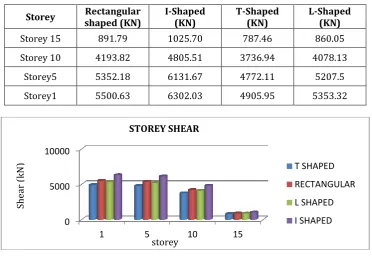
1. Storey Shear: It is defined as the ratio of storey shear force when storey collapse occurs to the storey shear force
[image:3.595.112.485.239.497.2]when total collapse occurs. Comparison of storey shear for 1st, 5th, 10th & 15th storey are given below.
Table 2
Storey shaped (KN) Rectangular I-Shaped (KN) T-Shaped (KN) L-Shaped (KN)
Storey 15 891.79 1025.70 787.46 860.05
Storey 10 4193.82 4805.51 3736.94 4078.13
Storey5 5352.18 6131.67 4772.11 5207.5
Storey1 5500.63 6302.03 4905.95 5353.32
Chart 1: Storey Shear
If we compare the values of 15th floor, storey shear decreases with increase in storey height which is 12% less in T-shaped
structure and 15% more in I-shaped when compared to rectangular shaped structure.
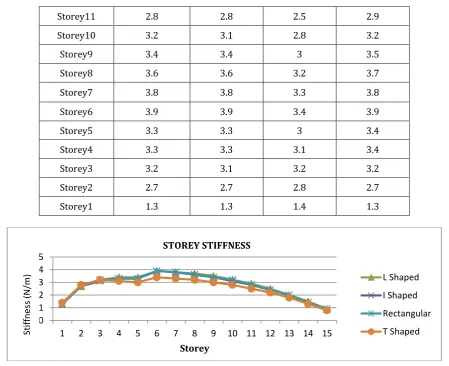
2. Storey Stiffness: The storey stiffness of a storey is generally defined as ratio of storey shear to storey drift. Storey stiffness of a storey is not a stationary property but an apparent one that depends on the lateral load distribution. In the analysis of frame building subjected to wind or earthquake loads, it is generally assumed that lateral loads are distributed in a ‘regular’ manner. Regular means that loads act in same direction on all floors and that lateral loads vary from floor to floor in a controlled manner.
Table 3
Storey shaped (N/m) Rectangular I-Shaped (N/m) T-Shaped (N/m) L-Shaped (N/m)
Storey15 0.9 0.9 0.8 0.9
Storey14 1.4 1.4 1.3 1.5
Storey13 2 2 1.8 2
Storey12 2.4 2.4 2.2 2.5
0 5000 10000
1 5 10 15
STOREY SHEAR
T SHAPED
RECTANGULAR
L SHAPED
I SHAPED
storey
She
ar
(
kN
[image:3.595.60.560.651.780.2]© 2017, IRJET | Impact Factor value: 6.171 | ISO 9001:2008 Certified Journal
| Page 1104
Storey11 2.8 2.8 2.5 2.9
Storey10 3.2 3.1 2.8 3.2
Storey9 3.4 3.4 3 3.5
Storey8 3.6 3.6 3.2 3.7
Storey7 3.8 3.8 3.3 3.8
Storey6 3.9 3.9 3.4 3.9
Storey5 3.3 3.3 3 3.4
Storey4 3.3 3.3 3.1 3.4
Storey3 3.2 3.1 3.2 3.2
Storey2 2.7 2.7 2.8 2.7
Storey1 1.3 1.3 1.4 1.3
Chart 2: Storey Stiffness
Storey stiffness for T-shaped structure is les as compared to all other shapes. Other three almost show similar results. T- shaped is 9% less then rectangular shaped.
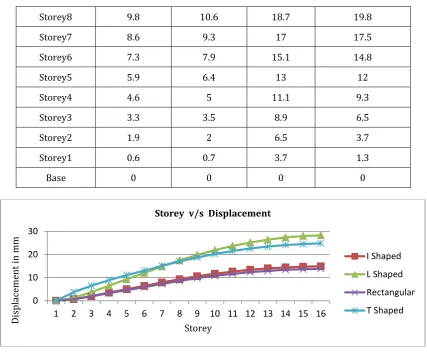
[image:4.595.73.523.94.460.2]3. Joint Displacement: It is the displacement of joints in a structure due to application of wind or seismic loads. This displacement is measured in ‘mm’.
Table 4
Storey Shaped (mm) Rectangular I-Shaped (mm) T-Shaped (mm) L-Shaped (mm)
Storey15 13.8 14.9 24.8 28.3
Storey14 13.6 14.7 24.5 28
Storey13 13.4 14.4 24.1 27.4
Storey12 12.9 14 23.4 26.4
Storey11 12.4 13.4 22.6 25.2
Storey10 11.6 12.6 21.5 23.7
Storey9 10.8 11.7 20.2 21.9
0 1 2 3 4 5
1 2 3 4 5 6 7 8 9 10 11 12 13 14 15
Storey
STOREY STIFFNESS
L Shaped
I Shaped
Rectangular
T Shaped
Stif
fn
e
ss
(N
/m
© 2017, IRJET | Impact Factor value: 6.171 | ISO 9001:2008 Certified Journal
| Page 1105
Storey8 9.8 10.6 18.7 19.8
Storey7 8.6 9.3 17 17.5
Storey6 7.3 7.9 15.1 14.8
Storey5 5.9 6.4 13 12
Storey4 4.6 5 11.1 9.3
Storey3 3.3 3.5 8.9 6.5
Storey2 1.9 2 6.5 3.7
Storey1 0.6 0.7 3.7 1.3
Base 0 0 0 0
Chart 3: Joint Displacement
L-shaped structure is having value 105% greater than rectangular shaped structure.
[image:5.595.84.512.94.447.2]4. Centre of Mass Displacement: Centre of mass of the structure is displaced due to dynamic forces such as wind and earthquake. This displacement is known as Centre of Mass Displacement and it is measured in ‘mm’.
Table 5
Storey shaped (mm) Rectangular I-Shaped (mm) T-Shaped (mm) L-Shaped (mm)
Storey15 17.7 24.8 25.1 17
Storey14 17.5 24.4 24.9 16.8
Storey13 17.1 23.8 24.4 16.5
Storey12 16.6 23 23.8 15.9
Storey11 15.8 21.9 22.9 15.2
Storey10 14.9 20.5 21.8 14.3
Storey9 13.8 18.9 20.5 13.2
Storey8 12.5 17.1 19 12
Storey7 11 15 17.2 10.6
Storey6 9.4 12.8 15.3 9
0 10 20 30
1 2 3 4 5 6 7 8 9 10 11 12 13 14 15 16
Dis
pl
ac
eme
nt
in
mm
Storey
Storey v/s Displacement
I Shaped
L Shaped
Rectangular
© 2017, IRJET | Impact Factor value: 6.171 | ISO 9001:2008 Certified Journal
| Page 1106
Storey5 7.6 10.3 13.2 7.3
Storey4 5.9 7.9 11.2 5.7
Storey3 4.1 5.5 9 4
Storey2 2.4 3.1 6.6 2.3
Storey1 0.8 1.1 3.8 0.8
Chart 4: Centre of Mass Displacement
Centre of mass displacement is observed maximum in T-shaped structure. It is 43% greater than rectangular shaped structure, I shaped structure have intermediate values.
5. MODAL ANALYSIS
Modal analysis or mode superposition method is a linear dynamic response procedure which evaluates and superimposes free vibration mode shapes to characterize displacement patterns. Mode shapes describe the configuration into which a structure will naturally displace.
The mode shaped for 5th mode for (a) Rectangular shaped (b) T-shaped (c) I-shaped (d) L-shaped of the building are as
follows:
(a) Fig. 2
0 10 20 30
1 2 3 4 5 6 7 8 9 10 11 12 13 14 15
Ds
ipl
ac
eme
nt
in
mm
Storey
Storey v/s Displacement
T Shaped
Rectangular
L Shaped
© 2017, IRJET | Impact Factor value: 6.171 | ISO 9001:2008 Certified Journal
| Page 1107
(b) Fig. 3(c) Fig. 4
© 2017, IRJET | Impact Factor value: 6.171 | ISO 9001:2008 Certified Journal
| Page 1108
6. CONCLUSION
1. Storey shear inversely varies with respect to number of storeys.
2. Storey stiffness increases with increase in storey height. But this case is satisfied only till 6th storey level. The
value of shear stiffness is maximum for all the shape. But after 6th storey, the stiffness goes on decreasing.
3. Joint displacement is directly proportional to the storey levels or no of storey. The values are maximum for L-
shaped structure suggesting maximum deformation in that particular shape. It is lowest in rectangular shaped structure due to similarity of the structure.
4. Centre of mass displacement is directly proportional to number of storeys. It is observed that maximum value of
Centre of mass displacement is in T-shaped structure followed by I-shaped structure. L-shaped structure has the lowest value amongst the 4 shapes.
5. It is observed that asymmetrical plans undergo more deformation than symmetrical plans and therefore while
constructing a new structure in high seismic zone, it is most likely to construct a structure which is symmetric in shape so as to provide better stability.
REFERENCES
1. ETABS – 02 Introductory Tutorial Steel: Watch & Learn from YouTube published on 23rd April 2013.
2. Illustrated Design of Reinforced Concrete Buildings by Dr. V.L. Shah and S.R. Karve.
3. IS 1893-1 (2002): Criteria for Earthquake Resistant Design of Structure, Part 1: General Provisions and Buildings
[CED 39: Earthquake Engineering].
4. IS 456 (2000): Plain and Reinforced Concrete - Code of Practice [CED 2: Cement and Concrete]
5. Milind V. Mohod, “Effect of shaped and plan configuration on seismic response of structure,”International Journal
of Scientific & Technology Research, Volume 4, Issue on 09 September 2015.
6. Mohammed Rizwan Sultan, “Dynamic analysis of multi-storey building for different shapes,” International Journal
of Innovative Research in Advanced Engineering (IJIRAE), Volume 2, Issue on August 2015.