NUMERIC SIMULATION OF MOMENT OF STABILIZING
PILE UNDER THE LOCAL LIQUEFACTION BASED ON
FINITE ELEMENT METHOD
1
LI RONGJIAN, 2LIU JUNDING, 3YAN RUI
1
Assoc Prof., Institute of Geotechnical Engineering, Xi’an University of Technology, Xi’an, China
2
Postgraduate, Institute of Geotechnical Engineering, Xi’an University of Technology, Xi’an, China
3
Postgraduate, Institute of Geotechnical Engineering, Xi’an University of Technology, Xi’an, China
E-mail: [email protected], [email protected],[email protected]
ABSTRACT
The evaluation of liquefaction effect on the dynamic moment of stabilizing piles is potentially significant. Based on the dynamic centrifuge modeling of a slope reinforced with a row of copper model pile, this paper not only analyzed the response of dynamic pore pressure, earthquake deformation and macroscopic phenomenon measured in the response of the reinforced slope, but also simulated the response characteristics of dynamic bending moment of stabilizing pile under the condition of local foundation liquefaction by using the dynamic consolidation finite element. Through the comparison of model test and computation, the results show that the local liquefaction in the saturated foundation resulted in the large seismic deformation at slope toe and slope top, and this seismic deformation not only leads to increasing
sharply of the dynamic excess bending moment of stabilizing pile, but also makes the post-earthquake
residual moment much bigger than the static bending moment before earthquake. So the excess moment of
stabilizing pile in liquefiable soil caused by the saturated foundation liquefaction can’t be ignored.
Keywords: Numeric simulation, Finite element method, Dynamic centrifuge modelling, Liquefaction, Moment
1. INTRODUCTION
The foundation liquefaction caused by
earthquake often leads to the loss of bearing capacity of foundation, and endangers the safety of the slope on the liquefiable soil. Dynamic centrifuge model test is one of the effective means to evaluate the response of dynamic moment of stabilizing pile under the liquefaction.
Finn and et al pointed out that foundation liquefaction has an adverse effect on the stress of the pile, and must attach importance to consider the influence of liquefaction under the conditions of
liquefaction [1]. Satoh and et al carried out a
dynamic centrifuge model test by the steel model pile in reinforcement of slope, and researched the interaction of pile and the soil lateral slip induced
by the earthquake [2]. Abdoun and et alcarried out
adynamic centrifuge model test, and argued the effect of the horizontal foundation liquefaction on the dynamic response of the pile foundation [3]. Yu
Yuzhenand et al performed a dynamic centrifuge
modeling for a single aluminum alloy thin wall model pile in reinforcement of a dry sand slope,
studied the dynamic interaction between soil and the single pile [4].
In order to evaluate the effect of a row of piles,
Yu Yuzhen and et al studied the response and
distribution of the bending moment of copper model piles in a dry sand slope under the seismic load [5]. Subsequently, Li Rongjian and et al carried out a dynamic centrifuge modeling of the slope reinforced with piles on the saturated foundation, reveals the phenomena of dynamic
response of stabilizing pile [6], but the
corresponding response mechanism of the dynamic bending moment hasn’tbeen disclosed yet under the condition of local foundation liquefaction.
Based on the Biot’s dynamic consolidation
theory[7] and the advanced P-Z generalized plasticity model [8], through the developed elastic-plastic dynamic analysis software FEMEPDYN [9], this paper carried out the corresponding research on the seismic deformation caused by the local
foundation liquefaction and the increasing
ISSN: 1992-8645 www.jatit.org E-ISSN: 1817-3195 Section 2 presents the macroscopic phenomena
measured in the response of the reinforced piles by means of dynamic centrifuge test. In section 3, we simulated the response of dynamic bending moment of stabilizing pile under the condition of local foundation liquefaction by using the dynamic consolidation finite element. Section 4 draws a conclusion that the excess moment of stabilizing
pile in liquefiable soil can’t be ignored.
2. THE REINFORCED SLOPE MODEL IN DYNAMIC CENTRIFUGAL MODELLING TEST
In this test, the centrifugal acceleration is set to
50 g, and then the model scale is 1/ 50. The internal
dimensions of the model container are 480 mm in length, 200 mm in width and 350 mm in height. The reinforced slope model is placed in the solid wall container.
Slope soil employed the fine sand. The solid
grain density is 2.70 g/cm3. The minimum dry
densityis 1.14 g/cm3 and the maximum dry density
is 1.65 g/cm3. The slope model was prepared by
using the pluviationmethod. Dry density of sample
preparation of the sand is 1.38 g/cm3. In order to
solve the contradiction of the time similar scale relationship between inertia and seepage, the pore fluid employed silicone oil whose viscosity is 50 cs, and the viscosity is 50 times of the viscosity of water. By making use of the vacuum method, the designed underground water level was attained to
make the foundation reachthe saturated state in the
test.
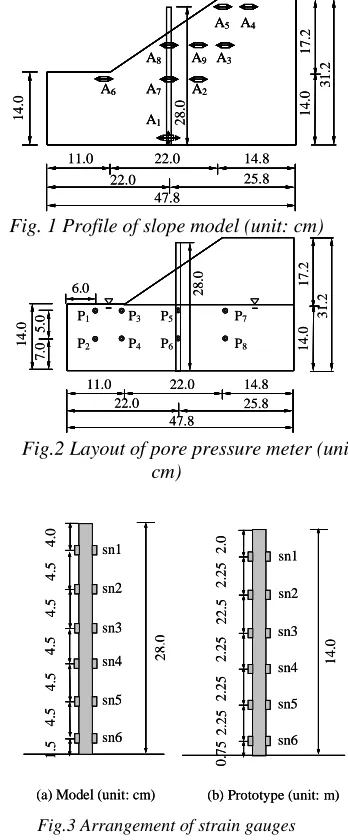
Slope model is 172 mm in height, 38° in inclination, and the thickness of foundation is 140 mm. Planted within the slope soil are nine micro accelerometers to record the seismic response history of different locations, and the geometric dimensions of the slope model and the arrangement
of accelerometers are shown in Fig.1. Planted
within the saturated foundation are eight micro porous pressure meters to record the response of the pore pressure at different locations. Due to the irregular of geometry shape of slope, the arrangement of the pore pressure meters were shown in Fig.2.
A row of stabilizing model piles which were made from copper are installed in the middle of slope with the piles’ spacing of 25 mm. The model pile’s cross section is a square with side lengths of 10 mm, and the model pile’s length is 280 mm. Pile bottom is fixed at the container bottom to simulate the pile’s embedded rock. The strain gauges were
pasted on the outside of the model pile in left-and-right symmetrical arrangement, and Fig.3 is the layout of the strain gauges in model piles and prototype piles. The peak of input seismic wave is
0.159g (Fig.4).
A1
A3
A2 A5 A4
A6 A7
A8 A9
47.8
11.0 22.0 14.8
14. 0 31. 2 17. 2 14. 0 22.0 25.8 28. 0 A1 A3 A2 A5 A4
A6 A7
A8 A9
A1
A3
A2 A5 A4
A6 A7
A8 A9
47.8
11.0 22.0 14.8
[image:2.612.338.512.171.591.2]14. 0 31. 2 17. 2 14. 0 22.0 25.8 28. 0
Fig. 1 Profile of slope model (unit: cm)
P1 P2 P3 P4 P5 P6 P7 P8 47.8
11.0 22.0 14.8
6.0 5. 0 7. 0 14. 0 31. 2 17. 2 14. 0 22.0 25.8 28. 0 P1 P2 P3 P4 P5 P6 P7 P8 47.8
11.0 22.0 14.8
6.0 5. 0 7. 0 14. 0 31. 2 17. 2 14. 0 22.0 25.8 28. 0
Fig.2 Layout of pore pressure meter (unit: cm)
28. 0 1 .5 4 .0 4 .5 4 .5 4 .5 4 .5 sn1 sn2 sn3 sn4 sn5 4 .5 sn6
(a) Model (unit: cm)
28. 0 1 .5 4 .0 4 .5 4 .5 4 .5 4 .5 sn1 sn2 sn3 sn4 sn5 4 .5 sn6
(a) Model (unit: cm)
0. 75 2 .0 22. 5 2. 25 2. 25 2. 25 sn1 sn2 sn3 sn4 sn5 2. 25 sn6
(b) Prototype (unit: m)
14. 0 0. 75 2 .0 22. 5 2. 25 2. 25 2. 25 sn1 sn2 sn3 sn4 sn5 2. 25 sn6
(b) Prototype (unit: m)
14.
0
Fig.3 Arrangement of strain gauges
-0.2 0 0.2
0 10 20 30 40 50
t/s
a
/
g
Fig.4 Input seismic wave
about 1.8 cm. Due to the soil’s vibratory compaction and local foundation liquefaction, the water level in the top of the foundation rises to some extend.
Eight porous pressure meters within the saturated foundation recorded the dynamic response of the pore water pressure of the saturated foundation in different locations. As a result of volume shrinkage effect in the saturated loose sand, excess pore water pressure obviously increases during the earthquake, and the excess pore water pressure gradually disappears after the earthquake, eventually recovers to the pore pressure before the earthquake.
Shown in Table 1 are the peaks of the excess
pore water pressure in the saturated foundation (P1,
P2), and in the foundation near the slope toe (P3
and P4), in the foundation under the middle slope
(P5, P6) and in the foundationunder the slope crest
(P7, P8), the pore pressure peak are 9.87 kPa, 35.3
[image:3.612.355.512.375.675.2]kPa, 9.70 kPa, 32.4 kPa, 49.3 kPa, 44.0 kPa, 59.7 kPa, and 54.3 kPa. It shows that the excess pore water pressure of the saturated foundation increases significantly, but the increment is different in different foundation parts of slope under the earthquake.
Table 1 Excess Pore Pressure (EPP) and Liquefaction
PPM Peak of EPP
(kPa)
Ratio of EPP Liquefaction
P1 9.87 1.0 Yes
P2 35.3 1.0 Yes
P3 9.70 1.0 Yes
P4 32.4 1.0 Yes
P5 49.3 0.78 No
P6 44.0 0.52 No
P7 59.7 0.51 No
P8 54.3 0.40 No
To explore the developing process of the liquefaction region, according to estimating the pre-earthquake vertical effective normal stress of the saturated foundation and the peaks of the excess pore pressure of the measured points, after deducting the effect of some soil weight into the pore water pressure meter due to the accumulation of soil near slope toe, the excess pore pressure ratio
of all measured points can be determined through
the calculation (Table 1). Effective stress in the right side of the slope is larger, and therefore the excess pore pressure ratio is much smaller than 1.0
(no liquefaction). However, the excess pore pressure ratio in foundation nearby the toe of slope reaches 1.0, indicates that there is obvious liquefaction in sands nearby the slope toe.
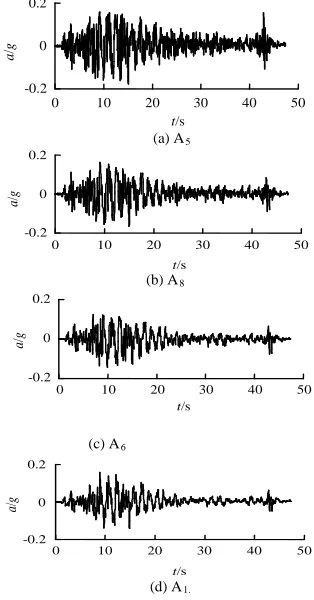
The accelerometers recorded the seismic response curve in the different position (Fig.5). In
the bottom (A1) of foundation, in the slope toe
(A6), in the middle of the slope (A8), in the position
close to pile (A9) and slope top (A5), the peak
acceleration respectively is 0.159g, 0.145g, 0.164g,
0.150g and 0.177g. Along the elevation increasing,
the amplification of acceleration response in the slope is not obvious, and the response peak in horizontal foundation is smaller than that of input wave, while the seismic response peak in the upper slope enlarges slightly, but not obviously. These phenomenon indicates that the dynamic pore water pressure in the saturated foundation leads to local foundation liquefaction, and makes the increase of soil damping, but all these restrain the upward propagation of the shear wave and result in the slight amplification of acceleration response in the upper slope.
a
/
g
t/s
-0.2 0 0.2
0 10 20 30 40 50
(a) A5
t/s
-0.2 0 0.2
0 10 20 30 40 50
a
/
g
(b) A8
-0.2 0 0.2
0 10 20 30 40 50
t/s
a
/
g
(c) A6
-0.2 0 0.2
0 10 20 30 40 50
t/s
a
/
g
(d) A1.
Fig.5 Seismic acceleration response curve
ISSN: 1992-8645 www.jatit.org E-ISSN: 1817-3195 moment and flexural stiffness, the strain time
history can be converted into the time history curve of the total bending moment (sm1-sm6) in the corresponding location of the prototype stabilizing pile. To observe the changes of the bending moment of the pile, this article seeks the static and dynamic moment according to time history curve at 0.0s (t1), 9.0s (t2), 12.6s (t3), 20.0s (t4) and 45.0s (t5) points of time, and draws the distribution of the bending moment along the elevation from t1 point of time to t5 point of time, as shown in Fig.6.
0 2 4 6 8 10 12
0.0 1.0 2.0
M/MN•m
H
/
m
[image:4.612.147.247.240.391.2]t1=0.00s t2=9.00s t3=12.6s t4=20.0s t5=45.0s
Fig.6 Distribution of Moment of Stabilizing Piles
The distribution characteristics of moment of stabilizing pile are that the moment of pile top is zero, and the total moment increases gradually from top to bottom. The pre-earthquake static bending moment near the pile bottom is 974 kN·m, and the total moment near the pile bottom caused by the earthquake is 1,820 kN·m, so the dynamic excess bending moment caused by the earthquake is 846 kN·m, which is equivalent to 86.9% of the pre-earthquake static moment, and indicates the excess
moment caused by foundation liquefaction can’t be
ignored. After earthquake, because the residual deformation in the slope is large, the stabilizing piles eventually bear the residual moment (1550 kN·m) near the pile bottom. The seismic moment although somewhat falls after the excitation of earthquake, but the residual moment is still far greater than the static moment before earthquake, the dynamic excess residual moment is 576 kN·m, which is equivalent to 59.1% of pre-earthquake static moment.
3. NUMERIC SIMULATION BASED ON FINITE ELEMENT METHOD
The model of Pastor-Zienkiewicz IIIbelongs to
the elasto-plastic constitutive model, which can simulate the vibration compaction characteristics of
loose sand and the liquefaction characteristics in the saturated sand under cyclic loading. So it has obvious superiority to simulate the earthquake liquefaction, and can calculate the permanent deformation.Therefore it is one of the very practical constitutive models in the analysis of the deformation characteristics of soil and geotechnical dynamic computation.
In this paper, based on the derivationof dynamic
consolidation and Pastor-Zienkiewicz III model, the elastic-plastic dynamic analysis software FEMEPDYN is developed, which can be used to calculate the generation and dissipation of pore pressure during earthquake.
[image:4.612.339.502.353.534.2]The copper model pile employed the linear elastic constitutive model, in which the elastic modulus is 100 GPa and the Poisson ratio is 0.167. The corresponding Pastor-Zienkiewicz III model parameters of fine sand are shown in table 2.
Table 2 Parameters of Pastor-Zienkiewicz III of Sand
Parameter Value Unit
Mfc 0.95 -
Mgc 1.5 -
af ag 0.45 -
Kevo 7440 (kPa)
Keso 14150 (kPa)
β0 1.0
-
β1 0.1
-
H0 700
-
Hu0 1000 (kPa)
γ 15 -
γu 20 -
p0 100 (kPa)
Fig.7 Prototype Slope (Unit: m)
Fig.8 Three-dimensional Finite Element Meshes
Boundary conditions of displacement: (1) the bottom is a fixed boundary; (2) the remote lateral boundary is fixed; (3) the normal displacement of the remaining two sides is zero.
Boundary conditions of pore pressure: (1) the pore pressure of the node of the groundwater level is zero; (2) the bottom boundaries are impermeable boundaries; (3) the four sides are impermeable boundaries.
Input seismic waves work in the slope direction for vibration. The seismic waves of the numerical calculation are still using input seismic waves in the test (Fig.4).
Fig.9 shows the comparison between the calculation results and the test results of the excess pore pressure time history of typical points of the slope.
P1-cal
0 4 8 12
0 10 20 30 40 50
t/s
p
/k
P
a
P1-exp
0 4 8 12
0 10 20 30 40 50
t/s
p
/k
P
a
(a) P1 P2-cal
0 10 20 30 40
0 10 20 30 40 50
t/s
p
/k
P
a
P2-exp
0 10 20 30 40
0 10 20 30 40 50
t/s
p
/k
P
a
(b)P2 P3-cal
0 10 20
0 10 20 30 40 50
t/s
p
/k
P
a
P3-exp
0 10 20
0 10 20 30 40 50
t/s
p
/k
P
a
(c) P3
P4-cal
0 10 20 30 40
0 10 20 30 40 50
t/s
p
/k
P
a
P4-exp
0 10 20 30 40
0 10 20 30 40 50
t/s
p
/k
P
a
(d) P4
Fig.9 Comparison with excess pore pressure between test and computation
Computational results are in good agreement with the time history of the excess pore pressure of model tests on the overall trend. The computational peak is slightly smaller. Experimental values have a certain amount of noise wave. The values of residual pore pressure are close tolater stage of earthquake.
Compared the computational results with experimental results of excess pore pressure of typical parts in prototype slope, we can see that the numerical results tend to be close to the experimental results, but the numerical simulation of pore pressure slowly grows during earthquake.
During the seismic action, the excess pore pressure of the saturated foundation increases significantly. The excess pore pressure in the initial stage of earthquake increases sharply and is close to the peak quickly. The excess pore pressure gradually dissipates for a longer period of time after earthquake.
Fig.10 shows the distribution of the excess pore pressure at 45s during earthquake. It shows that the excess pore pressures of the saturated foundation near the slope toe and the stabilizing pile are larger. Compared to the pre-earthquake effective stress, it can reach a conclusion that there’s a certain liquefaction area nearby the toe of the slope, which is bound to have a great impact on the moment response of the stabilizing pile.
5 15
10
15 20 25
35 25
25 30
20 15
10
5 15
10
15 20 25
35 25
25 30
20 15
10
Fig.10 Contour of excess pore pressure at 45 second in earthquake (unit: kPa)
Fig.11 shows the distribution of the horizontal displacement of the prototype slope at later stage of earthquake. From the Fig.11 we know that the sand liquefaction near the slope toe leads to the large deformation of slope soil in front side of the stabilizing pile. Seen from the distribution of deformation in the prototype slope, the large horizontal displacement at slope’s toe and slope’s
14.
0
49.5 88.0
7.
0
33.0 11.0 44.0
7.
0
15.
6
8.
6
Sand 1
ISSN: 1992-8645 www.jatit.org E-ISSN: 1817-3195 top caused by the accumulation of the excess pore
water pressure in the saturated foundation and the local foundation liquefaction indicates that the local foundation liquefaction near slope toe impact largely on the deformation of slope.
The horizontal displacement of the soil at the lower part of slope is about 0.2 m. The deformation results in the trend of soil separating from the stabilizing pile at lower part of slope, leading to reducing the active earth pressure in front side of stabilizing pile. The horizontal displacement of the seismic deformation at slope top is about 0.23 m. Soils at the upper part of the slope squeeze the pile due to the soil deformation trend at slope top, resulting in the increase of the passive earth pressure at the back side of the stabilizing pile. At the same time, the seismic displacement will have a significant motion interaction between pile and soil, and should make the moment of piles increasing.
-0.04 -0.1
-0.04 -0.12
-0.06
Fig.11 Contour of Horizontal Displacement at 45 second in earthquake (unit: m)
The dynamic finite element calculation not only verifies the results of the macroscopic deformation of the measured points in the dynamic centrifuge modeling test, but also effectively overcomes the shortcomings of the limited number of testing points. The computational results could give the distribution of the slope displacement and at the same time illustrate that there’s the significant liquefaction at saturated foundation according to the distribution of the local large deformation.
Fig.12 gave the comparison of the total moment between the computation and the experiment nearby the pile’s bottom. In the experiment, the static moment is 974 kN·m before earthquake, the peak value of the static and dynamic moment is 1820 kN·m, the dynamic excess moment is 846 kN·m and the relative amplification of the dynamic excess moment is 86.9% of the static moment. The dynamic residual moment is 527 kN·m and the relative amplification of the dynamic residual moment is 59.1% of the static moment. In the computation, the static moment is 911 kN·m before earthquake and the peak value of static and dynamic moment is 2160 kN·m, so the dynamic excess moment is 1249 kN·m, and the relative amplification of dynamic excess moment is 137%.
The post-earthquake residual moment is 1512 kN·m, so the excess residual moment is 601 kN·m, and the relative amplification of excess residual moment is 65.9%. Except that the dynamic excess moments near slope bottom have some slight difference between computation and experiment, the other indexes of computational results and the experimental results are close to each other.
0 500 1000 1500 2000 2500
0 10 20 30 40 50
t/s
M
/k
N
•
m
sm6-cal.
(a) the moment curve in numeric simulation
sm6-exp.
0 500 1000 1500 2000 2500
0 10 20 30 40 50
t/s
M
/k
N
•
m
(b) the moment curve in test
Fig.12 In comparison with moment near pile’s bottom between test and computation
Through the analyses of distribution of the pore pressure, the seismic deformation and the total static and dynamic moment of stabilizing pile, we can come to a conclusion about the dynamic response mechanism of stabilizing pile under the local foundation liquefaction. The constraint effect of soil around the piles gets weakened due to the accumulation of the excess pore pressure and the decreasing of effective stress. The local foundation liquefaction leads to the large seismic deformation at slope toe and slope top, which leads to that the relative amplification of the dynamic excess moment increases sharply, showing the obvious characteristics of the pile-soil motion interaction.
4. CONCLUSIONS
be able to explain the seismic mechanism of the observed macroscopic response phenomenon of the model test.
(1) Along excitation of seismic wave, liquefaction of some local foundation restrains the amplification reaction of seismic acceleration, and the seismic response peak in the top of foundation is smaller than the peak of input wave, while the seismic response peak in the slope crest enlarged slightly, but not obviously.
(2) The accumulation of pore water pressure in saturated foundation leads to the local foundation liquefaction in front of slope. The extending zone of liquefaction in saturated foundation near the slope’s toe leads to the large displacement at the toe and top of slope, indicating that the local foundation liquefaction nearby the slope’s toe has a great impact on the moment response of the stabilizing pile.
(3) While the liquefaction zone is gradually extending, the moment of pile correspondingly increases to the peak. In the experiment the dynamic excess moment is equivalent to 86.9% of the static moment, while the dynamic excess moment is equivalent to 137% of the static moment in the calculation. As the pore pressure dissipates, the moment decreases and keeps the stable state eventually.
(4) The relative amplification of the excess residual moment is 59.1% in the test, while the relative amplification of the excess residual moment is 65.9% in the computation. The analysis results of the residual moment show that the post-earthquake residual moment is still much bigger than the static moment before earthquake.
ACKNOWLEDGMENTS
This work was supported by the National Natural Science Foundation of China (11072193), China Postdoctoral Science Foundation funded project (20100481354) and Scientific Research Program
Funded by Shaanxi Provincial Education
Department (Program No.12JK0907).
REFRENCES:
[1] W.D.L.Finn, N.Fujita. “Piles in liquefiable
soils: seismic analysis and design issues”, Soil
Dynamics and Earthquake Engineering,
vol.22, 2002 , pp.731-742.
[2] Satoh H., Ohbo N., Yoshizako, K. “Dynamic
test on behavior of pile during lateral ground
flow”. Kimura, Kusakabe, Takemura, eds.
Centrifuge 98. Rotterdam: A. A. Balkema, 1998, pp. 327-332.
[3] Abdoun T, Dobry R. “Pile response to lateral
spreads: centrifuge modeling”, Journal of
Geotechnical and Geoenvironmental engineering, 2003, vol.129, No.10, pp.869-878.
[4] YU Yuzhen, DENG Lijun. “Centrifuge
modeling of seismic behavior of slope
reinforced by stabilizing pile”, Chinese Journal
of Geotechnical Engineering, Vol.29, 2007, pp.1320-1323.
[5] LI Rongjian, YU Yuzhen, CHAI Lin, LI
Guangxin. “Experimental study on dynamic-elastic response of model concrete stabilizing
pries during earthquake”, Water Resources and
Hydropower Engineering, vol.39, No.5, 2008 , pp.66-69.
[6] LI Rongjian, YU Yuzhen , Lv He, LI
Guangxin. “Dynamic centrifuge modeling of piles-reinforced slope on saturated sandy
foundation”, Rock and Soil Mechanics, vol.30,
No.4, 2009, pp.897-902.
[7] Zienkiewicz O C, Shiomi T. “Dynamic
behavior of saturated porous media: the generalized Biot formulation and its numerical
solution”, International Journal for Numerical
and Analytical Methods in Geomechanics, vol.8, No.1, 1984, pp.71-96.
[8] Pastor M, Zienkiewicz O C, Chan A H C.
“Generalized plasticity and the modeling of
soil behavior”, International Journal for
Numerical and Analytical Methods in Geomechanics, vol.14 , No.3, 1990, pp.151-190.
[9] LI Rongjian, YU Yuzhen, LI Guangxin, SHAO
Sheng-jun. “An Analysis of Dynamic Coupled Consolidation of Slope on Liquefiable Soil”.