THE ACQUISITION OF LAND COVER INFORMATION
USING THREE INDEXES AND LANDSAT-TM IMAGE
1 SHIWEI LI, 2 ZHAOBA WANG, 3 JASON YANG
1Lecture, School of Information and Communication Engineering, North University of China, Taiyuan,
030051, China
2 Prof., School of Information and Communication Engineering, North University of China, Taiyuan,
030051, China
3. Assoc. Prof., Department of Geography Ball State University Muncie, IN 47036, USA
E-mail: [email protected], [email protected]
ABSTRACT
To get land cover information of study city area, and according to the spectral feather of the wanted classes including water, vegetation, impervious surface, and soil at LANDSAT-TM remote sensing image, we used a method that using three indexes including normalized difference vegetation index, modify normalized difference water index, and ratio impervious surface index to extract the thematic information separately. Firstly, we use the indexes to calculate the image. Then, we choose threshold for the three thematic layers and did binarization for them too. In this step, we defined RISI according to the spectral feature and found the RISI cannot extract the impervious surface correctly, water information was also extracted. So, we calculated the RISI first, and then, used it to subtract MNDWI to get the impervious surface information and, a better result was gotten. Finally, we stack the three layers together and gave them the false color and, cause soil had very low value in all three indexes layers, the map including water, vegetation, impervious surface and soil was gotten together in one image, and it is effective to get them just by color difference. With taking the high resolution image as reference, the totally accuracy it can get was 91.3%, and the KAPPA was 0.892.
Keywords: Normalized Difference Vegetation Index (NDVI), Modify Normalized Difference Water Index
(MNDWI), Ratio Impervious Surface Index (RISI), Taiyuan, Shanxi, Landsat
1. INTRODUCTION
In order to extract land cover information, many methods are developed to get it using remote sensing image. Among these methods, the most effective one is to use normalized difference indexes, they according to the spectral feature of land object and made calculation of remote sensing image bands, after that, it can enlarge the difference between the thematic information and other land cover information, and made the interested information can get higher digital number in the result image. So far, many indexes such as NDVI (Rouse, 1973), NDWI (Mcifeeters, 1996), MNDWI (Hanqiu Xu, 2005), NDISI (Hanqiu Xu, 2008), [1-4] and so on have been developed and wide applied in remote sensing. Because one index just can reflect one kind of land cover information not all of kinds land information, so, we tried to combine three indexes to get three kinds of land information. After stacking them we gave them false color to test if we can get four types land cover information
including water, vegetation, soil and impervious surface in one image.
2. STUDY AREA AND DATA
The process of In order to test the method we proposed, we choose Taiyuan Shanxi province, China city as study area. The reason is we live in this city so that we can check the result conveniently.Taiyuan is located between the west of Taihang Mountain and east of Luliang Mountain in northern China. It has four distinct seasons, the weather is dry and cold in winter and, air temperature warms up quickly in spring; The yearly average temperature in this area is between 7.6℃ and 10.2℃, the frost-free period lasts 163 days to 184 days per year, and the mean annual precipitation is between 420 to 460 millimeters, which can meet the basic crop growth need.
not in the sowing time, so, the cultivated land was full of soil. Since the downloaded data was a level 1 product and, geometric correction should be performed. After selecting 40 GCPs randomly in original image and, a corrected high resolution image, we used polynomial transform model to eliminate the geometric deformation of the original image. Finally, we used the administrative boundaries of the study area in geographical information to get an AOI and, the image was obtained after AOI cutting (RGB = 432) as Figure 1 shows.
(a) (b)
[image:2.612.112.287.236.440.2](c)
Figure 1 The location of Taiyuan city and its LANDSAT-TM Image
A high resolution image w obtained in April 2011 as used in our work as reference data in our work, which is showed in Figure 1 (c).
3. METHODS
For dealing with the image using the method we proposed, firstly, we transformed image Digital Number (DN) to reflectance, then used following equations to calculate three image indexes including NDVI, MNDWI, and RISI to get the grey value layers. Secondly, we used the high resolution image as reference to check the result the three indexes and, then adjust the indexes according the spectral feather of the object we want to get. Thirdly, with the layers we got, we found an appropriate threshold to make a decision in classification. Finally, we chose 100 point in the result image randomly, to compared with the same position in the high resolution image to assess the classification accuracy.
4. WORK PROCESS
1) Reflectance inversion
Because the TM image uses DN to show the grey value, for more rigorously, it should be changed to reflectance to make the image comfort to the reality. The inversion process is as below:
a) Transform DN to radiation value with expression (1),
Radiation =DN * gain +bias (1)
[image:2.612.305.539.254.392.2]Where DN is the digital number in the original image, gain and bias are the constant which can be gotten in the USGS TM user’s manual as showed in Table 1.
Table 1 Values of gains and biases of TM after May fourth, 2003
Band 1 2 3 4 5 6 7
Gain 0.72 68
1.44 25
1.03 99
0.87 26
0.11 99
0.05 51
0..0 653
Bias -1.52
-2.84
-1.17
-1.51
-0.37
1.23 78
-0.15
b) Calculation of reflectance
ρ=π×D2×L / (ESUNI×COS (SZ)) (2)
where ρ is the reflectance of the image, D is the astronomical units distance, and commonly, its value was 1. L is the radiation value calculated by expression (1). ESUNI is the Solar Exoatmospheric Spectral Irradiances. SZ is the solar zenith angle. To get the SZ, we can use the expression below:
SZ = 90° - SUN ELEVATION (3)
where SUN ELEVATION can be found in the header file of TM image, it is 57° in the image header file we used. IESUNI of every bands of TM image can be obtained from USGS website, as they were shown in Table 2.
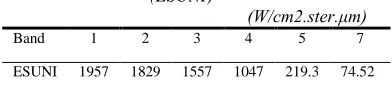
Table 2 Solar Exoatmospheric Spectral Irradiances (ESUNI)
(W/cm2.ster.μm) Band 1 2 3 4 5 7
ESUNI 1957 1829 1557 1047 219.3 74.52
[image:2.612.323.519.570.615.2]Figure 2 Reflectance Image
2) Index Calculation
(1) NDVI
NDVI is developed specifically for vegetation information extraction with expression in the following form:
NDVI = (ρNIR - ρRed)/ (ρNIR+ ρRed) (3)
Where ρNIR is pixel's reflectance in near infrared
band; ρRed is pixel's reflectance in red band.
According to the parameter of LANDSAT-TM, the expression can be changed to formula 4 :
NDVI = (ρBand 4 –ρBand 3) / (ρBand 4+ ρBand 3) (4)
Through using the NDVI calculation, the obtained value of NDVI obtained is between-1 and +1. According to Fig.2, it also can be found that the vegetation's gray scale difference is positive between near infrared and red band, close to zero for the cultivated land, and negative for the non-vegetation area.
To easy the reading of the image, NDVI values can be transformed to gray value range from 0 to 255. The formula of transformation is as follows, where DN is pixel's gray value in new layer, NDVImin is the NDVI minimum value of all pixels,
and NDVImax is the NDVI maximum value of all
pixels.
DN= (NDVI – NDVI max) / (NDVI max - NDVI
min) * 255 (5)
With the operation expressed by Equation (4) and (5), the difference between non- vegetation area and vegetation area is larger than that shown in original image. The processing result is shown in Figure 3(a). According to the image, we can get that the vegetation covering ratio is very low in the city at April, 2011.
(2) MNDWI
MNDWI was proposed by Xu Hanqiu (2005), it was an effective index to extract water information from remote sensing image, and its expression is as below.
MNDWI = (Green - MIR) / (Green + MIR) (6)
where Green was band 2 of LANDSAT-TM, and MIR was the band 5 of LANDSAT-TM. As we did in NDVI calculation, we did spectral equalization to transform MNDWI value to gray value range from 0 to 255, water information had high grey value and the result image was shown in Figure 3 (b).
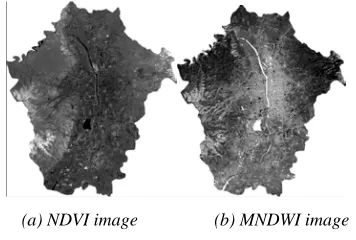
(a) NDVI image (b) MNDWI image
Figure 3 NDVI Image and MNDWI Image
(3) RISI
So far, many methods to extract impervious surface (IS) in remote sensing image were based on VIS model (1995), which proposed by Ridd[4]. Because these methods did not take the water information into consideration, it must did water information reduction and, bring about error [5-8]. To solve this problem, Xu Hanqiu proposed NDISI (2008), he used this index at ASTER and ETM+ remote sensing image to extract IS information and got a better result. But when we used it in LANDSAT-TM, the result was not good, some IS even had lower DN than water, therefore, if we want to extract IS information. It is needed to find a new method. Take these indexes were according to the spectral feature in to consideration, we analyzed the spectral feather of IS again, as shown in Figure 4, we found that IS’s reflectance in Red band was lager that it in Green band, water also had the feature but soil and vegetation did not. Plus, IS in band 5 was also larger than it in band 6 and, but water, soil and vegetation did not. Furthermore, the difference between band 3 and band 4 of IS was larger than water’s. And, took that band 6 had different resolutions with other bands into consideration, we extracted IS information by steps below.
Firstly, we used RISI which was calculated in the following expression:
RISI = Red / NIR (7)
The result was shown in Figure 5.
[image:4.612.339.513.382.496.2]Fig. 4 Spectral feature
Fig. 5 RISI Result Image
Secondly, after the calculation, all of the IS can have considerable value as water did, we chose a threshold can extract water and IS together and, got a binary image too and, transformed RISI image’s value to gray value range from 0 to 255, the result was shown in Figure 7(a).
Finally, according to water’s value and IS’s value in MNDWI, we gave a threshold to MNDWI to get a binary image and transformed the image’s value to gray value range from 0 to 255, we used IS binary image subtract MNDWI binary image to get the impervious surface. The resulted image was as figure 7(b) shows.
The reason we did this was that, after MNDWI being binary, it shows the water information more correct, and the binary image of RISI can show water and IS information together more corrected too. So, after did subtraction with them, the IS result can have more accuracy in showing IS information.
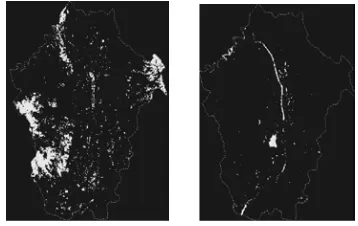
(a) NDVI (b) MNDWI Fig. 6 Threshold Image of NDVI and MNDWI
3) Threshold selection
To get the higher accuracy, we took the high resolution image as reference to check the three thematic information results. After compared the results with the high resolution image many times, we defined 155 as the NDVI threshold and did binaryzation to the image. The resulted image is showed in Figure 6(a).
Then, we used the same method to define 170 as MNDWI threshold and did binarization, its resulted image was shown in Figure 6(b).
As Figure 5 shows, when we chose the threshold 240 according to the high resolution image, almost all of the impervious surface and area showed high grey value, and took IS area had low value, and water area had high value in MNDWI layer into consideration, so we used RISI binary layer to subtract MNDWI binary layer to get impervious surface area. After compared with high resolution image many times, 39 was defined to be the threshold IS layer, and the result image was shown in Figure 7(b), as we can see, the water area was reduced obviously.
(a) RISI (b) IS
Fig. 7 Threshold Image of RISI and Impervious Surface
Fig. 8 Classification Rsult
[image:4.612.359.494.527.656.2] [image:4.612.101.280.588.701.2]their own layer, so, the four classes of earth object can distinguish after giving false color to the three thematic layers, the result was shown in Figure 8.
To get the final accuracy, we use Accuracy Assessment command of ERDAS Imagine software to generate 200 sampling points in the original image randomly, and then, to find the same position on the high resolution image according to the latitude and longitude of every sampling point on the original image. After that we get the classifying result at last, the overall accuracy is 91.3%, and the KAPPA is 0.892. As we found, the error was occurred in land object mixing area. If the more accuracy result needed, Mix Element Decomposing maybe taken into consideration.
5. CONCLUSION
With using three types of indexes, we got the classification result including water, vegetation, IS and soil. It did not use any classification arithmetic, and can get totally accuracy 91.3%, and according to spectral feature of water, vegetation IS and soil at TM, we defined RISI and used binary RISI to subtract binary MNDWI to get IS information. According to the result, it is an effective method to extract IS information.
ACKNOWLEDGE
Thanks to Ministry of Science and Technology Corporation Project and Science and technology platform project of Shan’xi Province. They offered us the experiment requirement and fund to buy data.
REFRENCES:
[1] Rouse J W, Haas R H , Schell J A , et al. Monitoring Vegetation Systems in the Great Plains with ERTS[ C] . The 3rd ERTS Symposium, Washington D C , USA , 1973
[2] Mcfeeters S K., The Use of Normalized
Difference Water Index (NDWI) in the in the Delineation of Open Water Feature [J].International Journal of Remote Sensin, 1996, 17(7): 1425-1432
[3] Xu Hanqiu. A Study on Information Extraction of Water Body With the Modified Normalized Difference Water Index (MNDWI) [J]. Journal of Remote Sensing, 2005, 9(5): 589- 595
[4] Ridd M K. Exploring a VIS
(Vegetation2Impervious Surface2Soil) Model for Urban Ecosystem Analysis Through Remote Sensing: Comparative Anatomy for Cities [ J ] .
International Journal of Remote Sensing, 1995, 16 (12): 2 16522 185
[5] Xu Hanqiu. A New Remote Sensing Index for
Fastly Extracting Impervious Surface
Information [J].Geomatics and Information Science of Wuhan University, 2008, 33(11): 1150-1153
[6] Wu Changshan, Murray A T. Estimating
Impervious Surface Distribution by Spectral Mixture Analysis [J] . Remote Sensing of Environment, 2003, 84 (4): 4932505
[7] Carlson T N, Arthur S T. The Impact of Land Use: Land Cover Changes Due to Urbanization on Surface Microclimate and Hydrology: a Satellite Perspective [J]. Global and Planetary Change, 2000, 25 (1): 49265
[8] Yang Xiaojun, Liu Zhi. Use of