comm
en
t
re
v
ie
w
s
re
ports
de
p
o
si
te
d r
e
se
a
rch
refer
e
e
d
re
sear
ch
interacti
o
ns
inf
o
rmation
Porcine transcriptome analysis based on 97 non-normalized cDNA
libraries and assembly of 1,021,891 expressed sequence tags
Jan Gorodkin
*
, Susanna Cirera
*
, Jakob Hedegaard
†
, Michael J Gilchrist
‡
,
Frank Panitz
†
, Claus Jørgensen
*
, Karsten Scheibye-Knudsen
*
, Troels Arvin
*
,
Steen Lumholdt
*
, Milena Sawera
*
, Trine Green
*
, Bente J Nielsen
*
,
Jakob H Havgaard
*
, Carina Rosenkilde
*
, Jun Wang
§¶¥
, Heng Li
§¶
,
Ruiqiang Li
§¥
, Bin Liu
§
, Songnian Hu
§
, Wei Dong
§
, Wei Li
§
, Jun Yu
§
,
Jian Wang
§
, Hans-Henrik Stærfeldt
#
, Rasmus Wernersson
#
,
Lone B Madsen
†
, Bo Thomsen
†
, Henrik Hornshøj
†
, Zhan Bujie
†
,
Xuegang Wang
†
, Xuefei Wang
†
, Lars Bolund
§¶
, Søren Brunak
#
,
Huanming Yang
§
, Christian Bendixen
†
and Merete Fredholm
*
Addresses: *Division of Genetics and Bioinformatics, IBHV, Grønnegärdsvej 3, The Royal Veterinary and Agricultural University, DK-1870
Frederiksberg C, Denmark. †Department of Genetics and Biotechnology, Danish Institute of Agricultural Sciences, Blichers Alle, DK-8830 Tjele,
Denmark. ‡The Wellcome Trust/Cancer Research UK Gurdon Institute, Cambridge, CB2 1QN, UK. §Beijing Genomics Institute, The Airport
Industrial Road, Beijing 101300, PR China. ¶Institute of Human Genetics, University of Aarhus, Nordre Ringgade 1, DK-8000 Aarhus C,
Denmark. ¥Department of Biochemistry and Molecular Biology, University of Southern Denmark, Campus Vej 55, DK-5230 Odense M,
Denmark. #Center for Biological Sequence Analysis, BioCentrum-DTU, Building 208, DK-2800 Lyngby, Denmark.
Correspondence: Merete Fredholm. Email: [email protected]
© 2007 Gorodkin et al.; licensee BioMed Central Ltd.
This is an open access article distributed under the terms of the Creative Commons Attribution License (http://creativecommons.org/licenses/by/2.0), which permits unrestricted use, distribution, and reproduction in any medium, provided the original work is properly cited.
The Sino-Danish PigEST resource
<p>A resource consisting of one million porcine ESTs is described, providing an essential resource for annotation, comparative genomics, assembly of the pig genome sequence, and further porcine transcription studies.</p>
Abstract
Background: Knowledge of the structure of gene expression is essential for mammalian transcriptomics research. We
analyzed a collection of more than one million porcine expressed sequence tags (ESTs), of which two-thirds were generated in the Sino-Danish Pig Genome Project and one-third are from public databases. The Sino-Danish ESTs were generated from one normalized and 97 non-normalized cDNA libraries representing 35 different tissues and three developmental stages.
Results: Using the Distiller package, the ESTs were assembled to roughly 48,000 contigs and 73,000 singletons, of which approximately 25% have a high confidence match to UniProt. Approximately 6,000 new porcine gene clusters were identified. Expression analysis based on the non-normalized libraries resulted in the following findings. The distribution of cluster sizes is scaling invariant. Brain and testes are among the tissues with the greatest number of different expressed genes, whereas tissues with more specialized function, such as developing liver, have fewer expressed genes. There are at least 65 high confidence housekeeping gene candidates and 876 cDNA library-specific gene candidates. We identified differential expression of genes between different tissues, in particular brain/spinal cord, and found patterns of correlation between genes that share expression in pairs of libraries. Finally, there was remarkable agreement in expression between specialized tissues according to Gene Ontology categories.
Published: 2 April 2007
Genome Biology 2007, 8:R45 (doi:10.1186/gb-2007-8-4-r45)
Received: 8 September 2006 Revised: 18 January 2007 Accepted: 2 April 2007 The electronic version of this article is the complete one and can be
Conclusion: This EST collection, the largest to date in pig, represents an essential resource for annotation, comparative genomics, assembly of the pig genome sequence, and further porcine transcription studies.
Background
The porcine genome has been characterized intensively through development of linkage maps, comparative maps, and physical maps [1,2] and Humphray and co-workers (unpublished data). These studies highlight the importance of genome research in pigs. Study of the porcine genome is important from the perspective of achieving sustainable breeding; also, the porcine model is an important research platform because of the anatomic, physiologic, biochemical, and metabolic similarities to humans. We recently showed that the evolutionary distance between the porcine and human genome sequences is smaller than the distance between mouse and human [3]. This provides a rationale for use of porcine sequences in gene expression comparisons with human and in transcriptome analysis of multiple tissues and organs [4,5] because, in contrast to human, there is easy access to tissues from the pig, including tissues from various embryonic developmental stages.
Here, we present an expression study based on 35 tissues rep-resented by 98 cDNA libraries, of which 97 are non-normal-ized. For the assembly, more than one million expressed sequence tags (ESTs) were used, of which approximately two-thirds were generated in this study and the remaining one-third of ESTs are from public databases. The assembly not only contributes to identification of potential novel genes associated with specific tissues but it also allows us to address the key issue of gene expression structure in tissues. Further-more, it is possible to search for genes that are expressed in a wide range of tissues, including genes that are of importance to embryonic development, because 24 of the 98 libraries used in the study are from various developmental stages.
Gene discovery and gene expression are key objectives of most genome projects, and consequently large-scale EST sequencing projects have been conducted for many organ-isms, including human, mouse, rat, chicken, frog, zebrafish, fruit-fly, and plants [6-22]. ESTs and full-length cDNAs pro-vide direct information on the transcriptome and indirect information on the relation between the genome and differ-ent phenotypes. Because only about 25% of all protein-encod-ing mammalian genes have been characterized [23], a major current task in genomics is to characterize the functional importance of individual genes within the context of their interactions with other genes.
The transcriptome of a particular species can be analyzed by sampling a large number of ESTs from cDNA libraries, which are constructed from different tissues, or tissues from differ-ent developmdiffer-ental conditions or physiologic stages. Com-pared with characterization of normalized or subtracted
cDNA libraries depleted of the most abundant transcripts, which optimizes discovery of novel genes [24-26], studies of non-normalized cDNA libraries are much more redundant but they provide raw information on the structure of gene expression levels [27].
To our knowledge the data presented here represent one of the largest collections of tissues ever included in a single EST expression study, and this makes it possible to conduct tissue-wise comparisons of the levels of expressed genes. Therefore, the generated pig EST resource represents an essential tool for the annotation and assembly of the forthcoming pig genome sequence, and it is a valuable resource for mamma-lian functional genomics research. The data presented here are also expected to have significant impact on efforts such as the Pig EST Data Explorer (PEDE) [28], which compiles full-length porcine cDNA sequences based on EST assembly. The resource makes it possible to compare coexpression patterns between organisms, for example between human, mouse, and pig. The PigEST resource, which is available online [29], con-tains a backend SQL database of clusters and singletons, as well as supplementary statical data files.
Below, we first describe the structure of gene expression in individual porcine tissues, and we find that the expression and the cluster sizes are scaling invariant. Then we show that brain and testes have greater gene diversity than any of the other tissues studied. Finally, we demonstrate that the estab-lished expression profiles represent the biologic function of the individual tissues.
Results
EST sequences and cDNA libraries
comm
en
t
re
v
ie
w
s
re
ports
refer
e
e
d
re
sear
ch
de
p
o
si
te
d r
e
se
a
rch
interacti
o
ns
inf
o
[image:3.612.61.562.118.749.2]rmation
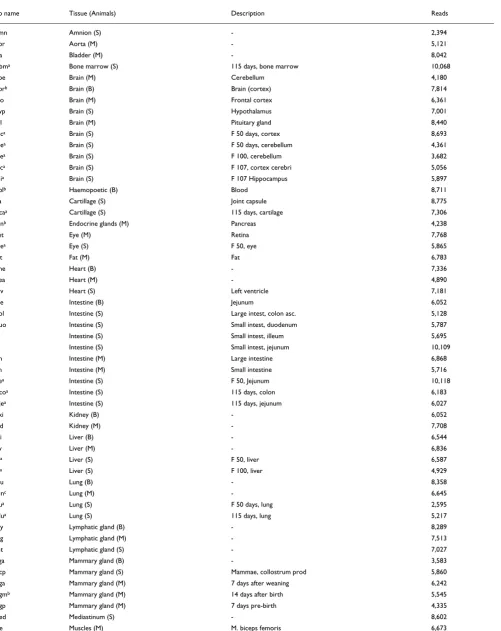
Table 1 cDNA libraries
Lib name Tissue (Animals) Description Reads
Amn Amnion (S) - 2,394
Aor Aorta (M) - 5,121
Bla Bladder (M) - 8,042
Nbma Bone marrow (S) 115 days, bone marrow 10,068
Cbe Brain (M) Cerebellum 4,180
Cbrb Brain (B) Brain (cortex) 7,814
Fco Brain (M) Frontal cortex 6,361
Hyp Brain (S) Hypothalamus 7,001
Pgl Brain (M) Pituitary gland 8,440
Ecca Brain (S) F 50 days, cortex 8,693
Ecea Brain (S) F 50 days, cerebellum 4,361
Fcea Brain (S) F 100, cerebellum 3,682
Fcca Brain (S) F 107, cortex cerebri 5,056
Fhia Brain (S) F 107 Hippocampus 5,897
Cblb Haemopoetic (B) Blood 8,711
Jca Cartillage (S) Joint capsule 8,775
Ncaa Cartillage (S) 115 days, cartilage 7,306
Panb Endocrine glands (M) Pancreas 4,238
Ret Eye (M) Retina 7,768
Eyea Eye (S) F 50, eye 5,865
Fat Fat (M) Fat 6,783
Che Heart (B) - 7,336
Hea Heart (M) - 4,890
Hlv Heart (S) Left ventricle 7,181
Cje Intestine (B) Jejunum 6,052
Col Intestine (S) Large intest, colon asc. 5,128
Duo Intestine (S) Small intest, duodenum 5,787
Ill Intestine (S) Small intest, illeum 5,695
Jej Intestine (S) Small intest, jejunum 10,109
Lin Intestine (M) Large intestine 6,868
Sin Intestine (M) Small intestine 5,716
Ejea Intestine (S) F 50, Jejunum 10,118
Ncoa Intestine (S) 115 days, colon 6,183
Njea Intestine (S) 115 days, jejunum 6,027
Cki Kidney (B) - 6,052
Kid Kidney (M) - 7,708
Cli Liver (B) - 6,544
Liv Liver (M) - 6,836
Elia Liver (S) F 50, liver 6,587
Flia Liver (S) F 100, liver 4,929
Clu Lung (B) - 8,358
Lunc Lung (M) - 6,645
Elua Lung (S) F 50 days, lung 2,595
Nlua Lung (S) 115 days, lung 5,217
Cly Lymphatic gland (B) - 8,289
Lyg Lymphatic gland (M) - 7,513
Lnt Lymphatic gland (S) - 7,027
Cga Mammary gland (B) - 3,583
Mcp Mammary gland (S) Mammae, collostrum prod 5,860
Mga Mammary gland (M) 7 days after weaning 6,242
Mgmb Mammary gland (M) 14 days after birth 5,545
Mgp Mammary gland (M) 7 days pre-birth 4,335
Med Mediastinum (S) - 8,602
Accessing the porcine transcriptome: the assembly
The sequences were assembled using the 'Distiller package' [15] (see Materials and methods, below), resulting in 48,629 clusters and 73,171 singletons (single reads). The sequences from the SD resource are present in 35,344 contigs, of which
6,388 contigs were constructed solely from our resource. There are 13,285 contigs composed of public sequences that do not contain any of the ESTs generated in our resource, and in addition the public EST sequences are also present in 42,241 contigs. Hence, although there are about 380,000
Ctlb Muscles (B) Tenderloin 6,533
Isp Muscles (M) M. infraspinatus 6,650
Ldo Muscles (M) M. longissimus dorsi 10,309
Mas Muscles (S) M. masseter 4,755
Sme Muscles (M) M. semimembranosus 3,274
Ssp Muscles (M) M. supraspinatus 7,379
Ste Muscles (M) M. semitendinosus 7,396
Tbr Muscles (M) M. triceps brachii 6,486
Vin Muscles (M) M. vastus intermedius 3,007
Esea Muscles (S) F 50, M. semitendinosus 7,905
Nmsa Muscles (S) 115 days, M. semitendinosus 4,676
Gul Oesophagus (M) - 5,631
Ova Ovary (M) - 7,744
Cov Ovary (S) - 7,567
Plad Placenta (M) - 7,481
Pro Prostata (M) - 1,953
Rec Rectum (M) - 5,778
Cmu Rhinal mucosal membrane (B) - 5,365
Nmma Rhinal mucosal membrane (S) 115 days, mucosal memb. 7,530
Sag Salivary gland (M) - 5,473
Csk Skin (B) - 7,105
Ski Skin (M) - 6,815
Ton Skin (S) Tip of tongue, mucosa 5,698
Eepa Skin (S) F 50, epidermis 8,159
Erua Skin (S) F 50, regium bilicalis 8,330
Nepa Skin (S) 115 days, epidermis 5,437
Spc Spinal cord (M) Spinal cord 8,821
Ebsa Spinal cord (S) F 50 days, brainstem 8,453
Fbsa Spinal cord (S) F 107 brainstem 5,703
Spl Spleen (M) - 6,984
Csp Spleen (B) - 6,204
Cst Stomach (B) - 7,141
Sto Stomach (M) - 5,561
Sug Suprarenal glands (M) - 7,856
Cag Suprarenal glands (B) Adrenal gland 6,614
Cte Testicle (B) - 3,416
Tes Testicle (M) - 4,812
Cty Thyroid glands (B) - 9,608
Thg Thyroid glands (M) - 7,887
Pty Thyroid glands (S) Piglet 2 days, thymus 7,007
Ftya Thyroid glands (S) F 100, thymus 5,687
Tra Trachea (M) - 8,124
Ute Uterus (S) - 7,531
Cut Uterus (B) - 5,885
The generated cDNA libraries, representing 35 tissues. They are here shown as two (overlapping) sets: a physiologic set and a developmental set. The column 'Lib name' gives three letter code for the library. 'Tissue' indicates the overall tissue the library was generated from, where '(Animals)' indicates whether the library was generated from a single (S or B) or multiple (M) animals. Libraries listed with (M) and (S) represent the pig breeds (mostly cross-breeds) used in Danish breeding (Landrace, Yorkshire, Duroc, and Hampshire), whereas the libraries listed with (B) present Chinese pig breeds. 'Description' provides a short description. The column 'Reads' shows the number of reads that went into that library after cleaning. The sum of all 'Reads' corresponds to the number of generated reads that contributed to the assembly, that is the number of reads after cleaning vector, repeats, and so on. Library names beginning with 'C' originates from Chinese pig breeds (except for 'Col' and 'Cbe'), whereas the remaining libraries originated from Danish pig breeds. aDevelopmental tissue. bIgnored in expression analysis (see Materials and methods). cLikely to be heavily contaminated by liver expressed sequence
[image:4.612.62.557.103.623.2]tags. dA normalized library.
comm
en
t
re
v
ie
w
s
re
ports
refer
e
e
d
re
sear
ch
de
p
o
si
te
d r
e
se
a
rch
interacti
o
ns
inf
o
rmation
public ESTs and 685,000 ESTs from the SD resource, the public sequences represent more genes than does our collec-tion. This is to be expected because our data were generated from non-normalized libraries to provide raw expression pro-files from different tissues, whereas many of the publicly available ESTs were generated from normalized libraries (for instance, see the reports by Hillier [31] and Scheetz [32] and their coworkers). This is also illustrated by the number of sin-gletons. The SD resource yielded 26,429 singletons, whereas the public ESTs comprise 46,742 singletons. The Distiller assembly program also predicted 6,896 clusters to contain at least one chimeric sequence; such information can be useful when one is manually inspecting clusters. Furthermore, Dis-tiller marked 430 clusters as groups of sequences linked by unknown or undetected repetitive elements, and about 2,500 clusters as representing alternative splice variants. These clusters were retained in the analysis conducted here. Single nucleotide polymorphisms (SNPs) are in part used by Dis-tiller to phylogenetically decompose clusters into smaller clusters either of recently duplicated genes or, in some cases, of sequences originating from Chinese breeds and Danish breeds. In-depth analysis of SNPs combined with manual curation will be reported in another paper [33].
All expression patterns extracted in this work are based on comparing cluster sizes relative to library sizes (see Materials and methods, below), in conjunction with the extent to which a library is represented in a cluster. Fundamental to this proc-ess is the underlying distribution of exprproc-ession, which we address as follows. We have sampled a large but non-exhaus-tive number of ESTs from each library (Table 1). Hence, we have sampled ESTs from each (non-normalized) cDNA library in the regime, where the absolute read count for each gene is proportional to the sampling size. Assuming that the assembly method can merge all reads from the same genes into the same cluster, then the cluster size is proportional to the total sampling size. This means that the cluster size within a single library is a measure of the expression of the corre-sponding gene it represents.
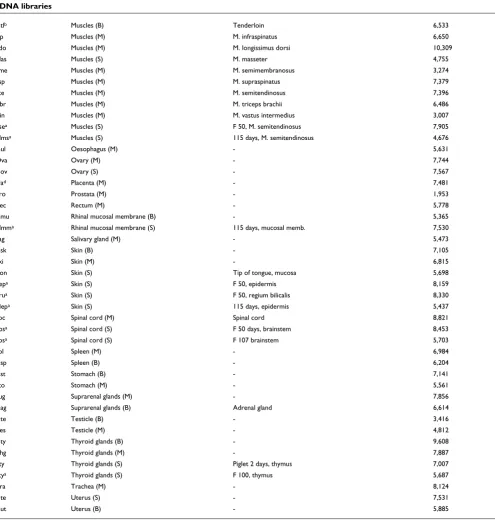
We considered the distribution of cluster sizes within each library (data not shown) and consistently observe, within one order of magnitude, that the number of cluster sizes is scaling invariant. Interestingly, this is also the case for the normal-ized library (Pla). When a library is normalnormal-ized only the amount of highly expressed genes is reduced; the scaling properties are maintained (Figure 1). The normalized library has a steeper slope (on a log-log plot) than do the other libraries.
In agreement with the observation for each library, we also observe a scaling invariant cluster size distribution for clus-ters representing ESTs from libraries and public sequences, as shown in Figure 1. The slope is less than is observed for the
[image:5.612.312.553.82.665.2]Distribution of cluster sizes Figure 1
Distribution of cluster sizes. The number of clusters on the y-axis versus the cluster size (number of reads) on the x-axis exhibit a power law-like region. The distribution marked 'All' indicates the cluster size distribution for the entire dataset, whereas the other distributions are examples from specific libraries: 'Pla' (placenta, normalized) and 'Fcc' (cerebellum F100 days).
1 10 100 1,000 10,000
Cluster size 1
10 100 1,000 10,000 100,000
Number of clusters of a given size
(All)
1 10 100
Cluster size 1
10 100 1,000 10,000
Number of clusters of a given size
(Pla)
1 10 100
Cluster size 1
10 100 1,000 10,000
Number of clusters of a given size
individual libraries, which we interpret as resulting from the impact of the less redundant public sequences. As observed, even ESTs from normalized libraries exhibit scaling invari-ance, and when merging EST data from multiple sources one should still expect a scaling invariant distribution of cluster sizes, although they are no longer a direct measure of expression.
In essence, the scaling invariance tells us that large clusters are rare and small clusters are common, and that the few clus-ters that are already large tend to become larger when new reads are added to the pool of sequences being assembled. In a separate study we constructed a simple model of simulation of the assembly process that can lead to scaling invariance, and we also observe scaling invariance for EST assemblies from other organisms using other assembly methods, for example tgicl [34] (Schiebye-Knudsen and coworkers, unpublished data). Hence, only when one considers data from a non-normalized library does the cluster size (number of ESTs) for a gene correspond to the level of expression of that gene, and the slope is an approximate measure of the gene diversity of the library.
Similarity match to existing sequences
To obtain information about contigs and single reads (hereaf-ter referred to as 'conreads') from sequence similarity, the conreads were BLASTed against SwissProt and TrEmbl (Uni-Prot 47.3) [35] for the protein search and against RNAdb (version August 2004), Fantom3, Rfam (version 7.0), and the MicroRNA registry (version 7.0) [36-39] for the noncoding RNA (ncRNA) search.
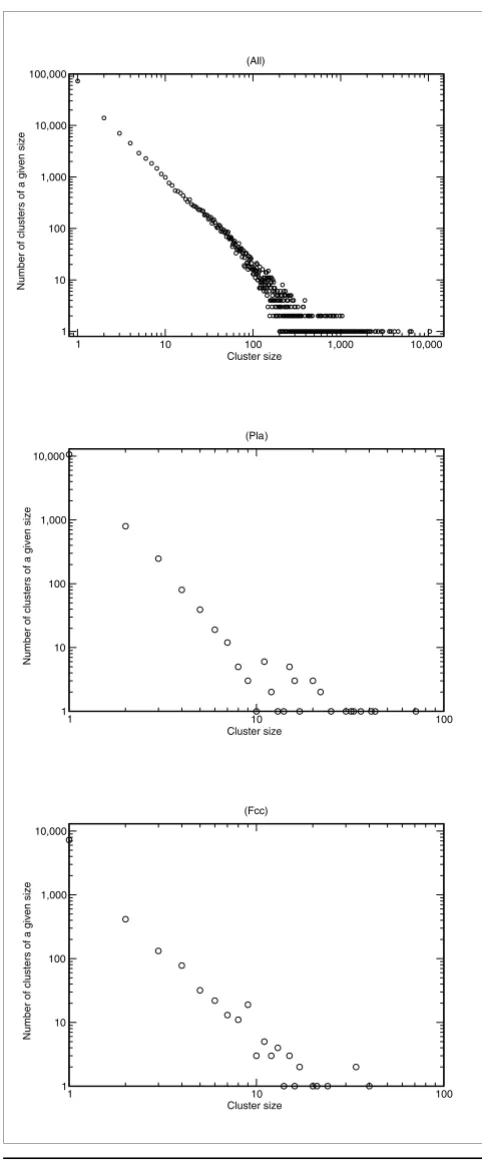
For protein comparison we searched for matches with high subject sequence (UniProt) coverage, as illustrated in Table 2. Here, we introduce various match levels from M0 to M5, where M0 is full-length subject coverage with at least 98%
sequence identity. In Table 2, the number of sequences above the various match levels is indicated. From among the top 30 reported BLAST hits, we included the first match with the highest obtainable match level (which in the great majority of cases was the first reported BLAST match). For comparison with UniProt, we found 2,155 conreads with full subject cov-erage. We found 12,886 high confidence matches (M0 to M4) for contigs and 2,614 high confidence matches for the singletons.
[image:6.612.59.555.120.237.2]When identifying ncRNAs, it is important to note that the RNA was enriched for poly(A) mRNA molecules by oligo(dT) selection. Interestingly, even though we masked for large and small ribosomal RNA and removed reads shorter than 100 nucleotides, we still observe small-sized RNAs such as tRNAs, U RNAs, and small structural elements. For example, some tRNAs are found in their surrounding sequence context. We also found 5.8S ribosomal RNAs as well as telomerase RNA. To obtain an indication of the amount of ncRNAs and ele-ments of RNA structure (eleRNAs), an initial filtering was conducted up to level M2, counting each contig or singleton only once and ignoring tRNAs. The distribution for the match levels can be found in Table 2. The candidates at the match levels M0 and M1 were further curated, and we found 53 unique (non-tRNA) M0 or M1 matches to ncRNA or eleRNA, using in this case a minimum alignment length of 30 nucleo-tides. Hence, even good matches to mature microRNAs were ignored. The resulting matches are listed in Additional data file 1 (Table S1). Among the findings are 11 microRNA hair-pins, of which four have already been predicted to be porcine microRNAs [3], and evidence of expression is hereby pro-vided. None of these ncRNAs appears to have a particular tis-sue specificity.
Table 2
Match of contigs and singletons to known databases
Match level (ID/Sbj) Contigs Singletons
UniProt NcRNAdb UniProt NcRNAdb
M0 (98%/100%) 1,982 21 173 6
M1 (95%/95%) 1,304 18 101 12
M2 (85%/90%) 2,517 72 236 20
M3 (70%/70%) 3,480 - 749
-M4 (60%/50%) 3,603 - 1,355
-M5 (20%/20%) 11,973 - 12,337
comm
en
t
re
v
ie
w
s
re
ports
refer
e
e
d
re
sear
ch
de
p
o
si
te
d r
e
se
a
rch
interacti
o
ns
inf
o
rmation
Gene diversity of the cDNA libraries
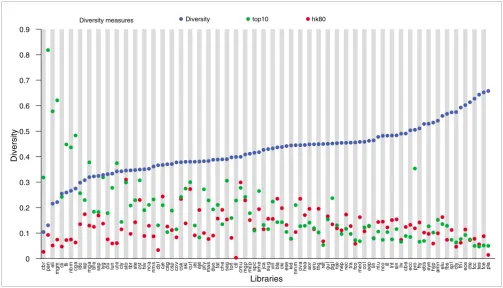
The expression profiles of the individual SD cDNA libraries were examined to identify libraries containing the greatest number of different genes. That is, for each library we com-pared the number of conreads with the total number of reads from the library (after cleaning). We refer to ratio between these numbers as the 'diversity' of the library. Hence, high diversity means that only a small number of reads could be merged into contigs (low redundancy). In Figure 2 we show the rank of diversity. Brain and testes tissues are among the libraries with the greatest diversity, together with placenta, which was expected because it is a normalized library. The same observation is maintained when we average across libraries representing a tissue (data not shown) and is in agreement with reported observations in human and mouse [40,41] (and references therein). Among the libraries with low diversity, we find early developmental stages of liver and lung tissue as well as mammary gland, all three representing tissues with specialized and restricted functions. However, adult liver (Liv) has relative high diversity, reflecting a physi-ologically active tissue. These diversity observations appear to be in agreement with the observation of different slopes on
the scaling invariant cluster size distributions for the libraries.
To further address the variance of the gene expression level in the different cDNA libraries, we also considered the percent-age of reads being among the 10 most expressed contigs in a library. This is indicated by 'top10' in Figure 2. Although this measure indicates the variance of gene expression within a library, it is also relevant to compare the fraction of reads that are among the most common contigs, that is, those contigs that are expressed in a large number of libraries (housekeep-ing genes; see below). In Figure 2 'hk80' for each library indi-cates the fraction of reads that are part of a contig that is expressed in more than 80 libraries (in total 65 contigs; for details, see below). This measure makes it possible to com-pare expression levels of the genes relative to a common ref-erence.
[image:7.612.53.556.86.374.2]Not surprisingly, we observe that top10 to some extent corre-lates with the diversity, because a high top10 value correcorre-lates with low diversity. Furthermore, we also observe a slight decrease in hk80 for the libraries where the diversity Diversity of cDNA libraries
Figure 2
Diversity of cDNA libraries. The libraries (x-axis) are ranked according to their diversity (blue dot on y-axis). The names of the libraries on the x-axis correspond to those listed in Table 1. The diversity of a library is computed as the number of conreads in which the library has at least one read included, divided by the total number of reads present in the library. (See Materials and methods, in the text, for further details.) Two additional measures are included as well. 'top10' (green dots) refers to the fraction of reads comprising the 10 most expressed contigs in that particular library. 'hk80' (red dots) refers to the fraction of reads representing the 65 housekeeping candidates expressed in more than 80 libraries listed in Additional data file 1 (Table S2). Brain and testes libraries are among the most diverse. These also appear as the most diverse from the average diversity for each of the 35 tissues (not shown). Note that the normalized library Pla is among the most diverse tissues, as one would expect a normalized library to be.
cb
r
pan eli
mgm
cli fli
nb
m
cg
a
ldo isp mg
a
bf
e
ssp lyg clu lun ut
e
cly sto tbr ste cst hlv nca nm
s
cb
l
cje cag csp cov csk ski cu
t
jej eje pty mas duo fat ch
e
sag ton ctl cm
u
mg
p
mc
p
sp
c
sm
e
jca sug vin bla cki ese kid
nm
m
ov
a
he
a
ao
r
eru thg ret gu
l
pg
l
nje nep rec tra fco med co
l
eep lin nl
u
nco ill lnt sin liv cb
e
ecc pro fty eb
s
eye hyp am
n
elu fbs sp
l
cty fh
i
ece cte fcc tes fce pla
0 0.1 0.2 0.3 0.4 0.5 0.6 0.7 0.8 0.9
Libraries
Diversity
increases. This is not surprising because increased diversity will cause the fraction of reads of any contig to decrease. How-ever, the placenta (Pla) library has very low hk80, in agreement with the fact that it is a normalized library. There are other libraries with very low hk80, including Ctl, Cbr, and Cbl, all libraries that were discarded from the expression analysis because of bias in the data (see below). For the part of the libraries with low diversity, top10 is in general higher than hk80, which is in contrast to libraries with high diversity.
To ensure that the diversity was not an artefact resulting from the different library sizes, we compared the diversity against the library size and found that these do not correlate, as the Pearson's correlation coefficient has a value of -0.21. The impact of differences in diversity is further reflected in the number of BLAST matches for a given cDNA library. We investigated diversity as a function of the percentage of conreads that have a BLAST match (M0 to M4) and obtained a correlation coefficient of -0.64; this indicates that the greater the number of different genes expressed in a library, the larger the portion of them that appears to be novel or alternatively spliced (data not shown).
Differences in diversity are also reflected in the amount of common contigs between libraries. For example, a relatively large fraction of contigs from brain tissues can also be found in almost all other tissues, whereas only a small fraction of contigs from the other tissues is present in brain tissues (data not shown). In a number of cases we observed that more diverse libraries share a relative large portion of their expressed genes with all of the other libraries, whereas for less diverse libraries only a small portion of expressed genes are represented in the libraries with high diversity.
To ensure that the libraries had representative unbiased expression, we pruned a few libraries for which the fraction of (UniProt) matched contigs was unusually low. From the dis-tribution of these fractions (Additional data file 1 [Figure S1]), the libraries Ctl, Cbr, Pan, Cbl, and Mgm are clearly separated in the low end from the remaining libraries, suggesting some problems with library construction (for instance, RNA degra-dation). This was further supported by manual inspection of the most highly expressed clusters for some of the libraries. For example, in the Ctl library the contig Ss1.1-rpigcf0_016260.5, which did not have any significant match to UniProt, appears to have a large number of reads clustered in the 5' end.
Clustering of cDNA libraries and library gene content
The raw expression values (read count) were normalized with respect to library size and then with respect to the level of each contig across all libraries with accumulated values (see Materials and methods, below). For each pair of cDNA librar-ies we computed the euclidian distance between the expres-sion values for all of the contigs represented with at least four
reads in both libraries (see Materials and methods, below). A conservative cutoff of four reads ensured that significant expression was present in both libraries. This conservative cutoff yielded 4,776 contigs. Furthermore, for each pair of compared libraries, genes with expression values more than one standard deviation away from the center of mass value were also discarded. For each obtained value the average dis-tance of all pairs was subtracted. These were clustered using the method of Eisen and coworkers [42] through the available software made by deHoon and coworkers [43]. We applied numerous combinations for hierarchical clustering. In gen-eral, we find that libraries from the following (adult) tissues cluster together: brain/spinal cord, testis, muscle/heart, and intestine. These tissues are represented by relatively many different genes either through high diversity of few libraries (brain/spinal cord and testis) or low diversity in many librar-ies (muscle/heart and intestine).
To further analyze potential differential expression in normal tissues, we explored expression within the following three groups: brain/spinal cord, muscle/heart, and intestine. The main reason for considering only a fraction of the libraries and a fraction of the genes (expression subtables) is that rela-tively few gene clusters are represented in all libraries, as shown in Figure 3. We conducted a hierarchical clustering on data under the restricted requirement that all clusters must be represented in at least 10 libraries with at least four read counts (data not shown). From this it was possible to extract examples of genes with correlated expression such as the ribosomal proteins shown in Additional data file 1 (Figure S2 [A]). Furthermore, we found pairs of libraries sharing genes, in which the relative expression of the genes in the libraries is constant (see Additional data file 1 [Figure S2(B)] for an example).
comm
en
t
re
v
ie
w
s
re
ports
refer
e
e
d
re
sear
ch
de
p
o
si
te
d r
e
se
a
rch
interacti
o
ns
inf
o
rmation
of these genes. Hence, we observe genes that are differentially expressed in normal tissues and between different develop-mental stages, for example cerebellum (Cbe and Fce). Similar types of observations were made for muscle/heart and intes-tine groups (data not shown).
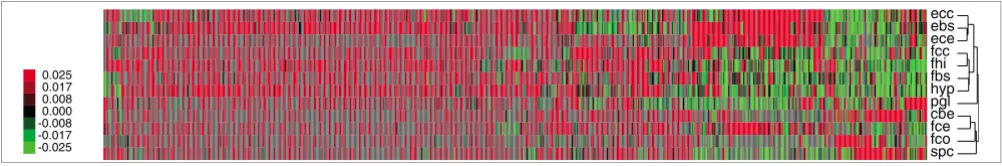
The pattern of clustering in Figure 4 has a clear biologic explanation, which applies primarily when one is studying tissues such as brain, for which the sampling procedure from the different parts of the brain in the different developmental stages was well defined. In contrast, the sample collection from the intestinal tissues and muscles was not specifically defined; thus, in regard to some of the libraries the cellular components potentially vary considerably. In brain we see a clear pattern of clustering by developmental stage; for instance, Ecc, Ebs and Ece are clustered, and Fcc, Fhi and Fbs are clustered. These two groups of libraries correspond to
dif-ferent parts of the brain at developmental stage 50 days and developmental stage 107 days, respectively. The clustering was further inspected with respect to expressed genes. For instance CROC-4, a transcriptional activator of c-fos, was identified in the cluster of genes specific to the 50-day-old fetal brain libraries. This gene has been described as being expressed in early development of the brain and is involved in cell proliferation and differentiation [44]. Large numbers of ribosomal proteins and hypothetical proteins were also observed in these brain libraries. The high number of hypo-thetical proteins (novel genes) is in agreement with the obser-vation of high gene diversity in the brain libraries. Also, in accordance with these observations, in general we observed a large amount of ribosomal proteins in the libraries from tis-sues sampled in early developmental stages (data not shown).
[image:9.612.54.295.85.254.2] [image:9.612.54.555.582.665.2]As mentioned above, not all gene clusters are represented in all libraries. This complicates expression analysis, but it is of interest when describing how many libraries are represented in a given gene cluster (given that the EST sequences were sampled from non-normalized libraries). As indicated in Figure 3, we observe scaling invariant-like behavior, which is in agreement with the scaling invariance observed for cluster sizes (Figure 1). In essence, clusters with reads from a large number of libraries are much more rare (by order of magni-tude) than are clusters with reads from a small number of libraries. Therefore, considering a cluster by chance it is more likely to find it expressed in only a few libraries. The really large clusters that deviate from this behavior could be due to extraordinarily high levels of transcription (represented by housekeeping genes) and alternative splice variants being merged into the same cluster. For example, we find only 65 contigs to be expressed in more than 80 libraries (of the 92 remaining after cleaning), as shown in Additional data file 1 (Table S2). Approximately 40% of these genes are ribosomal proteins, which is not surprising because they are essential components of the cellular machinery. Clearly, these genes can be considered housekeeping genes, but the scaling invariant-like behavior shown in Figure 1 makes it clear that genes expressed in many libraries are less likely to be sampled from all libraries (with the current EST sampling strategy). Distribution of cluster coverage of cDNA libraries
Figure 3
Distribution of cluster coverage of cDNA libraries. The values on the x-axis indicate the number of libraries for which there is at least one expressed sequence tag (EST) read present. The corresponding value on the y-axis shows the number of conreads for a given number of libraries. The vertical lines at 60 and 80 indicate cut-offs for potential housekeeping genes. The data indicate the presence of power law-like behavior. The data also show that we can only expect a small portion of the clusters to be composed of reads from many libraries.
10 60 80 100
Expression in number of libraries 1
100 10000
Number of contigs
Patterns of differential expression Figure 4
Patterns of differential expression. Differential expression within brain and spinal cord tissues. The clusterings were made using the package of de Hoon and coworkers [43], with options 'uncentered correlation' and 'average-linkage'. Gray fields indicate that the number of reads did not exceed the read cutoff of four reads for a given contig in a given library. However, such numbers were still counted as having the value zero when centering the expression values for the gene cluster. The tree has arbitrary scale.
ecc ebs ece fcc fhi fbs hyp pgl cbe fce fco spc
We therefore underestimate the number of housekeeping genes, when these housekeeping genes are defined as genes present in all libraries at some minimum level of transcription.
Library-specific genes
We (conservatively) selected cDNA library-specific gene can-didates as follows. The libraries with the two highest levels of expression for a given transcript were compared, and it was required that the library with the highest level of expression had a read count of at least 10 reads, regardless of the library size. Then, we computed the probability of observing the counts for the highest expression value, given the observed counts of the second highest using the work of Audic and Claverie [45], and required this to be less than 0.05 (see Materials and methods, below). In cases in which only a sin-gle library had high expression, the 'second highest' count was set to zero whereas the library size was set to the smallest library size in the dataset.
We obtained a list of 876 gene clusters, to which we assigned corresponding BLAST matches if available; 676 of these gene clusters had a match of at least M4 to UniProt. The top 50 in the list is shown in Additional data file 1 (Table S3); the com-plete list is available online via the download area of the PigEST resource [29]. Note that this list contains genes that can be specific in one of multiple libraries from the same tis-sue. This can be explained by the fact that no effort has been made to ensure sampling of precisely matching cell popula-tions from the individual tissue. The expression profile of the genes belonging to the top 50 'tissue-specific gene list' listed in Table 3 was manually inspected and compared with Uni-Gene at NCBI [46]. The gene names used in UniUni-Gene were those from the description line of the best matching BLAST hit (regardless of the match level) of the top 50 list (Addi-tional data file 1 [Table S2]). The comparison was done with human data when available and otherwise with mouse or cat-tle data. In 25 cases the tissue (in which a given library
spe-cific gene was found) in which the corresponding gene was highly expressed was in agreement with the public data. In 14 cases there was not enough expression data to draw any con-clusions. In 11 cases the published results did not agree with our findings. However, considering only the most confident BLAST matching contigs (M0 level only), 16 cases agreed with UniGene, four cases had insufficient data, and six did not agree. Hence, for more than 70% (16/22) of UniGene match-ing M0 cases, we found agreement in expression.
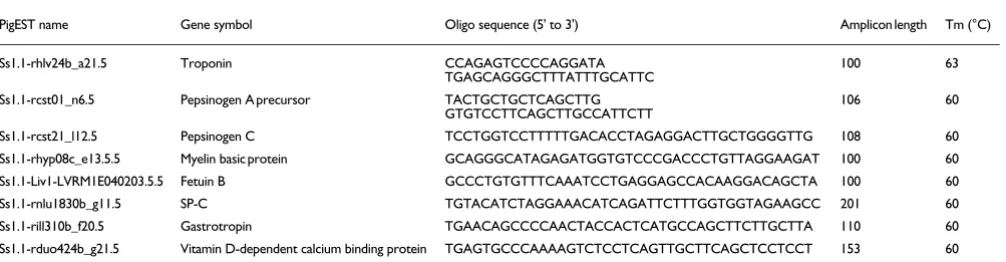
We also observed three cases in which the discrepancies per-tain to expression of liver-specific genes in the Lun library, which points toward a possible contamination of this library with liver. Further inspection of the library confirms the pres-ence of high levels of liver-specific genes. Furthermore, real time quantitative polymerase chain reaction (qPCR) analysis was performed on eight selected genes from additional in-house tissue (see Materials and methods, below). These genes were as follows: pepsinogen c, vitamin D-dependent calcium-binding protein, fetuin B, gastrotropin, pepsinogen A precur-sor, myelin basic protein, surfactant protein-C, and troponin C (also see Materials and methods, below). In seven cases the qPCR results were in agreement with in silico results. In one case (the gastrotropin gene [Ss1.1-rill310b_f20.5; Table 3]), the greatest expression was found in thymus, which in our in silico study was positioned as the second tissue in which this gene is most highly expressed.
Expression characterization by top level Gene Ontology terms
[image:10.612.58.561.119.250.2]To address the issue of functional representation of each library, we constructed Gene Ontology (GO) profiles [47] at the top level for each of the three main classes: 'molecular function', 'cellular component', and 'biological process'. The roughly 10,000 conreads that had a BLAST match to UniProt of M0 to M3 were analyzed. Profiles were constructed for each library and compared in terms of the fraction of expres-sion content for each of the top categories within the three Table 3
Primers and PCR conditions
PigEST name Gene symbol Oligo sequence (5' to 3') Amplicon length Tm (°C)
Ss1.1-rhlv24b_a21.5 Troponin CCAGAGTCCCCAGGATA
TGAGCAGGGCTTTATTTGCATTC
100 63
Ss1.1-rcst01_n6.5 Pepsinogen A precursor TACTGCTGCTCAGCTTG
GTGTCCTTCAGCTTGCCATTCTT
106 60
Ss1.1-rcst21_l12.5 Pepsinogen C TCCTGGTCCTTTTTGACACCTAGAGGACTTGCTGGGGTTG 108 60
Ss1.1-rhyp08c_e13.5.5 Myelin basic protein GCAGGGCATAGAGATGGTGTCCCGACCCTGTTAGGAAGAT 100 60
Ss1.1-Liv1-LVRM1E040203.5.5 Fetuin B GCCCTGTGTTTCAAATCCTGAGGAGCCACAAGGACAGCTA 100 60
Ss1.1-rnlu1830b_g11.5 SP-C TGTACATCTAGGAAACATCAGATTCTTTGGTGGTAGAAGCC 201 60
Ss1.1-rill310b_f20.5 Gastrotropin TGAACAGCCCCAACTACCACTCATGCCAGCTTCTTGCTTA 110 60
Ss1.1-rduo424b_g21.5 Vitamin D-dependent calcium binding protein TGAGTGCCCAAAAGTCTCCTCAGTTGCTTCAGCTCCTCCT 153 60
comm
en
t
re
v
ie
w
s
re
ports
refer
e
e
d
re
sear
ch
de
p
o
si
te
d r
e
se
a
rch
interacti
o
ns
inf
o
rmation
classes. Profiles for each cDNA library can be found in Addi-tional data files 2 to 4, in which the normalized library Pla (Placenta) is included for comparison. On initial inspection the content of most libraries appears uniform. However, when the libraries are compared in greater detail differences are found. For each library we computed the log odds ratio (in bits) between the observed fraction of a subcategory (for instance, 'binding' within 'molecular function') and the aver-age fraction taken over all libraries. Heat maps were con-structed for each of the main categories.
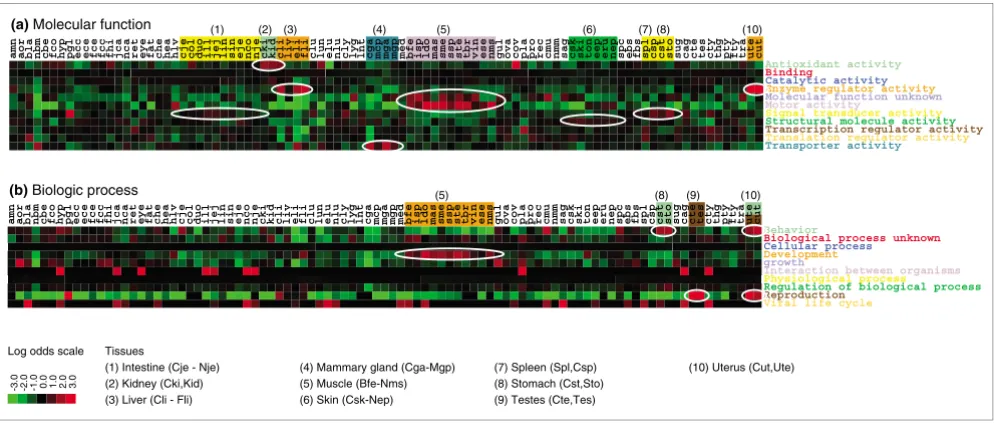
In Figure 5 heat maps for 'molecular function' and 'biological process' are shown. The libraries are ordered as in Table 1, and libraries within the same tissue are listed adjacent to each other. Figure 5a shows log odds ratios for 'molecular func-tion'; we observe that some tissues have over-representation of some categories, as indicated by the coloring and ellipsoids. We find that muscle libraries have an over-representation of the category 'motor activity', and almost all other libraries are under-represented in this category. Muscle libraries are also clearly over-represented in the category 'molecular function unknown'. The liver and uterus libraries are clearly over-rep-resented in the categories 'enzyme regulator activity'. Kidney is over-represented in the category 'antioxidant activity'. The mammary gland libraries are over-represented in the cate-gory 'transporter activity'. Finally, skin libraries are (slightly but consistently) over-represented in the 'structural molecule activity' category.
These findings are in agreement with the molecular function of the individual tissues, confirming that the expression
profiles of the libraries are in agreement with the physiology and the function of the individual tissues. Furthermore, the two categories that constitute approximately 50% of expres-sion (Additional data file 2), namely 'binding' and 'catalytic activity', do not in general vary much relative to their average fraction. It is worth noting that all of the tissues exhibiting over-representation of a specific GO category are tissues that in general do not have very high diversity and tissues that also have relatively specific functions.
For the other main GO category, 'biological process' (Figure 5b), we made the following observations. With regard to 'bio-logical process', tissues such as testes and uterus are highly over-represented in the category 'reproduction', and almost all other libraries are highly under-represented. Muscle libraries are over-represented in the 'development' category, and stomach and uterus are over-represented in the 'behavior' category. For the main GO category, namely 'cellu-lar component' (not shown), we find that fat and skin are over-represented in 'extracellular matrix'. A direct correlation between expression and function is clear in regard to 'repro-duction' and 'extracellular matrix'. However, because some of the categories are quite broadly defined, a direct correlation to tissue physiology is not clear-cut for all categories.
[image:11.612.58.555.86.297.2]Furthermore, we also looked for correlations between expres-sion patterns, and we found a handful of cases of correlating categories (|cc| > 0.63); examples are shown in Additional data file 1 (Figure S3) for 'transcription regulator activity' and 'translation regulator activity'. Other examples include 'phys-iological process' and 'regulation of b'phys-iological process' as well Gene Ontology content of cDNA libraries and tissues
Figure 5
Gene Ontology content of cDNA libraries and tissues. A heat map of the log odds values (in bits) for each library, found by comparing the observed fraction of the Gene Ontology top level categories of (a) 'molecular function' and (b) 'biological process' with the respective averages. Gene Ontology categories were taken from corresponding M0 to M3 BLAST matches to UniProt. The libraries are grouped by their corresponding tissues, and the coloring indicates the category where we find higher expression than by chance. Only the relevant tissues are indicated by numbers and listed by their range of cDNA library names.
(a) Molecular function (1) (2) (3) (4) (5) (6) (7) (8) (10)
amn aor bla nbm cbe fco hyp pgl ecc ece fce fcc fhi jca nca ret eye fat che hea hlv cje col duo ill jej lin sin eje nco nje cki kid cli liv eli fli clu lun elu nlu cly lyg lnt cga mcp mga mgp med bfe isp ldo mas sme ssp ste tbr vin ese nms gul ova cov pla pro rec cmu nmm sag csk ski ton eep eru nep spc ebs fbs spl csp cst sto sug cag cte tes cty thg pty fty tra ute cut Antioxidant activity
Binding
Catalytic activity Enzyme regulator activity Molecular function unknown Motor activity
Signal transducer activity Structural molecule activity
Transcription regulator activity
Translation regulator activity Transporter activity
(b) Biologic process (5) (8) (9) (10)
amn aor bla nbm cbe fco hyp pgl ecc ece fce fcc fhi jca nca ret eye fat che hea hlv cje col duo ill jej lin sin eje nco nje cki kid cli liv eli fli clu lun elu nlu cly lyg lnt cga mcp mga mgp med bfe isp ldo mas sme ssp ste tbr vin ese nms gul ova cov pla pro rec cmu nmm sag csk ski ton eep eru nep spc ebs fbs spl csp cst sto sug cag cte tes cty thg pty fty tra ute cut Behavior
Biological process unknown Cellular process
Development growth
Interaction between organisms
Physiological process
Regulation of biological process
Reproduction
Viral life cycle
Log odds scale
-3.0 -2.0 -1.0 0.0 1.0 2.0 3.0
Tissues
(1) Intestine (Cje - Nje) (2) Kidney (Cki,Kid) (3) Liver (Cli - Fli)
(4) Mammary gland (Cga-Mgp) (5) Muscle (Bfe-Nms) (6) Skin (Csk-Nep)
(7) Spleen (Spl,Csp) (8) Stomach (Cst,Sto) (9) Testes (Cte,Tes)
as 'binding' and 'structural molecule activity' (data not shown). Similar correlations are observed for other classes as well, for example the categories 'cellular process' and 'physio-logical processes' are strongly correlated in the 'bio'physio-logical process' class.
Discussion
We present a resource of more than one million porcine EST sequences, of which two-thirds were generated for the work presented here and the remaining one-third of EST sequences were extracted from public databases. The sequences from our PigEST resource were extracted from 97 non-normalized cDNA libraries and one normalized cDNA library represent-ing in total 35 tissues. We have conducted an initial expres-sion analysis, providing novel insight into the structure of a large-scale set of EST sequences from non-normalized librar-ies of normal tissue and tissue sampled at various develop-mental stages. The assembly resulted in approximately 48,000 contigs and 73,000 singletons. Out of these a total of 2,155 contigs was identified with full-length coverage and high confidence match to UniProt; in addition, 12,886 contigs and 2,614 single reads were found with high confidence matches. Thus, using stringent criteria, about 25% of our con-tigs and singletons were matched with high confidence. In addition, we also identified approximately 50 noncoding RNAs, including 11 microRNAs (of which four were found previously in genomic sequence [3]).
We conducted an extensive analysis of gene expression struc-ture in tissues. We found that the assembled clusters led to the observation that expression and the cluster sizes are scal-ing invariant, an observation that is in agreement with the observed scaling invariance of microarray expression data (for example see the reports by Hoyle [48] and Lu [49] and their coworkers). The results indicate that large clusters (high expression) are rare, whereas small clusters (low expression) are common.
To identify the tissues containing the most different genes, we compared library sizes with the number of conreads. We found that the tissues brain and testes have higher gene diver-sity than the other tissues. This is in accordance with the observation that the most diverse libraries have steep slopes in their scaling invariant cluster size distributions. Further-more, in agreement with this, we observed that high-diversity tissues in general have a lower percentage match to UniProt, indicating that libraries representing these tissues are suita-ble for finding novel genes or alternatively spliced genes (not assembled into the same contig).
A major challenge was to extract meaningful expression pat-terns from the EST libraries. To provide the most reliable starting point for these studies, we removed libraries with biased expression patterns. It is most likely that there are still a few artificial expression patterns in the remaining clusters,
in particular among the genes in the tissue-specific gene list. However, we found that only a constant fraction of gene clus-ters (contigs) can be expected to be present in all libraries. The fact that not all gene clusters are represented in all librar-ies complicates the differential expression analysis across the libraries. Nevertheless, we showed that meaningful expression results could be extracted from the resource. First, we showed that tissues represented by many libraries or libraries with high diversity in general cluster together. Sec-ond, we found differential expression patterns within the tis-sues brain/spinal cord, muscle/heart, and intestine. These tissues are represented by high-diversity or multiple libraries involving approximately 1,200 gene clusters. In these librar-ies, manual inspection revealed that the expression patterns of specific genes were in accordance with the biological func-tion of the individual tissues.
Furthermore, we extracted 876 gene clusters as candidates for cDNA library specificity, of which approximately 7% were in libraries from a given developmental stage. The top 50 can-didates were inspected manually, and it was found that our results agreed with most of the corresponding expression profiles available via UniGene (25 versus 11; 14 cases did not have similar data). However, these numbers were 16 versus 6 for the best BLAST matching contigs (M0 level). We also con-ducted qPCR in eight selected genes, and found that their expression profiles agreed with the corresponding expression found in the EST study.
We also considered how often the contigs were expressed in a given number of cDNA libraries. The distribution of these data reveals a scaling invariant-like behavior, which appears to be a novel observation. Thus, there is a fixed proportion between the number of genes (contigs) expressed in many libraries and those expressed in few. Hence, considering a small number of libraries and tissues, there is no guarantee that genes expressed in all libraries will also be expressed in all libraries of a bigger sample. However, because we used 92 libraries covering 32 tissues in this study (poor quality and normalized libraries being discarded), we cover a large pro-portion of all existing tissues. Therefore, we have high confi-dence in our housekeeping gene candidates list. It should, however, be noted that because of the scaling properties, we are probably missing many housekeeping genes, in particular those expressed only at low levels.
'repro-comm
en
t
re
v
ie
w
s
re
ports
refer
e
e
d
re
sear
ch
de
p
o
si
te
d r
e
se
a
rch
interacti
o
ns
inf
o
rmation
duction' category of 'biological process'. Interestingly, the muscle libraries contain the highest relative amount of genes with poor annotation, implying that the relative proportion of functionally unaccountable genes is higher than in any other tissue.
There are many obvious directions in which this work can be continued. It is relevant, for instance, to conduct a compari-son with porcine UniGene [46]. More detailed studies of expression profiles will provide new information about the mammalian transcriptome and will provide new functional information with regard to individual non-annotated tran-scripts. As expected, sequencing of non-normalized cDNA libraries has resulted in a high level of redundant transcripts. It has, however, also resulted in new information about diver-sity in individual tissues. Because the greatest diverdiver-sity is found in brain and testes, it is clear that additional sequenc-ing of ESTs from these tissues is expected to provide novel transcripts.
In conclusion, we have not only demonstrated that the estab-lished expression profiles not only represent the biologic function of the individual tissues, but also we have provided novel information about the gene expression structure of the tissues. This resource [29] will be of importance for compar-ative transcriptomics, annotation of novel genes, and systems biology.
Materials and methods
Construction of the 98 porcine cDNA libraries
Tissue collection
Tissues were collected from 200 pigs used in the Danish pig production industry; breeds were cross-breeds from Lan-drace, Yorkshire, Duroc, and Hampshire. A Chinese breed, Taihu/Erhualian, was also used. Tissues were immediately frozen in liquid nitrogen after sampling and were stored at -80°C until use. Some of brain tissues were kept in RNA buffer (Ambion, Cambridge, UK) in order to prevent degradation.
RNA extraction
Total RNA was extracted from up to 1 g of the various pig tis-sues using TRI REAGENT (Molecular Research Center, Inc.) or RNeasy (Qiagen, GmbH, Germany), following the manu-facturers' protocols. Quality of the extracted total RNA was assessed by agarose gel electrophoresis. PolyA+ mRNA was isolated from 0.1 to 1 mg total RNA using polyATtract mRNA isolation system IV (Promega, Madison, USA) or Oligotex mRNA Purification System (Qiagen), and approximately 0.5 μg of polyA+ mRNA was quality checked by agarose gel electrophoresis
cDNA library construction
Directional cloneable cDNA was synthesized from 5 μg Poly(A+) mRNA using the cDNA Synthesis Kit (Stratagene, Cedar Creek, USA) following the manufacturer's protocol.
The cDNA was size fractionated using Sepharose CL-2B, as included in the library kit, or by agarose gel electrophoresis followed by purification using Qiaex II Gel extraction kit (Qia-gen). Purified cDNA was ligated into EcoRI/XhoI digested pBluescript II XR (Stratagene) or pTrueBlue (Alert B&C, Quebec, Canada) using temperature-cycle ligation [50] followed by PCR validation of the ligation reaction. The liga-tion product was precipitated and electro-transformated into
E. coli XL1-Blue MRF' (Stratagene) and plated on blue/white selective LB agar, and positive clones were picked into 2xTY (100 μg/ml Amp, 10% [vol/vol] glycerol) in 384-well plates using a QPix2 robot (Genetics Limited, Norwich, UK), incu-bated for 24 hours at -37°C, and stored at -80°C until use. The insert length of each library was evaluated in 192 clones by PCR. Quality criteria was set at a maximum of 8% colonies without insert and a maximum of 10% to 20% with inserts less than 400 base pairs (with the exception of the brain libraries, for which the latter was set at 20%).
The RNA used in the libraries Cag, Cga, Che, Cje, Cki, Cli, Cly, Cmu, Cov, Csk, Csp, Cst, Cte, Cov, and Cut was extracted from Chinese pigs using TRI REAGENT (Molecular Research Center, Inc.). The RNA corresponding to these libraries were sent to Denmark and the libraries were made. The RNA was EtOH precipitated on arrival. RNA quality was checked by optic density (OD) and agarose gel. The RNA corresponding to the libraries Cli, Cga, Cov, Cly, Csp, and Cag contained genomic DNA, and it was re-extracted using TRI REAGENT before proceeding to the construction of the libraries in order to eliminate the gDNA. The library construction and quality criteria are as described before. In total 98, cDNA libraries covering 35 tissues were constructed (Table 1).
EST sequencing
T3 primer was used from the polylinker of the vectors to sequence the 5' end of each insert using standard protocols. Sequencing reactions were analyzed on the MegaBACE 1000 DNA Analysis System (Amersham Bioscience, Buckingham-shire, UK).
qPCR experiments
three reference gene's expression ratios (ribosomal protein L4 [RPL4]; hypoxanthine phosphoribosyltransferase 1 [HPRT1], and β-actin [ACTB]) and calculated using geNorm [51].
The Primer3 software [52] at MACROBUTTON HtmlResAn-chor [53] was used for primer design. Two primers were designed covering around 100 base pairs of each cDNA for the eight selected genes and the three reference genes (Table 3). A standard curve was constructed using the purified PCR product generated for each specific primer pair. Single reac-tions were prepared for each cDNA, along with the standard curve and a nontemplate control using the Brilliant r SYBR r Green Master Mix (Stratagene). Each reaction consisted of 20 μl containing 2 μl of one-eighth diluted cDNA and 5 to 20 pmol of each primer. The real-time reverse transcription PCR was performed using a Mx3000 detection system (Strata-gene). The cycling conditions were one cycle of denaturation and hot start at 95°C/15 min, followed by 40 cycles of ampli-fication (95°C for 30 s, 60-63°C for 1 min, 72°C for 30 s) and one three-segment cycle of product melting (95°C for 1 min, 55°C for 30 s, and 95°C for 30 s). The baseline adjustment method of the Mx3000 (Stratagene) software was used to determine the crossing thresholds (Ct).
Data extraction and cleaning
In total, 970,404 raw chromatogram files were generated in the SD resource. Those meeting the criteria were uploaded at the NCBI trace archive and are avaliable upon searching using the center name 'SDJVP' (Sino-Danish Joint Venture Project) and dates from 16 July to 31 July 2006. The contigu-ous ranges of accession numbers are summarized in Addi-tional data file 1 (Table S4).
The plate archives and files were examined for duplicates, misplaced and erroneously packed plate archives, and erro-neously named trace files. Where possible naming errors were corrected, and for different reads with identical names the latest generated were chosen over earlier ones. Here, the 970,404 raw chromatogram files were processed using phred (-trim alt "" -trim cutoff 0.01) and phd2fasta [54,55], which yielded 823,871 files containing sequences. Then vector sequences from Univec (Kitts and coworkers, unpublished data) were removed along with linker (XhoI) sequence. Resulting sequences with length less than 100 nucleotides were also removed. This resulted in 685,851 reads. These were repeatmasked in the assembly process using the Dis-tiller package (see below).
The databases used for repeatmasking and vector cleaning were from Univec, namely ribosomal sequences 18S pig (gi 52694694) and 28S human (gi 337381). The latter because there were no full 28S sequence available for pig in GenBank [30]. The porcine mitochondrial genome sequence (gi 33320837) was included as well. Finally, in order to remove repetitive segments the following libraries from RepBase
were used [56]: simple.lib, alu.lib, at.lib, carnivorecut. lib, carnivore.lib, cetartiocut.lib, cetartio.lib, cut1.lib, cut2.lib, humlines.lib, humsines.lib, humspec.lib, l1.lib, mir.lib, mirs.lib, othermamreps.lib, retrovirus.lib, rod1.lib, rod2.lib, rodcut2.lib, rodcut.lib, and rodcutsines.lib. Removing repeatmasked sequences from the dataset reduced the data-set to 636,516 sequences.
The dataset was extended with 398,837 EST sequences down-loaded from GenBank (the Entrez nucleotide database) [30], searching Organism and EST Database Division using the fol-lowing terms: 'Sus scrofa[ORGN]' AND 'gbdiv est[PROP]'. After cleaning, this set was reduced to 385,375 sequences. Hence, in total 1,021,891 EST sequences were analyzed.
Assembly
To assemble the EST sequences we used the Distiller assem-bly program, which was used in another large-scale EST project conducted in Xenopus tropicalis [15] (see details in that report). Briefly, the Distiller program first conducts a pair-wise comparison of all sequences using BLAST. Then, sequences are clustered, but with a requirement of double linkage for sequences added to the clusters. This lowers the chance, for example, of mis-assembly of ESTs from two genes into a single cluster through a chimeric sequence. In a later stage, clusters are joined using a more relaxed linkage crite-ria. Consensus sequences are constructed from sets of adja-cent 12-mers over the aligned sequences in the given region. After a first round of assembly, the clusters were phylogenet-ically decomposed to separated close gene family members. Furthermore, Distiller detects SNPs, alternative splice vari-ants, and chimeric sequences. At an early stage in the project, from among other assembly programs, we also applied the tgicl package [34]. This was applied before inclusion of the public sequences, and the observations on diversity and pair-wise correlations of GO categories were essentially the same as presented in the Results section (above). However, because of the features of Distiller, including the double linkage clus-tering and alternative splicing predicting (applied elsewhere), we found it more suitable to apply this program here.
Expression levels of genes
The relative expression of gene (cluster/singleton) i in library
j is computed as xij = nij/(NjMi), where nij is the number of
read sequences in gene i from library j, is the
number of reads in library j (after running phred and
repeat-masker, and so on), and is the
accumu-lated expression of gene i. The number of genes (#genes) is the number of conreads and the number of libraries (#libs) is usually 92, which is the number of libraries obtained after
Nj nij
i genes =
=
∑
1 #Mi nij Nj
j libs =
=
∑
/#