0095-1137/09/$08.00⫹0 doi:10.1128/JCM.01300-08
Copyright © 2009, American Society for Microbiology. All Rights Reserved.
Performance of the Abbott Real-Time PCR Assay Using
m
2000
sp
and
m
2000
rt
for Hepatitis C Virus RNA Quantification
䌤
Ste
´phane Chevaliez, Magali Bouvier-Alias, and Jean-Michel Pawlotsky*
French National Reference Center for Viral Hepatitis B, C, and Delta, Department of Virology, Hoˆpital Henri Mondor,
Universite´ Paris 12, and INSERM U955, Cre´teil, France
Received 9 July 2008/Returned for modification 3 December 2008/Accepted 6 April 2009
Quantification of hepatitis C virus (HCV) RNA is essential for the everyday management of chronic hepatitis C therapy. “Real-time” PCR techniques are potentially more sensitive than classical PCR techniques, are not prone to carryover contamination, and have a consistently wider dynamic range of quantification. Thus, they are rapidly replacing other technologies for routine quantification of HCV RNA. We extensively evaluated the intrinsic characteristics and clinical performance of them2000sp-m2000rtAbbott real-time PCR platform for
HCV RNA quantification. The study shows that them2000sp-m2000rtplatform is sensitive, specific, and precise;
that the results are reproducible; and that the platform has a broad dynamic range of quantification. When comparing HCV RNA levels measured in the same individuals with them2000sp-m2000rtplatform and the
third-generation branched-DNA assay, a trend toward a modest overestimation of HCV RNA levels was observed in them2000sp-m2000rtplatform in all genotypes except genotype 5. The differences, however, were
unlikely to have any impact in clinical practice. In conclusion, our study shows that the Abbottm2000 real-time PCR system for HCV RNA quantification is sensitive, specific, and precise; that the results are reproducible; and that the platform’s broad dynamic range of quantification is well suited to HCV RNA monitoring in the clinical setting.
Monitoring of hepatitis C virus (HCV) RNA levels is essen-tial for the management of chronic hepatitis C therapy with the combination of pegylated alpha interferon and ribavirin. In-deed, the rapid (undetectable HCV RNA at week 4 of therapy)
and early (more than 2 log10drop or undetectable HCV RNA
at week 12 of therapy) virologic response is a strong predictor of the likelihood of sustained viral eradication and is used to tailor the treatment duration and to improve cure rates (2, 6, 7, 10, 14, 16, 23, 26, 27). HCV RNA quantification will continue to be of major importance in the management of therapy with the new HCV drugs in development to assess the virologic response and to detect virologic breakthroughs related to viral resistance early enough to alter therapy and rescue antiviral efficacy (20).
Ideally, HCV RNA quantification assays should be sensitive, specific, accurate, and precise, and the results should be repro-ducible. They should have a broad range of linear quantifica-tion that fully covers the HCV RNA levels observed in clinical practice in both untreated and treated patients, and quantifi-cation should be independent of the HCV genotype. Real-time PCR techniques currently are replacing classical PCR methods and the branched-DNA (bDNA) technology, which did not fulfill all of these criteria. Real-time PCR methods are sensi-tive, with lower limits of detection/quantification on the order of 10 to 15 HCV RNA international units (IU)/ml, and are not prone to carryover contamination. They benefit from a broad
dynamic range of quantification of 7 to 8 log10units that covers most of the HCV RNA levels encountered in clinical practice. In this study, we investigated the intrinsic and clinical
per-formances of the recently developed Abbottm2000 real-time
PCR system for HCV RNA quantification, which uses the
automated extractorm2000spand them2000rt device for
au-tomated real-time PCR amplification and detection of PCR products (m2000sp-m2000rt; Abbott Diagnostic, Chicago, IL).
MATERIALS AND METHODS
Standards.A standard panel (OptiQuant HCV RNA; AcroMetrix, Benicia, CA) containing different concentrations of HCV RNA from a single source, i.e., an HCV-infected individual with HCV genotype 1b (15), was used to study the analytical performance of the assay. The seven panel members were NAP-000, NAP-HCV5E1, NAP-HCV5E2, NAP-HCV5E3, NAP-HCV5E4, NAP-HCV5E5, and NAP-HBV5E6, which contain no HCV RNA, 5⫻101
IU/ml (1.7 log10IU/ml), 5⫻102IU/ml (2.7 log
10IU/ml), 5⫻103IU/ml (3.7 log10IU/ml), 5⫻104IU/ml (4.7 log10IU/ml), 5⫻10
5
IU/ml (5.7 log10IU/ml), and 5⫻10 6
IU/ml (6.7 log10IU/ml), respectively.
Clinical specimens.Serum samples were obtained from patients followed in the Department of Hepatology and Gastroenterology of Henri Mondor Hospi-tal, Cre´teil, France. Group A comprised 202 HCV-seronegative individuals, i.e., subjects without total anti-HCV antibodies in a third-generation enzyme immu-noassay (Vitros ECi; Ortho-Clinical Diagnostics, Raritan, NJ). Group B com-prised 141 patients with chronic HCV infection, characterized by the presence of both total anti-HCV antibodies and HCV RNA. The HCV genotype was deter-mined in all cases by means of direct sequence analysis of a portion of the nonstructural 5B (NS5B) gene that encodes the RNA-dependent RNA polymer-ase, followed by phylogenetic analysis, as recently described (3). Group B in-cluded 55 patients infected with HCV genotype 1, 21 with genotype 2, 29 with genotype 3, 24 with genotype 4, 9 with genotype 5, and 3 with genotype 6. Serum was separated from whole blood by centrifugation, placed into sterile tubes, and frozen at⫺70°C until it was used in the study. Group C included 10 patients infected with HCV genotype 1, 7 with genotype 2, 8 with genotype 3, 9 with genotype 4, and 1 with genotype 5, whose sera had been tested for HCV RNA with the Cobas Ampliprep/Cobas TaqMan (CAP/CTM) real-time PCR assay (Roche Molecular Systems, Pleasanton, CA).
* Corresponding author. Mailing address: Department of Virology, Hoˆpital Henri Mondor, 51 avenue du Mare´chal de Lattre de Tassigny, 94010 Cre´teil, France. Phone: 33-1-4981-2827. Fax: 33-1-4981-4831. E-mail: [email protected].
䌤Published ahead of print on 15 April 2009.
1726
on May 16, 2020 by guest
http://jcm.asm.org/
Assessment ofm2000sp-m2000rtplatform performance. (i) Analytical sensi-tivity.In order to evaluate the analytical sensitivity of them2000sp-m2000rtassay relative to the manufacturer’s stated lower limit of detection (12 IU/ml), serial 1/2 dilutions of the NAP-HCV5E4 standard down to 6.25 IU/ml were tested 20 times.
(ii) Specificity.The specificity of them2000sp-m2000rtassay was assessed by testing the 202 HCV-seronegative clinical specimens from group A.
(iii) Linearity, accuracy, and influence of the HCV genotype.The linearity of quantification in them2000sp-m2000rtplatform was assessed by testing the seven samples of the standard panel OptiQuant HCV RNA, which contain up to 5⫻ 106IU/ml (6.7 log
10IU/ml). Each panel member dilution was tested six times in the same experiment with them2000sp-m2000rtplatform and three times in the same experiment with the third-generation bDNA-based assay, the Versant HCV RNA 3.0 assay. The average measured values were compared with the expected HCV RNA levels. In addition, serial one-fifth dilutions down to signal extinction were tested in 10 genotype 1, 10 genotype 2, 9 genotype 3, 10 genotype 4, 4 genotype 5, and 3 genotype 6 samples from group B. The dilutions were made with the Nucleic Acid Test dilution matrix (AcroMetrix), a defibrinated, delipidized normal human plasma.
We also compared the results of them2000sp-m2000rtplatform with those obtained for the same samples with the third-generation bDNA-based assay in the 141 samples from group B. The bDNA assay can be confidently used as a comparator, since it has been shown to be precise and accurate and to equally quantify HCV genotypes 1 to 6, due to the use of a set of 6 capture and 17 extender oligonucleotide probes spanning the full-length 5⬘-noncoding region and the 5⬘third of the core coding region for hybridization of the HCV genome (1, 8, 9, 12, 13, 17–19, 24).
Finally, HCV RNA levels obtained with them2000sp-m2000rtplatform were compared with those obtained in the same samples with the CAP/CTM assay and the third-generation bDNA-based assay in the 35 HCV-positive samples from group C.
(iv) Precision and reproducibility.In order to assess precision (or intra-assay reproducibility), each member of the OptiQuant HCV RNA panel was tested six times. In order to assess interassay reproducibility, the low positive control and the high positive control provided in the kits were tested 38 times in correspond-ing runs on different days.
HCV RNA quantification. (i)m2000sp-m2000rt.HCV RNA was extracted from 500l of serum in the automated extractorm2000sp, according to the manufac-turer’s instructions. Them2000rtdevice was then used for automated real-time PCR amplification and detection of PCR products according to the manufactur-er’s instructions. HCV RNA levels were expressed in IU/ml.
(ii) bDNA.In the Versant HCV RNA 3.0 Assay, HCV RNA was recovered from 50l of serum and quantified in the semiautomated System 340 bDNA analyzer (Siemens Medical Solutions Diagnostics, Tarrytown, NY), according to the manufacturer’s instructions. HCV RNA levels were expressed in IU/ml.
(iii) CAP/CTM.HCV RNA was extracted from 850l of serum in the auto-mated Cobas AmpliPrep extractor, according to the manufacturer’s instructions. The Cobas TaqMan 48 Analyzer was used for automated real-time PCR ampli-fication and detection of PCR products. The generated data were analyzed with Amplilink software. HCV RNA levels were expressed in IU/ml.
Statistical analysis.Descriptive statistics are shown as the mean⫾standard deviation (SD) or as medians and interquartile ranges as appropriate. Compar-isons between groups were made using the Kruskall-Wallis test or the
Mann-Whitney test. The relationship between quantitative variables was studied by means of regression analysis.Pvalues of⬍0.05 were considered significant.
RESULTS
Intrinsic performance of them2000sp-m2000rtassay. (i)
An-alytical sensitivity.Serial 1/2 dilutions of a standard containing 50 IU/ml HCV RNA down to 6.25 IU/ml were tested 20 times in different experiments with them2000sp-m2000rt platform. HCV RNA was detected in 20/20, 20/20, 13/20, and 13/20
replicate tests of samples containing 50 IU/ml (1.7 log10IU/
ml), 25 IU/ml (1.4 log10IU/ml), 12.5 IU/ml (1.1 log10IU/ml), and 6.25 IU/ml (0.8 log10IU/ml), respectively. This result was in keeping with the manufacturer’s stated lower limit of detec-tion of the assay (12 IU/ml).
(ii) Specificity.The specificity of them2000sp-m2000rt plat-form was assessed by testing 202 samples from anti-HCV-seronegative patients (group A). No sample tested positive above the lower limit of detection of 12 IU/ml (specificity, 100%; 95% confidence interval, 99 to 100%).
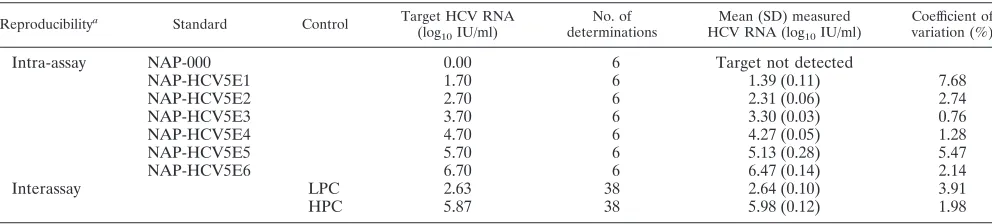
(iii) Precision and reproducibility.Precision (intra-assay re-producibility) was assessed by testing the seven members of the OptiQuant HCV RNA standard that contained 0, 1.7, 2.7, 3.7, 4.7, 5.7, and 6.7 log10IU/ml, respectively, six times in the same experiment. As shown in Table 1, the coefficients of variation varied from 0.76% to 7.68%. Interassay variability was assessed by testing both the high positive control and the low positive control, extracted like clinical samples, 38 times in different experiments. The coefficients of variation were 1.98% and 3.91%, respectively (Table 1).
Accuracy, linear quantification, and influence of the HCV genotype. (i) Linear quantification of standard panel dilu-tions.The OptiQuant HCV RNA genotype 1b standard panel, containing 5⫻101IU/ml (1.7 log
10IU/ml) to 5⫻10
6IU/ml
(6.7 log10IU/ml), was used to assess the linearity of HCV RNA quantification in the m2000sp-m2000rt assay. The panel was tested six times and three times in the same experiments with
the m2000sp-m2000rt platform and bDNA, respectively. As
shown in Fig. 1A, a significant relationship was found between
the average measured and the expected HCV RNA levels (r⫽
0.9980;P⬍0.0001). The difference between the average
mea-sured and the expected HCV RNA levels varied from 0.23 to
0.57 log10 IU/ml. A significant relationship was also found
[image:2.585.44.540.80.192.2]between the average measured and the expected HCV RNA
TABLE 1. Intra-assay (precision) and interassay reproducibility ofm2000sp-m2000rtHCV real-time PCR assay results
Reproducibilitya Standard Control Target HCV RNA
(log10IU/ml)
No. of determinations
Mean (SD) measured HCV RNA (log10IU/ml)
Coefficient of variation (%)
Intra-assay NAP-000 0.00 6 Target not detected
NAP-HCV5E1 1.70 6 1.39 (0.11) 7.68
NAP-HCV5E2 2.70 6 2.31 (0.06) 2.74
NAP-HCV5E3 3.70 6 3.30 (0.03) 0.76
NAP-HCV5E4 4.70 6 4.27 (0.05) 1.28
NAP-HCV5E5 5.70 6 5.13 (0.28) 5.47
NAP-HCV5E6 6.70 6 6.47 (0.14) 2.14
Interassay LPC 2.63 38 2.64 (0.10) 3.91
HPC 5.87 38 5.98 (0.12) 1.98
a
For intra-assay reproducibility, the seven members of the standard panel (NAP-000 to NAP-HCV5E6) containing 0 to 5⫻106
IU/ml, i.e., 6.70 log10IU/ml, respectively, were tested six times in the same experiment. For interassay reproducibility, the assay low positive control (LPC) and high positive control (HPC) were tested 38 times in different experiments.
on May 16, 2020 by guest
http://jcm.asm.org/
levels in the bDNA assay (r⫽0.9997;P⬍0.0001) (Fig. 1B). The difference between the average measured and the
ex-pected HCV RNA levels varied from 0.21 to 0.33 log10IU/ml.
The HCV RNA levels of three standards, 000, NAP-HCV5E1, and NAP-HCV5E2, was below the limit of detection of the bDNA assay (615 IU/ml, i.e., 2.79 log10IU/ml).
(ii) Quantification of HCV RNA in clinical samples contain-ing HCV genotypes 1 to 6.One hundred and forty-one samples from patients with chronic hepatitis C infected with HCV ge-notypes 1 to 6 (group B) (see Materials and Methods) were tested with both them2000sp-m2000rtplatform and the third-generation bDNA assay. All of these samples fell within the dynamic ranges of quantification of both assays. As shown in Fig. 2, there was a significant relationship between the HCV
RNA levels obtained in the same samples with them2000sp
-m2000rtplatform and bDNA for genotypes 1 to 5 (only three
genotype 6 samples were tested). The regression lines were slightly above the expected equality line, as a result of higher values obtained with them2000sp-m2000rtplatform than with bDNA for the same sample in the majority of cases (131 out of 141 clinical specimens tested) (Fig. 2).
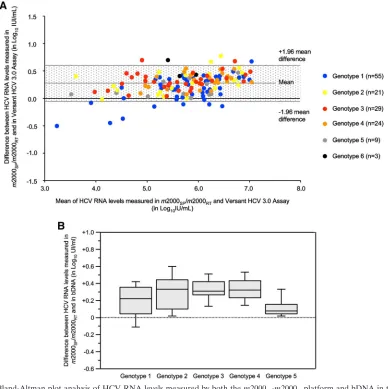
Figure 3A shows a Bland-Altman analysis of the HCV RNA levels measured in the 141 samples from group B by both the
m2000sp-m2000rt platform and bDNA. The figure plots the
difference between the two measured values (the m2000sp
-m2000rtplatform minus bDNA) as a function of the mean of
both measurements. A moderate overestimation of HCV RNA
levels by the m2000sp-m2000rt platform compared to bDNA
was observed in 131 of the 141 samples (92.9%) containing all
HCV genotypes (medianm2000sp-m2000rt minus bDNA
dif-ference, 0.30 log10IU/ml). Six samples (one genotype 1, two
genotype 2, two genotype 4, and one genotype 6) had an
m2000sp-m2000rt minus bDNA difference below⫺1.96 times
the mean difference, whereas eight samples (all of genotype 1) had anm2000sp-m2000rtminus bDNA difference above⫹1.96 times the mean difference. The individual differences between
them2000sp-m2000rtplatform and bDNA, however, were
al-ways below 1.0 log10 IU/ml in these samples. Box plots of
individual differences between the two methods are shown for each genotype in Fig. 3B. They confirm the global, very
mod-erate overestimation of HCV RNA levels in the m2000sp
-m2000rt platform compared to bDNA independent of the
HCV genotype. The median differences were 0.22 log10IU/ml
for genotype 1, 0.33 log10IU/ml for genotype 2, 0.31 log10
IU/ml for genotype 3, 0.32 log10 IU/ml for genotype 4, and
⫺0.08 log10IU/ml for genotype 5 (P⫽0.013). HCV genotype
6 is not shown in Fig. 3B because only three samples were tested.
(iii) Linear quantification of serial dilutions of HCV-in-fected sera.Serial one-fifth dilutions down to signal extinction were tested in 10 genotype 1, 10 genotype 2, 9 genotype 3, 10 genotype 4, 4 genotype 5, and 3 genotype 6 samples from group B. Serial dilution quantification was linear in all cases, what-ever the HCV genotype, with Pearson’s coefficient ranging from 0.9940 to 0.9996 for HCV genotype 1, 0.9930 to 0.9996 for HCV genotype 2, 0.9971 to 0.9996 for HCV genotype 3, 0.9812 to 0.9997 for HCV genotype 4, 0.9938 to 0.9989 for HCV genotype 5, and 0.9975 to 0.9983 for HCV genotype 6. The expected difference between two successive one-fifth
di-lutions is 0.70 log10IU/ml. The mean ⫾ SD differences
be-tween the undiluted sample and the first one-fifth dilution, and
between each dilution and the subsequent one, were 0.81 ⫾
0.12, 0.76⫾0.12, 0.74⫾0.08, 0.77⫾0.13, 0.76⫾0.11, and
0.75⫾0.11, respectively (not significantly different).
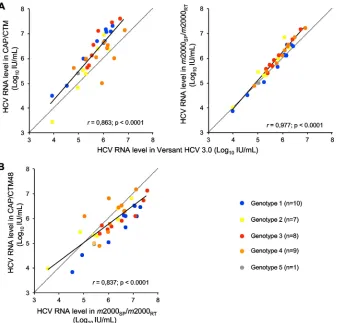
Comparison with CAP/CTM. Sera from 35 patients with chronic HCV infection with different genotypes (group C)
were tested with them2000sp-m2000rt assay, the CAP/CTM
[image:3.585.82.242.69.392.2]assay, and the third-generation bDNA-based assay. Figure 4A shows the better correlation between the m2000sp-m2000rt platform and bDNA than between CAP/CTM and bDNA. The greatest differences between CAP/CTM and bDNA were seen for HCV genotype 2 and 4 samples, as reported previously (4). Figure 4B shows the relationship between HCV RNA levels measured in the same samples by them2000sp-m2000rt plat-form and CAP/CTM.
DISCUSSION
Our assessment of the intrinsic performance of the
m2000sp-m2000rt platform for HCV RNA quantification
shows the excellent specificity, precision, and reproducibility of the technique, in keeping with previous reports (11, 22).
FIG. 1. HCV RNA quantification of a commercial standard panel containing 5⫻101(1.7 log
10) to 5⫻10 6(6.7 log
10) HCV RNA IU/ml
(OptiQuant HCV RNA; AcroMetrix, Benicia, CA) by them2000sp
-m2000rtplatform (top) and bDNA (bottom). The average measured
results are shown as a function of the expected results (solid lines). The dotted lines are the equality lines.
on May 16, 2020 by guest
http://jcm.asm.org/
The manufacturer’s stated lower limit of detection of the assay is 12 IU/ml, as confirmed in the present study.
In clinical samples from patients with chronic hepatitis C infected with the six HCV genotypes, we observed a significant relationship between the HCV RNA levels measured in the
same samples with the m2000sp-m2000rt platform and the
third-generation bDNA assay. The use of the third-generation bDNA assay as the comparator was justified by the fact that the assay is accurate and reproducible, quantifies HCV RNA in-dependently of the HCV genotype, and has been well cali-brated to the World Health Organization (WHO) interna-tional HCV RNA standard, as confirmed in this study (1, 8, 9,
12, 13, 24, 25). The correlation was found for all HCV geno-types (it was not significant for genotype 6, but only three samples could be tested), and the median individual differ-ences between the HCV RNA levels measured in the two assays were below ⫾0.5 log10IU/ml (i.e., a threefold differ-ence) in all but 10 clinical samples.
[image:4.585.125.463.67.543.2]The HCV RNA quantification panel used in this study was calibrated with the WHO international HCV RNA standard by means of the second-generation bDNA assay (15, 21). A minor underestimation of HCV RNA levels was observed with both them2000sp-m2000rtplatform and the third-gen-eration bDNA assay relative to the expected HCV RNA
FIG. 2. Correlation between HCV RNA levels measured by them2000sp-m2000rtplatform and bDNA in the same samples from group B,
consisting of 141 clinical samples containing HCV genotype 1 (A), 2 (B), 3 (C), 4 (D), 5 (E), and 6 (F). The dotted lines are the equality lines.
on May 16, 2020 by guest
http://jcm.asm.org/
values, in spite of a linear relationship. When comparing HCV RNA levels measured in the same individuals by both techniques, we observed a trend toward a modest
overesti-mation of HCV RNA levels in the m2000sp-m2000rt
plat-form compared to the third-generation bDNA in all geno-types except genotype 5. The differences, however, were unlikely to have any impact on the clinical use of the
m2000sp-m2000rtplatform. Importantly, no sample was sub-stantially underquantified in them2000sp-m2000rtreal-time PCR assay relative to bDNA. In contrast, we have shown that another real-time PCR platform for HCV RNA quan-tification, CAP/CTM, underestimates HCV RNA levels in approximately 30% of HCV genotype 4 and 15% of HCV genotype 2 infections as a probable result of mispairing of the PCR primers and/or TaqMan probe (4). We recently reported two patients infected with HCV genotype 4 with undetectable HCV RNA in CAP/CTM and high viral levels in them2000sp-m2000rtplatform and bDNA (5). When
test-ing the same patients’ samples with the m2000sp-m2000rt
platform, CAP/CTM, and bDNA in the present study, we
observed better accuracy of the m2000sp-m2000rt platform
than CAP/CTM for HCV RNA quantification, especially for HCV genotype 2 and 4 samples.
We tested serial dilutions of clinical samples of the different genotypes. Quantification was linear in all cases, whatever the HCV genotype. This is unlike the CAP/CTM assay, in which we found that HCV RNA levels were overestimated in undi-luted clinical samples, but not when the same samples were tested after dilution, a phenomenon observed with all six HCV genotypes (4). These findings explain the greater overestima-tion of HCV RNA levels relative to bDNA in CAP/CTM than with them2000sp-m2000rt platform. The molecular basis for the HCV RNA overestimation by CAP/CTM in undiluted samples is unknown. We hypothesized a biochemical interac-tion with a blood component during one of the reacinterac-tion steps, an interaction that vanishes when the concentration of this
FIG. 3. (A) Bland-Altman plot analysis of HCV RNA levels measured by both them2000sp-m2000rtplatform and bDNA in the 141 samples
from group B. The difference between HCV RNA levels measured by them2000sp-m2000rtplatform and bDNA is represented as a function of
the mean of the two values. Different genotypes are represented by different colors. The gray area corresponds to the mean difference⫾1.96 SD. (B) Distribution of the differences between HCV RNA levels measured in them2000sp-m2000rtplatform and bDNA in the same samples according
to the HCV genotype (1 to 5). The results are presented as box plots, where the horizontal line represents the median value, the gray boxes the 50th percentiles, and the upper and lower bars the 95th percentiles.
on May 16, 2020 by guest
http://jcm.asm.org/
[image:5.585.100.488.69.458.2]putative component is reduced in diluted samples (4). The results of the present study suggest that this putative interac-tion does not occur during them2000sp-m2000rtreaction.
In conclusion, our study shows that the Abbottm2000
real-time PCR system for HCV RNA quantification (them2000sp
-m2000rt platform) is sensitive, specific, and precise; that the results are reproducible; and that its broad dynamic range of quantification is well suited to HCV RNA monitoring in the clinical setting. This is particularly important in the current clinical context. Indeed, novel therapeutic strategies that in-clude HCV protease and polymerase inhibitors will require sensitive and accurate assays with a broad dynamic range of quantification to monitor the virological responses and to tai-lor treatment in order to prevent resistance.
ACKNOWLEDGMENTS
Them2000sp-m2000rtkits used in this study were kindly provided by
Abbott Molecular Diagnostics (Rungis, France).
This work is part of the activity of the VIRGIL European Network of Excellence on Antiviral Drug Resistance supported by a grant (LSHM-CT-2004-503359) from the Priority 1 Life Sciences, Genomics and Biotechnology for Health program in the Sixth Framework Pro-gramme of the European Union.
We are grateful to Franc¸oise Darthuy and Guillaume Dameron for helpful technical assistance.
REFERENCES
1.Beld, M., R. Sentjens, S. Rebers, C. Weegink, J. Weel, C. Sol, and R. Boom.
2002. Performance of the New Bayer Versant HCV RNA 3.0 assay for quantitation of hepatitis C virus RNA in plasma and serum: conversion to international units and comparison with the Roche Cobas Amplicor HCV Monitor, version 2.0, assay. J. Clin. Microbiol.40:788–793.
2.Berg, T., M. von Wagner, S. Nasser, C. Sarrazin, T. Heintges, T. Gerlach, P. Buggisch, T. Goeser, J. Rasenack, G. R. Pape, W. E. Schmidt, B. Kalli-nowski, H. Klinker, U. Spengler, P. Martus, U. Alshuth, and S. Zeuzem.
2006. Extended treatment duration for hepatitis C virus type 1: comparing 48 versus 72 weeks of peginterferon-alfa-2a plus ribavirin. Gastroenterology
130:1086–1097.
3.Bronowicki, J. P., D. Ouzan, T. Asselah, H. Desmorat, J. P. Zarski, J. Foucher, M. Bourlie`re, C. Renou, A. Tran, P. Melin, C. He´zode, M. Chev-allier, M. Bouvier-Alias, S. Chevaliez, F. Montestruc, I. Lonjon-Domanec, and J. M. Pawlotsky.2006. Effect of ribavirin in genotype 1 patients with hepatitis C responding to pegylated interferon alpha-2a plus ribavirin com-bination. Gastroenterology131:1339–1341.
4.Chevaliez, S., M. Bouvier-Alias, R. Brillet, and J. M. Pawlotsky.2007. Overestimation and underestimation of hepatitis C virus RNA levels in a widely used real-time polymerase chain reaction-based method. Hepatol-ogy46:22–31.
5.Chevaliez, S., M. Bouvier-Alias, L. Caste´ra, and J. M. Pawlotsky.2009. The Cobas Ampliprep-Cobas Taqman real-time polymerase chain reaction assay fails to detect hepatitis C virus RNA in highly viremic genotype 4 clinical samples. Hepatology49:1397–1398.
6.Dalgard, O., K. Bjoro, K. B. Hellum, B. Myrvang, S. Ritland, K. Skaug, N. Raknerud, and H. Bell.2004. Treatment with pegylated interferon and ribavarin in HCV infection with genotype 2 or 3 for 14 weeks: a pilot study. Hepatology40:1260–1265.
[image:6.585.126.468.68.391.2]7.Davis, G. L., J. B. Wong, J. G. McHutchison, M. P. Manns, J. Harvey, and J. Albrecht.2003. Early virologic response to treatment with peginterferon
FIG. 4. Correlation between HCV RNA levels measured by CAP/CTM and bDNA (left) and by them2000sp-m2000rtplatform and bDNA
(right) (A), and in CAP/CTM and them2000sp-m2000rtplatform (B) in the same samples from group C, consisting of 35 clinical samples containing
HCV genotypes 1 to 5. The dotted lines are the equality lines.
on May 16, 2020 by guest
http://jcm.asm.org/
alfa-2b plus ribavirin in patients with chronic hepatitis C. Hepatology38:
645–652.
8.Elbeik, T., N. Markowitz, P. Nassos, U. Kumar, S. Beringer, B. Haller, and V. Ng.2004. Simultaneous runs of the Bayer Versant HIV-1 version 3.0 and HCV bDNA version 3.0 quantitative assays on the system 340 platform provide reliable quantitation and improved work flow. J. Clin. Microbiol.
42:3120–3127.
9.Elbeik, T., J. Surtihadi, M. Destree, J. Gorlin, M. Holodniy, S. A. Jortani, K. Kuramoto, V. Ng, R. Valdes, Jr., A. Valsamakis, and N. A. Terrault.2004. Multicenter evaluation of the performance characteristics of the Bayer Ver-sant HCV RNA 3.0 assay (bDNA). J. Clin. Microbiol.42:563–569. 10.Ferenci, P., M. W. Fried, M. L. Shiffman, C. I. Smith, G. Marinos, F. L.
Goncales, Jr., D. Haussinger, M. Diago, G. Carosi, D. Dhumeaux, A. Craxi, M. Chaneac, and K. R. Reddy.2005. Predicting sustained virological re-sponses in chronic hepatitis C patients treated with peginterferon alfa-2a (40 KD)/ribavirin. J. Hepatol.43:425–433.
11.Fytili, P., C. Tiemann, C. Wang, S. Schulz, S. Schaffer, M. P. Manns, and H. Wedemeyer.2007. Frequency of very low HCV viremia detected by a highly sensitive HCV-RNA assay. J. Clin. Virol.39:308–311.
12.Germer, J. J., P. J. Heimgartner, D. M. Ilstrup, W. S. Harmsen, G. D. Jenkins, and R. Patel.2002. Comparative evaluation of the Versant HCV RNA 3.0, Quantiplex HCV RNA 2.0, and Cobas Amplicor HCV Monitor version 2.0 assays for quantification of hepatitis C virus RNA in serum. J. Clin. Microbiol.40:495–500.
13.Hendricks, D. A., M. Friesenhahn, L. Tanimoto, B. Goergen, D. Dodge, and L. Comanor.2003. Multicenter evaluation of the Versant HCV RNA qual-itative assay for detection of hepatitis C virus RNA. J. Clin. Microbiol.
41:651–656.
14.Jensen, D. M., T. R. Morgan, P. Marcellin, P. J. Pockros, K. R. Reddy, S. J. Hadziyannis, P. Ferenci, A. M. Ackrill, and B. Willems.2006. Early identi-fication of HCV genotype 1 patients responding to 24 weeks peginterferon alpha-2a (40 kd)/ribavirin therapy. Hepatology43:954–960.
15.Jorgensen, P. A., and P. D. Neuwald.2001. Standardized hepatitis C virus RNA panels for nucleic acid testing assays. J. Clin. Virol.20:35–40. 16.Mangia, A., R. Santoro, N. Minerva, G. L. Ricci, V. Carretta, M. Persico, F.
Vinelli, G. Scotto, D. Bacca, M. Annese, M. Romano, F. Zechini, F. Sogari, F. Spirito, and A. Andriulli.2005. Peginterferon alfa-2b and ribavirin for 12 vs. 24 weeks in HCV genotype 2 or 3. N. Engl. J. Med.352:2609–2617.
17.Morishima, C., M. Chung, K. W. Ng, D. J. Brambilla, and D. R. Gretch.
2004. Strengths and limitations of commercial tests for hepatitis C virus RNA quantification. J. Clin. Microbiol.42:421–425.
18.Pawlotsky, J. M.2002. Molecular diagnosis of viral hepatitis. Gastroenter-ology122:1554–1568.
19.Pawlotsky, J. M.2002. Use and interpretation of virological tests for hepa-titis C. Hepatology36:S65–S73.
20.Pawlotsky, J. M., S. Chevaliez, and J. G. McHutchison.2007. The hepatitis C virus life cycle as a target for new antiviral therapies. Gastroenterology
132:1979–1998.
21.Saldanha, J., N. Lelie, and A. Heath.1999. Establishment of the first inter-national standard for nucleic acid amplification technology (NAT) assays for HCV RNA. Vox Sang.76:149–158.
22.Schutten, M., E. Fries, C. Burghoorn-Maas, and H. G. Niesters.2007. Evaluation of the analytical performance of the new Abbott RealTime RT-PCRs for the quantitative detection of HCV and HIV-1 RNA. J. Clin. Virol.
40:99–104.
23.Shiffman, M. L., F. Suter, B. R. Bacon, D. Nelson, H. Harley, R. Sola, S. D. Shafran, K. Barange, A. Lin, A. Soman, and S. Zeuzem.2007. Peginterferon alpha-2a and ribavirin for 16 or 24 weeks in HCV genotype 2 or 3. N. Engl. J. Med.357:124–134.
24.Trimoulet, P., P. Halfon, E. Pohier, H. Khiri, G. Chene, and H. Fleury.2002. Evaluation of the Versant HCV RNA 3.0 assay for quantification of hepatitis C virus RNA in serum. J. Clin. Microbiol.40:2031–2036.
25.Tsongalis, G. J.2006. Branched DNA technology in molecular diagnostics. Am. J. Clin. Pathol.126:448–453.
26.von Wagner, M., M. Huber, T. Berg, H. Hinrichsen, J. Rasenack, T. Hein-tges, A. Bergk, C. Bernsmeier, D. Haussinger, E. Herrmann, and S. Zeuzem.
2005. Peginterferon-alpha-2a (40KD) and ribavirin for 16 or 24 weeks in patients with genotype 2 or 3 chronic hepatitis C. Gastroenterology129:522– 527.
27.Zeuzem, S., M. Buti, P. Ferenci, J. Sperl, Y. Horsmans, J. Cianciara, E. Ibranyi, O. Weiland, S. Noviello, C. Brass, and J. Albrecht.2006. Efficacy of 24 weeks treatment with peginterferon alfa-2b plus ribavirin in patients with chronic hepatitis C infected with genotype 1 and low pretreatment viremia. J. Hepatol.44:97–103.