Open Access
Vol 11 No 4Research article
Flow cytometry analysis of glucocorticoid receptor expression and
binding in steroid-sensitive and steroid-resistant patients with
systemic lupus erythematosus
Juan Du
1*, Min Li
2*, Denghai Zhang
1, Xiaoyan Zhu
3, Weiwei Zhang
4, Wei Gu
1, Yinglu Feng
1,
Xiaofeng Zhai
1and Changquan Ling
11Department of Integrative Medicine, Changhai Hospital, The Second Military Medicine University, No.168 Changhai Road, Shanghai, PR China 2Department of Naval Medicine, The Second Military Medicine University; No.800 Xiangyin Road, Shanghai, PR China
3Department of physiology, The Second Military Medicine University; No.800 Xiangyin Road, Shanghai, PR China
4Department of Medical Technology, Changhai Hospital, The Second Military Medicine University, No.168 Changhai Road, Shanghai, PR China
* Contributed equally
Corresponding author: Changquan Ling, [email protected]
Received: 9 Jan 2009 Revisions requested: 9 Feb 2009 Revisions received: 9 May 2009 Accepted: 14 Jul 2009 Published: 14 Jul 2009
Arthritis Research & Therapy 2009, 11:R108 (doi:10.1186/ar2763) This article is online at: http://arthritis-research.com/content/11/4/R108 © 2009 Du et al.; licensee BioMed Central Ltd.
This is an open access article distributed under the terms of the Creative Commons Attribution License (http://creativecommons.org/licenses/by/2.0), which permits unrestricted use, distribution, and reproduction in any medium, provided the original work is properly cited.
Abstract
Introduction Glucocorticoid (GC) therapy is the main treatment for systemic lupus erythematosus (SLE). However, some patients are resistant to these agents. Abnormalities of glucocorticoid receptor (GR) seem to be related to steroid resistance. This study evaluated GRs in T lymphocytes and monocytes of SLE patients by flow cytometry (FCM) using a monoclonal antibody (mAb) and FITC-Dex probes.
Methods Thirty-five patients with SLE before treatment and 27 age- and sex-matched normal controls were studied. Disease activity scores were determined before and after treatment and used to divide the patients into steroid-resistant (SR) and steroid-sensitive (SS) groups. GRs in T lymphocytes (CD3+) and monocytes (CD14+) were examined by FCM with GR-mAb and FITC-Dex probes before treatment. Peripheral blood mononuclear cells (PBMCs) were isolated for in vitro GCs sensitivity assays. The validity of FCM analysis of intracellular staining for GR with GR-mAb and FITC-Dex probes was evaluated through comparison with western blot and radioligand binding assay (RLBA) in U937 and K562 cells in vitro. One-way ANOVA, student's t test, linear regression and spearman correlation were performed.
Results A significant decrease in GR binding and the expression in K562 and U937 cells with 10-6 M dexamethasone (Dex) was found compared with those without Dex. In addition, a positive correlation was found between FCM and RLBA as well as FCM and Western blot. The expression and binding of both CD3/GR and CD14/GR in SR patients with SLE, detected by FCM, were all lower than those in SS patients with SLE, whereas there was no significant difference in SS patients and controls. In vitro corticosteroid sensitivity assay indicated that PHA-stimulated tumour necrosis factor-α (TNF-α), IL-12 and interferon-γ (IFN-γ) secretion was significantly inhibited by 10-6 M Dexamethasone in all controls and SS patients, compared with that in SR group, which confirms patient classification as SR and SS by disease activity index (SLEDAI) score.
Conclusions Abnormalities of expression and binding of the GR may be involved in tissue resistance to steroids in SLE patients. Determination of GR expression and binding by FCM may be useful in predicting the response to steroid treatment of SLE patients.
Trial registration Clinical trial registration number NCT00600652.
Introduction
Glucocorticoids (GCs) are commonly used to treat autoim-mune diseases such as nephrotic syndrome and systemic lupus erythematosus (SLE). However, there are so-called 'steroid-resistant' (SR) patients who fail to respond to treat-ment with GCs [1-3], the pathogenic mechanism of which is not fully understood. Glucocorticoid receptor (GR) seems to be related to the pathogenesis of steroid resistance, but the amount of GR in cells changes in different pathological states [4-9]. It was reported that lower GR binding affinity of periph-eral blood mononuclear cells (PBMCs) correlated with a decreased responsiveness to treatment in patients with asthma as determined by a radioligand binding assay [4,5]. Also, in a cohort of 54 children with acute lymphoblastic leu-kaemia, lower expression of the GR detected by real-time PCR was associated with in vitro prednisolone resistance [6]. In contrast, two other studies suggested that the level of GR expression as assessed by western blot is not linked to in vivo
or in vitro steroid response in children with acute lymphoblas-tic leukaemia [7,8].
The reasons for the aforementioned discrepancies between expression and binding capacity of GR and GC treatment sen-sitivity are complex, but one problem may lie in previous detec-tion methods. Until now, the GR expression and binding have mainly been detected through western blot and radiolabelled receptor ligands (RLBA) in whole blood or PBMCs [4,5,7-11]. Such methods can not evaluate the GR expression or binding in individual cell types. Because GR expression and binding are different in respect to blood cell type, the variation in cell type percentages in different patients could prohibit reliable evaluation of the role of GR expression and binding with regard to hormone sensitivity [12]. It is important to discrimi-nate between different cell types in evaluating response to steroid therapy.
Flow cytometry (FCM) is able to distinguish individual cells by size, cytoplasmic granularity and positive or negative expres-sion of different receptors using fluorochromes conjugated to antibodies that recognise the proteins of interest [13,14]. Moreover with anti-GR monoclonal antibody (mAb) and fluo-rescein isothiocyanate (FITC) labelled dexamethasone (Dex) probes, FCM has the potential to detect the expression and binding of GR at the same time. It has been reported that high levels of GR expression do not always indicate a good response to treatment with GCs [15]. Similar observations have been made in studies of patients with ulcerative colitis [16-18]. The cause has not yet been explained. One possibility is that cytokines may play a role in steroid resistance by reduc-ing the affinity of GR [19]. Therefore the detection of GR uti-lizing different modalities may be helpful to predict resistance to GCs therapy and to provide insight into potential mecha-nisms. To date, there have been only a few reports that attempt
to correlate GR levels or binding with steroid response in patients with asthma, idiopathic nephritic syndrome and ulcer-ative colitis. However, there are few articles available in the lit-erature concerning the significance of GR in assessing responsiveness to steroid therapy in SLE patients.
SLE is an autoimmune disorder that includes abnormalities in T lymphocytes, as well as hyperreactive B cells that produce autoantibodies. Recent studies supposed that monocytes, which produce IFN-α, might be involved in the pathogenesis of SLE [20]. Abnormal immunocytes contribute to the imbal-ance of cytokine homeostasis involved in immune dysregula-tion observed in SLE patients. Some studies have reported that IFN-γ, TNF-α, IL-6 and IL-12 were higher in SLE patients compared with normal controls [21-23]. Moreover, cytokines may play a significant role in steroid resistance [19]. In vitro
Dex inhibition of Con-A-stimulated cytokine release has been used to examine the effect of corticosteroid in idiopathic nephritic syndrome [10]. GC therapy is essential for improving the pathologic state of patients with SLE. GRs are targets of GCs in moderating the immune disease. Therefore, the sensi-tivity of GRs in T lymphocytes and monocytes may account, in part, for the immunosuppressive efficacy of GCs. In the present study we evaluated the expression and binding of GR by FCM with GR-mAb and FITC-Dex probes in T lymphocytes (CD3+) and monocytes (CD14+) from SLE patients before GC therapy. In order to confirm patient classification as SR and steroid sensitive (SS) by SLE Disease Activity Index (SLEDAI) clinical score, the in vitro corticosteroid sensitivity assay was utilized.
Materials and methods
Patients and controls
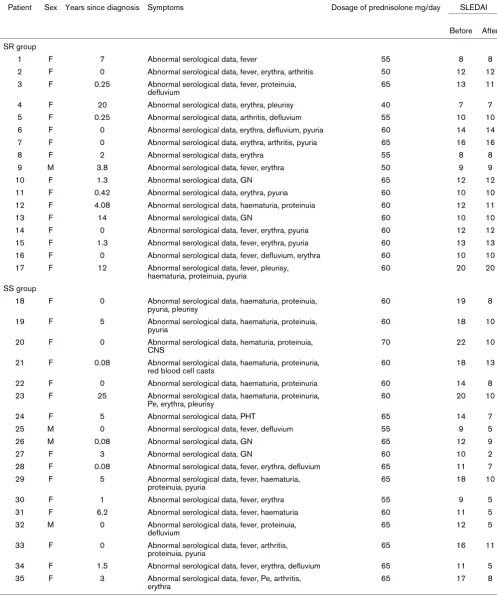
pred-Table 1
Characteristics of 35 patients with systemic lupus erythematosus
Patient Sex Years since diagnosis Symptoms Dosage of prednisolone mg/day SLEDAI
Before After
SR group
1 F 7 Abnormal serological data, fever 55 8 8
2 F 0 Abnormal serological data, fever, erythra, arthritis 50 12 12
3 F 0.25 Abnormal serological data, fever, proteinuia, defluvium
65 13 11
4 F 20 Abnormal serological data, erythra, pleurisy 40 7 7
5 F 0.25 Abnormal serological data, arthritis, defluvium 55 10 10
6 F 0 Abnormal serological data, erythra, defluvium, pyuria 60 14 14
7 F 0 Abnormal serological data, erythra, arthritis, pyuria 65 16 16
8 F 2 Abnormal serological data, erythra 55 8 8
9 M 3.8 Abnormal serological data, fever, erythra 50 9 9
10 F 1.3 Abnormal serological data, GN 65 12 12
11 F 0.42 Abnormal serological data, erythra, pyuria 60 10 10
12 F 4.08 Abnormal serological data, haematuria, proteinuia 60 12 11
13 F 14 Abnormal serological data, GN 60 10 10
14 F 0 Abnormal serological data, fever, erythra, pyuria 60 12 12
15 F 1.3 Abnormal serological data, fever, erythra, pyuria 60 13 13
16 F 0 Abnormal serological data, fever, defluvium, erythra 60 10 10
17 F 12 Abnormal serological data, fever, pleurisy, haematuria, proteinuia, pyuria
60 20 20
SS group
18 F 0 Abnormal serological data, haematuria, proteinuia, pyuria, pleurisy
60 19 8
19 F 5 Abnormal serological data, haematuria, proteinuia, pyuria
60 18 10
20 F 0 Abnormal serological data, hematuria, proteinuia, CNS
70 22 10
21 F 0.08 Abnormal serological data, haematuria, proteinuria, red blood cell casts
60 18 13
22 F 0 Abnormal serological data, haematuria, proteinuria 60 14 8
23 F 25 Abnormal serological data, haematuria, proteinuria, Pe, erythra, pleurisy
60 20 10
24 F 5 Abnormal serological data, PHT 65 14 7
25 M 0 Abnormal serological data, fever, defluvium 55 9 5
26 M 0.08 Abnormal serological data, GN 65 12 9
27 F 3 Abnormal serological data, GN 60 10 2
28 F 0.08 Abnormal serological data, fever, erythra, defluvium 65 11 7
29 F 5 Abnormal serological data, fever, haematuria, proteinuia, pyuria
65 18 10
30 F 1 Abnormal serological data, fever, erythra 55 9 5
31 F 6.2 Abnormal serological data, fever, haematuria 60 11 5
32 M 0 Abnormal serological data, fever, proteinuia, defluvium
65 12 5
33 F 0 Abnormal serological data, fever, arthritis, proteinuia, pyuria
65 16 11
34 F 1.5 Abnormal serological data, fever, erythra, defluvium 65 11 5
35 F 3 Abnormal serological data, fever, Pe, arthritis, erythra
65 17 8
[image:3.612.57.554.119.714.2]nisolone before study entry did not differ significantly between the SR and SS groups (Table 2). Normal controls and the two SLE groups are matched with respect to age and sex. Among the patients, 22 with relapsed disease (10 SR patients and 12 SS patients) took no other drugs in remission except for phys-iological doses of glucocorticoids (prednisone 5 mg/day orally). The expression and binding of GR as mean fluores-cence intensity (MFI) of lymphocytes (CD3/GR) and mono-cytes (CD14/GR) containing receptors was determined as described by Marchetti and colleagues [27] in 200 μL fresh anticoagulated (heparinised) blood samples. Other blood samples were used for PBMC isolation. This prospective study was approved by the institutional review board for human research and informed consent was obtained from all subjects. The trial registration number is NCT00600652.
GR-mAb-FCM analysis for the expression of GR
Phycoerythrin-CY5 (PE-CY5)-labelled antihuman CD3 and allophycocyanin (APC)-labelled CD14 mAbs (ebioscience, San Diego, CA, USA) were used for cell surface staining. Anti-GR mAb (abcam, Cambridge, UK; Mouse monoclonal (3D5) to Human Glucocorticoid Receptor, amino acid 150 to 175) and anti-mouse IgG-FITC (caltag, Burlingame, CA, USA) were used for the detection of GR. FITC-labelled mouse IgG1 iso-type control (abcam, Cambridge, UK) was used for the control samples. A sample of 100 μL whole blood with an appropriate concentration of anti-CD3-PE-CY5 (10 μL) or anti-CD14-APC mAb (10 μL) or mouse IgG1 was incubated for 20 minutes at room temperature. Then the erythrocytes were lysed for 10 minutes with FACS lysing solution (Becton Dickinson, Franklin Lakes, NJ, USA). Cells were washed with PBS and fixed in 100 μL of 4% buffered paraformaldehyde (fixation buffer, ebi-oscience, San Diego, CA, USA) for 30 minutes at 4°C. Non-specific binding site was blocked with 5% normal goat serum containing permeabilisation buffer for 30 minutes. The cells were then incubated with 100 μL permeabilisation buffer con-taining 4 × 10⁻⁴ mg of anti-GR mAb or mouse IgG1 at 4°C for 60 minutes, washed twice in permeabilisation buffer, and then incubated with 100 μL permeabilisation buffer containing 2.5 × 10⁻³ mg of goat anti-mouse IgG-FITC for 30 minutes. After extensive washing with permeabilisation buffer to remove unbound secondary antibodies, the cells pellets were resus-pended in 300 μL fixation buffer.
FITC-Dex-FCM analysis for the binding of GR
The protocol for surface staining and erythrocyte lysis were similar to analysis for the expression of GR above. Cell pellets were resuspended in 100 μL PBS containing 2 × 10⁻⁸ M FITC-Dex (Molecular Probe®, Invitrogen, Carlsbad, CA, USA) for 60 minutes at 37°C in the dark with gentle mixing every 10 min-utes. As controls, another tube was prepared adding a 500-fold excess amount of unlabelled Dex (sigma, Shanghai, China) 10 minutes before FITC-Dex. Finally, cells were washed twice and resuspended in 300 μL fixation buffer.
Cell samples were run on a FACSCalibur flow cytometer (Bec-ton Dickinson, Franklin Lakes, NJ, USA) and analysed by CEL-LQuest software. At least 20,000 events in the light-scatter (SSC/FSC) lymphocyte and 8000 events in the light-scatter (SSC/FSC) monocyte region were acquired. CD3+ and CD14+ populations were identified and gated on PE-CY5 or APC plots. The relative quantity of GR (mean GR fluores-cence) was expressed as MFI. The instrument calibration was performed daily by FACSComp software using CaliBRITE™3 beads.
Optimal dilution of probes used in FCM was obtained by com-paring different dilutions. The majority of the unfixed cells were viable by propidium Iodide (PI) (50 μg/mL) staining (≥ 98%, data not shown). The specificity of staining in FCM was estab-lished by using non-specific mouse IgG1 and unlabelled Dex.
Additionally, to evaluate the reproducibility of FCM analysis of GR, GR expression and binding in T lymphocytes and mono-cytes from three normal young men were determined in three independent experiments. The blood samples were obtained at the same time of day on three different days. No significant differences were found among three experiments (data not shown).
In vitro corticosteroid sensitivity assay
[image:4.612.52.558.635.706.2]To perform the in vitro steroid sensitivity assay we measured the inhibitory effect of Dex on phytohaemagglutinin (PHA)-stimulated cytokines. PBMCs (2 × 10⁶ cells per well), isolated from 4.8 mL anticoagulated blood of normal controls and SLE patients by Ficoll-Hypaque density-gradient centrifugation (Pharmacia, Piscataway, NJ, USA), were plated onto 96-well
Table 2
Comparison of characteristics among patients with SLE grouped according to steroid treatment response and normals* Group n Gender (M/F) Age, years Years since diagnosis Relapse First treatment Dosage of prednisolone
mg/day
SR 17 1/16 34.4 ± 11.9 4 ± 6 10 7 57.6 ± 6.4
SS 18 3/15 39.7 ± 12.6 3 ± 6 12 6 62.1 ± 3.9
Normal 27 4/23 35.8 ± 13.3 - - -
flat-bottomed plates (Corning, NY, USA) in triplicate and cul-tured at 37°C in the presence of 5% carbon dioxide. PHA at the dose of 10 μg/mL was used to stimulate the cells in the presence or absence of 10-6 M of Dex. After 48 hours of cul-ture, supernatants were collected and stored at -80°C for measurement of IL-12, TNF-α and IFN-γ levels by ELISA (ebi-oscience, San Diego, CA, USA). The minimum limits of detec-tion for IFN-γ, IL-12 p40 and TNF-α were 8, 80 and 8 pg/mL, respectively.
Percent inhibition of cytokine secretion by steroid was calcu-lated using the following formula [10]:
where x = cytokine secretion in Dex and PHA, n = cytokine secretion in RPMI alone, y = cytokine secretion in PHA alone. By using this calculation, the variations for cytokine secretion among and within individuals at different times were compen-sated.
Comparion FCM analysis of GR with western blot and RLBA in vitro
Both human erythroleukaemia cell line K562 and monocytic/ macrophage cell lineU937 were cultured in RPMI-1640 (GIBCO, Los Angeles, CA, USA) supplemented with 10% v/ v FCS (PAA, Cölbe, Germany). To avoid interference from GCs compounds existing in FCS, cells were cultured in RPMI-1640 without phenol red (GIBCO, Los Angeles, CA, USA) two days before the experiment, which was supplemented with 10% v/v FCS-depleted of endogenous steroids (GIBCO, Los Angeles, CA, USA). Cells were seeded at a density of 300,000 cells per well in six-well flat-bottomed culture plates in triplicate and cultured in the presence or absence of 10-6 M Dex after reaching confluence. After 48 hours of culture, cells were harvested by replacing the growth medium with RPMI-1640 without phenol red and collected by centrifugation at 500 g for five minute. Each cell pellet was then resuspended in 50 mL unsupplemented Joklik's media (250-fold dilution) at 25°C and allowed to sit for 10 to 20 minutes. This procedure was repeated, and finally each group was resuspended in 1.0 mL of unsupplemented Joklik's medium for cell count. This washing procedure removes most unlabelled Dex from the cells effectively. Intracellular staining for GR expression and binding was assessed by FCM as described above. At the same time, western blot and RLBA were performed as previ-ously described [28,29].
Statistics
One-way analysis of variance (ANOVA) was used to assess group differences in the GR expression and binding (mean ± standard error of the mean). For heterogeneity of variance, Kruskal-Wallis H test and Memenyi test were used. Age, gen-der, dosage of prednisolone and years since diagnosis were used as covariates. Student's t test and one-way ANOVA were
used to assess cytokines measurements. Linear regression was used to assess correlation of results of GR detected by different methods. Spearman correlation was used to com-pare cytokine inhibition to the levels of GR or binding activity. SPSS version 15.0 (SPSS Inc, Chicago, IL, USA) was used for the analysis.
Results
Evaluation of FCM analysis of GR
In several tissues and cultured cells lines, administration of a GR agonist results in a significant down-regulation of GR. This result has been demonstrated in vitro by whole cell ligand-binding assays and western-blot in HeLa and COS-1 cells as well as cultured lymphocytes [30-32]. To evaluate FCM analy-sis of GR, we compared the result determined by FCM with that by RLBA and western blot using the model described above.
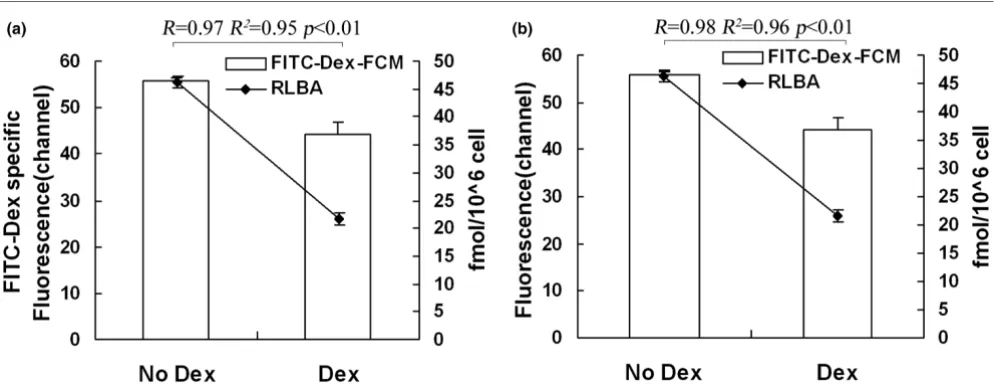
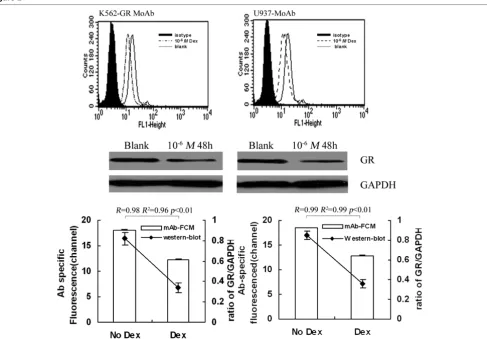
By FCM and RLBA, GR binding in K562 and U937 pretreated with 10-6 M Dex decreased significantly (P < 0.01) compared with that without Dex, and a positive correlation was found between the two techniques (FITC-Dex FCM and RLBA, R2 = 0.95, R2 = 0.96, P < 0.01; Figure 1). Similarly, by GR-mAb-FCM and western blot, GR expression in K562 and U937 pre-treated with Dex decreased significantly (P < 0.01) compared with that without Dex, and a positive correlation existed between the two techniques (R2 = 0.96, R2 = 0.99, P < 0.01; Figure 2).
GR expression and binding of lymphocytes (CD3/GR) and monocytes (CD14/GR) in SLE patients and controls
Disease activity scores were determined before and after ster-oid treatment (Table 1) and the SLE patients were divided into the SR and the SS groups accordingly. GR expression and binding in T lymphocytes (CD3/GR) and monocytes (CD14/ GR) of SR, SS patients and controls were measured by FCM before treatment. The results showed that the percentage of GR-positive T lymphocytes and monocytes were 71.2 ± 13.4% and 46.2 ± 19.1%, respectively, in SR group, which did not differ significantly from the results of the SS group and the normal control group (P > 0.05, Figure 3a). The percent-age of GR binding positive cells in detected cells was also similar among the SR, SS and normal control groups (P > 0.05; Figure 3b).
However, GR expression in T lymphocytes (CD3/GR) and monocytes (CD14/GR) in the SR group were significantly lower than that in the SS and control group (P < 0.01; Figure 4a). There was no significant difference between GR expres-sion in SS patients and that in normal controls (P > 0.05; Fig-ure 4a). We also compared GR binding capacities among these three groups (Figure 4b). The results showed that GR binding in T lymphocytes (CD3+) in SR patients was signifi-cant lower than those in SS patients, which was lower than those in normal controls (P < 0.01). In monocytes (CD14+),
GC binding in SR patients was significant lower than in SS patients (P < 0.01), which was no difference from those of normal controls (P > 0.05).
Inhibition of cytokine secretion in SR and SS groups
We obtained PBMCs from 35 patients with SLE and normal controls before steroid therapy. Cytokine levels were meas-ured in the supernatant collected from fresh cultmeas-ured PBMCs in the basal condition and after stimulation with PHA alone or PHA plus 10-6 M Dex. PHA-stimulated PBMCs increased TNF-α, IL-12 and IFN-γ secretion significantly compared with the basal production in the control (P < 0.01) and SLE groups (P < 0.01). The percentage inhibition of TNF-α, IL-12 and
IFN-γ secretion after Dex in the controls, SS and SR patients are shown in Figure 5. With the 10-6 M Dex treatment in vitro, TNF-α, IL-12 and IFN-γ secretion in the control and SS groups were significantly inhibited (P < 0.01). In contrast, the percentage inhibition of TNF-α, IL-12 and IFN-γ secretion were signifi-cantly lower in SR patients than those in SS and control groups (P < 0.01).
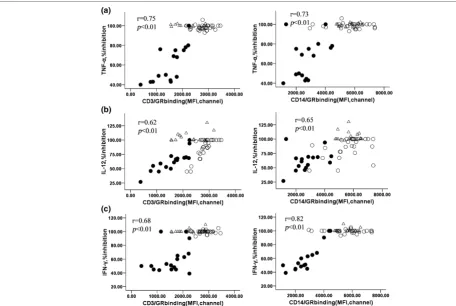
Moreover, the percentage inhibition of TNF-α, IL-12 and IFN-γ secretion in an in vitro corticosteroid assay were positively correlated with GR binding in T lymphocytes (CD3+) (r = 0.75, 0.62, 0.68, respectively) and monocytes (CD14+) (r = 0.73, 0.65, 0.82, respectively) of control, SS and SR groups (P < 0.01; Figure 6). Interestingly, there was no correlation between the inhibition of cytokine and GR expression (P > 0.05, data not shown).
Discussion
It is known that GC therapy is the treatment of choice for patients with SLE. However some patients fail to respond to the treatment even when given high-dose GCs. For those patients, the treatment should be bolstered by synergising GCs with other immunosuppressants. If clinical response was predicted before therapy, synergised treatment might be per-formed at the beginning of the treatment to avoid side effects of chronic high-dose hormone therapy, which could improve the individual response to GC therapy and benefit more patients. GR seems to be related to the pathogenesis of ster-oid resistance. Thus, we hypothesised that detection of GR by a suitable method before treatment might be used to predict steroid response.
[image:6.612.60.557.95.287.2]In the present study, we detected GR in PBMCs in SLE patients by FCM with GR-mAb and FITC-Dex probes, com-bined with cell surface staining for CD3 and CD14. Character-istics of patients, including age, male/female ratio, doses of prednisolone, disease history, etc, between SR and SS groups were coincident. Our results show that by FCM, the expression and binding of GR in SR patients with SLE were lower than those in both SS and control groups. However, there was no difference in the expression and binding of GRs in SS patients compared with those in controls except for the binding of GR in T lymphocytes. Similar results were also found in patients with nephrotic syndrome (data not shown). A previous study found decreases in the number and affinity of GR in SR patients with idiopathic nephritic syndrome and pur-ported that the altered secretion of cytokines may be involved in tissue sensitivity to GCs [10]. Other studies have shown no Figure 1
Evaluation of FCM analysis of GR binding by RLBA
Evaluation of FCM analysis of GR binding by RLBA. Analysis of GR binding in (a) K562 and (b) U937 with and without 10-6 M Dex by
change in GR of SR patients compared with those of SS patients and controls [7,8]. Different age distribution and path-ological states may account for these conflicting results. In our study, the subjects were mainly adult patients with similar age distribution. We determined GR in CD3+ and CD14+ subset rather than the heterogeneous aggregate, which may play a role in these differences. Alternatively, GR was detected by FCM with different probes for the expression and binding at the same time. Moreover, the administration of GR agonists results in a significant down-regulation of the expression of GR
in vitro and in vivo, so we detected GR of SLE patients in the active phase before the treatment rather than during the treat-ment. In summary, these data suggest that down-regulation of GR expression and binding might mediate steroid resistance in some patients with SLE.
We also evaluated the percentage of positive lymphocytes and monocytes presenting GR in SLE patients and normal controls. No difference was found between the results of
patients and controls. Similar results were obtained by Wasilewska and colleagues [33]. From these results, we infer that the expression and binding of GR on a per cell basis, but not the overall positive rate of GR, might be correlated with steroid response.
[image:7.612.66.553.91.429.2]In addition, we performed an in vitro corticosteroid sensitivity assay in patients and normal controls. In vitro Dex inhibition of Con-A stimulated cytokine release has been used to examine the effect of corticosteroids in idiopathic nephritic syndrome [10]. In our study, the control and SS groups presented higher inhibition of cytokine secretion than SR group, which confirms patient classification as SR and SS by SLEDAI score. As a result, the detection of GR by FCM before steroid therapy as well as in vitro corticosteroid sensitivity assay may predict clin-ical response to the treatment more accurately. As to the rela-tion of GR and inhibirela-tion of cytokine secrerela-tion, there was a positive relation between the GR binding in two subsets (T lymphocytes and monocytes) and the inhibition rate of Figure 2
Evaluation of FCM analysis of GR expression by western blot
Evaluation of FCM analysis of GR expression by western blot. Analysis of GR repression in (left) K562 and (right) U937 with and without 10-6 M Dex
cytokine secretion, which was different from the GR expres-sion. However, whether the low binding capacity of GR is con-tributing to the reduced inhibition rate of cytokines or the systemic inflammation induced GC resistance [34,35] need to be further discussed.
[image:8.612.64.554.93.279.2]GR binding and expression have been detected recently by RLBA and western blot, separately. However, the two meth-ods could not evaluate individual cells or specific cell types in a given tissue sample. Moreover, it is challenging to use the two methods in a clinic for they are time consuming, expensive and radioactive materials are unavoidably involved.
Figure 3
Percentage of GR-positive T lymphocytes and monocytes in SLE patients and controls
Percentage of GR-positive T lymphocytes and monocytes in SLE patients and controls. (a) Percentage of T lymphocytes and monocytes presents-ing GR. The percentage of positive T lymphocytes and monocytes presentpresents-ing GR in SR group did not differ from those in SS and the normal control groups (P > 0.05). (b) Percentage of GR-binding positive T lymphocytes and monocytes. The percentage of positive GR-binding cells was also sim-ilar among the SR, SS and normal control groups (P > 0.05). GR = glucocorticoid receptor; SLE = systemic lupus erythematosus; SR = steroid-resistant; SS = steroid-sensitive.
Figure 4
FCM analysis of GR in SLE patients and controls
[image:8.612.59.555.461.646.2]FCM is a convenient tool for determining protein expression of cell surface receptors and has also been shown to be useful in identifying expression of intracellular proteins in permeabi-lised cells [36]. Especially when complex mixtures of cells are present, FCM can be used to sort subpopulations of cells and therefore identify GR expressed in specific cell types. In a recent study, a method for the quantification of GR by FCM was developed in different cell lines [37]. Although it estab-lished the method which could detect GR, even quantifying the number of receptor molecules per cell, it seems that they did not reflect GR from various points of view. A few studies in the literature indicated that a high level of GR did not always relate to a satisfying response to GC therapy [38]. Similar observations have been made in studies of patients with ulcer-ative colitis [39-41]. As a result, the analysis of GR expression and binding was important to the evaluation of the response to GC therapy.
Detection of GR expression and binding by FCM using mAb and fluorescein ligand probes at the same time was first reported in clones of CCRF-CEM human leukaemic cells [27]. In the current study, it was first used to identify biomarkers that clinically predict steroid response. To confirm the GR
meas-urements by FCM, RLBA, which had been used for GR bind-ing detection, and western blot, which has been used for GR expression detection, were performed at the same time and the results were consistent between FCM and western blot or BLRA.
Conclusions
Our data showed that the GR expression and binding in SLE patients was lower in the SR group than that in the SS and control groups. FCM was a reliable and reproducible method for measuring GR in experimental and clinical settings. The clinical response to steroid therapy of patients with SLE may be predicted using FCM analysis of GR. Further studies are needed to expand sample size and determine the normal scope of GRs.
Competing interests
[image:9.612.62.555.91.391.2]The authors declare that they have no competing interests. Figure 5
Inhibition of cytokine secretion in SR and SS groups
Inhibition of cytokine secretion in SR and SS groups. Percentage of inhibition of (a) TNF-α, (b) IL-12 and (c) IFN-γ cytokine secretion after PBMC incubation in RPMI with PHA plus 10-6 M dexamethasone in normal controls, SS patients and SR patients. Calculation formula of percentage
Authors' contributions
CL conceived the study, participated in its design and coordi-nation. JD and ML contributed equally in study design, collect-ing samples from patients, FCM analysis of GR, western blot and drafting the manuscript. DZ participated in study design, performed most of the statistical analyses and revised the manuscript. XZ participated in study design, interpretation of data and revision of the manuscript. WZ contributed in FCM analysis of GR. WG participated in RLBA and interpretation of statistical analyses. YF and XZ contributed with samples from controls and participated in revision of the manuscript. All authors read and approved the final manuscript.
Acknowledgements
This work was supported partly by the National Nature Science Founda-tion of China (30730114). The authors would like to express apprecia-tion to the staff of Department of Rheumatology and Department of Nephrology, Changhai Hospital for contributing to the completion of this work. The authors also thank Renbao Xu and Jiaqing Zhang for help in preparing this manuscript.
References
1. Leung DY, Bloom JW: Update on glucocorticoid action and resistance. J Allergy Clin Immunol 2003, 111:3-22.
2. Towers R, Naftali T, Gabay G, Carlebach M, Klein A, Novis B: High levels of glucocorticoid receptors in patients with active Crohn's disease may predict steroid resistance. Clin Exp Immunol 2005, 141:357-362.
3. Buttgereit F, Saag KG, Cutolo M, da Silva JA, Bijlsma JW: The molecular basis for the effectiveness, toxicity, and resistanc-eto glucocorticoids: focus on the treatment of rheumatoid arthritis. Scand J Rheumatol 2005, 34:14-21.
4. Spahn JD, Landwehr LP, Nimmagadda S, Surs W, Leung DYM, Szefler SJ: Effects of glucocorticoids on lymphocyte activation in patients with steroid-sensitive and steroid-resistant asthma. J Allergy Clin Immunol 1996, 98:1073-1079.
5. Cho YJ, Lee KE: Decreased glucocorticoid binding affinity to glucocorticoid receptor is important in the poor response to steroid therapy of older-aged patients with severe bronchial asthma. Allergy Asthma Proc 2003, 24:353-358.
6. Tissing WJ, Lauten M, Meijerink JP, den Boer ML, Koper JW, Son-neveld P, Pieters R: Expression of the glucocorticoid receptor and its isoforms in relation to glucocorticoid resistance in childhood acute lymphocytic leukemia. Haematologica 2005, 90:1279-1281.
7. Lauten M, Cario G, Asgedom G, Welte K, Schrappe M: Protein expression of the glucocorticoid receptor in childhood acute lymphoblastic leukemia. Haematologica 2003, 88:1253-1258. 8. Haarman EG, Kaspers GJL, Pieters R, Rottier MMA, Veerman AJP:
[image:10.612.59.516.94.400.2]Glucocorticoid receptor a, b and g expression vs in vitro gluco-corticod resistance in childhood leukemia. Leukemia 2004, 18:530-537.
Figure 6
Correlation between GR binding and TNF-α, IL-12 and IFN-γ
Correlation between GR binding and TNF-α, IL-12 and IFN-γ. Percentage inhibition of (a) TNF-α, (b) IL-12 and (c) IFN-γ cytokine secretion after PBMC incubation in RPMI with PHA plus 10-6 M dexamethasone were correlated to GR binding in (left) CD3+ and (right) CD14+ subpopulation in
9. Spahn JD, Landwehr LP, Nimmagadda S, Surs W, Leung DYM, Szefler SJ: Effects of glucocorticoids on lymphocyte activation in patients with steroid-sensitive and steroid-resistant asthma. J Allergy Clin Immunol 1996, 98:1073-1079.
10. Carlotti AP, Franco PB, Elias LL, Facincani I, Costa EL, Foss N, Moreira AC, de Castro M: Glucocorticoid receptors, in vitro ster-oid sensitivity, and cytokine secretion in idiopathic nephrotic syndrome. Kidney International 2004, 65:403-408.
11. De Antonio SR, Saber LT, Chriguer RS, de Castro M: Glucocorti-coid resistance in dialysis patients may impair the kidney allo-graft outcome. Nephrol Dial Transplant 2008, 23:1422-1428. 12. Haack D, Schärer K, Asam-Tauscher A, Vecsei P: Glucocorticoid
receptors in idiopathic nephrotic syndrome. Pediatr Nephrol
1999, 13:653-656.
13. Kim EY, Zeng QT, Kuo FC, Rawn J, Mentzer SJ: Visual represen-tation of cell subpopulation from flow cytometry data. AMIA Annu Symp Proc 2003:893.
14. Zhang JP, Yan J, Xu J, Pang XH, Chen MS, Li L, Wu C, Li SP, Zheng L: Increased intratumoral IL-17-producing cells corre-late with poor survival in hepatocellular carcinoma patients. J Hepatol 2009, 50:980-989.
15. Towers R, Naftali T, Gabay G, Carlebach M, Klein A, Novis B: High levels of glucocorticoid receptors in patients with active Crohn's disease may predict steroid resistance. Clin Exp Immunol 2005, 141:357-362.
16. Shimada T, Hiwataschi N, Yamazaki H, Kinouchi Y, Toyota T: Rela-tionship between glucocorticoid receptor and response to glu-cocorticoid therapy in ulcerative colitis. Dis Colon Rectum
1997, 40:S54-S58.
17. Rogler G, Meinel A, Lingauer A, Michl J, Zietz B, Gross V, Lang B, Andus T, Scholmerich J, Palitzsch KD: Glucocorticoid receptors are down-regulated in inflamed colonic mucosa but not in peripheral blood mononuclear cells from patients with inflam-matory bowel disease. Eur J Clin Invest 1999, 29:330-336. 18. Schottelius A, Wedel S, Weltrich R, Rohde W, Buttgereit F,
Sch-reiber S, Lochs H: Higher expression of glucocorticoid receptor in peripheral mononuclear cells in inflammatory bowel dis-eases. Am J Gastroenterol 2000, 95:1994-1999.
19. Pace TW, Hu F, Miller AH: Cytokine-effects on glucocorticoid receptor function: relevance to glucocorticoid resistance and the pathophysiology and treatment of major depression. Brain Behav Immun 2007, 21:9-19.
20. Lee PY, Weinstein JS, Nacionales DC, Scumpia PO, Li Y, But-filoski E, van Rooijen N, Moldawer L, Satoh M, Reeves WH: A novel type I IFN-producing cell subset in murine lupus. J Immunol 2008, 180:5101-5108.
21. Csiszár A, Nagy G, Gergely P, Pozsonyi T, Pócsik E: Increased interferon-gamma (IFN-γ), IL-10 and decreased IL-4 mRNA expression in peripheral blood mononuclear cells (PBMC) from patients with systemic lupus erythematosus (SLE). Clin Exp Immunol 2000, 122:464-470.
22. Sabry A, Sheashaa H, El-Husseini A, Mahmoud K, Eldahshan KF, George SK, Abdel-Khalek E, El-Shafey EM, Abo-Zenah H: Proin-flammatory cytokines (TNF-a and IL-6) in Egyptian patients with SLE: its correlation with disease activity. Cytokine 2006, 35:148-153.
23. Tucci M, Lombardi L, Richards HB, Dammacco F, Silvestris F: Overexpression of interleukin-12 and T helper 1 predomi-nance in lupus nephritis. Clin Exp Immunol 2008, 154:247-254. 24. Tan EM, Cohen AS, Fries JF, Masi AT, McShane DJ, Rothfield NF, Schaller JG, Talal N, Winchester RJ: The 1982 revised criteria for the classification of systemic lupus erythematosus. Arthritis Rheum 1982, 25:1271-1277.
25. Bombardier C, Gladman DD, Urowitz MB, Caron D, Chang CH, the Committee on Progress Studies in SLE: Derivation of the SLEDAI: a disease activity index for lupus patients. Arthritis Rheum 1992, 35:630-640.
26. Seki M, Ushiyama C, Seta N, Abe K, Fukazawa T, Asakawa J, Taka-saki Y, Hashimoto H: Apoptosis of lymphocytes induced by glu-cocorticoids and relationship to therapeutic efficacy in patients with systemic lupus erythematosus. Arthritis Rheum
1998, 41:823-830.
27. Marchetti D, Van NT, Gametchu B, Thompson EB, Kobayashi Y, Watanabe F, Barlogie B: Flow cytometric analysis of glucocor-ticoid receptor using monoclonal antibody and fluorescein-ated ligand probes. Cancer Res 1989, 49:863-869.
28. Takayama S, Rogatsky I, Schwarcz LE, Darimont BD: The gluco-corticoid receptor represses cyclin D1 by targeting the Tcf-beta-catenin complex. J Biol Chem 2006, 281:17856-17863. 29. Steiner AE, Wrrliff JL: A whole-cell assay for glucocorticoid
binding sites in normal human lymphocytes. Clin Chem 1985, 31:1855-1860.
30. Lacroix A, Bonnard GD, Lippman ME: Modulation of glucocorti-coid receptors by mitogenic stimuli, glucocortiglucocorti-coids and retin-oids in normal human cultured T cells. J Steroid Biochem
1984, 21:73-80.
31. Silva CM, Powell-Oliver FE, Jewell CM, Sar M, Allgood VE, Cidlowski JA: Regulation of the human glucocorticoid receptor by long-term and chronic treatment with glucocorticoid. Ster-oids 1994, 59:436-442.
32. Wallace AD, Cidlowski JA: Proteasome-mediated glucocorti-coid receptor degradation restricts transcriptional signaling by glucocorticoids. J Biol Chem 2001, 276:42714-42721. 33. Wasilewska A, Zoch-Zwierz W, Tomaszewska B, Wierciñski R,
Stasiak-Barmuta A: Expression of glucocorticoid receptors in mononuclear cells in nephrotic syndrome. Pediatr Nephrol
2003, 18:778-782.
34. Tliba O, Damera G, Banerjee A, Gu S, Baidouri H, Keslacy S, Amrani Y: Cytokines induce an early steroid resistance in air-way smooth muscle cells: novel role of interferon regulatory factor-1. Am J Respir Cell Mol Biol 2008, 38:463-472. 35. Pace TW, Hu F, Miller AH: Cytokine-effects on glucocorticoid
receptor function: relevance to glucocorticoid resistance and the pathophysiology and treatment of major depression. Brain Behav Immun 2007, 21:9-19.
36. Yole M, Wickstrom M, Blakley B: Cell death and cytotoxic effects in YAC-1 lymphoma cells following exposure to various forms of mercury. Toxicology 2007, 231:40-57.
37. Voutsas IF, Gritzapis AD, Alexis MN, Katsanou ES, Perez S, Bax-evanis CN, Papamichail M: A novel quantitative flow cytometric method for measuring glucocorticoid receptor (GR) in cell lines: correlation with the biochemical determination of GR. J Immunol Methods 2007, 324:110-119.
38. Kaspers GJL, Pieters R, Klumper E, De Waal FC, Veerman AJP: Glucocorticoid resistance in childhood leukemia. Leuk Lym-phoma 1994, 13:187-201.
39. Shimada T, Hiwataschi N, Yamazaki H, Kinouchi Y, Toyota T: Rela-tionship between glucocorticoid receptor and response to glu-cocorticoid therapy in ulcerative colitis. Dis Colon Rectum
1997, 40:S54-S58.
40. Rogler G, Meinel A, Lingauer A, Michl J, Zietz B, Gross V, Lang B, Andus T, Scholmerich J, Palitzsch KD: Glucocorticoid receptors are down-regulated in inflamed colonic mucosa but not in peripheral blood mononuclear cells from patients with inflam-matory bowel disease. Eur J Clin Invest 1999, 29:330-336. 41. Schottelius A, Wedel S, Weltrich R, Rohde W, Buttgereit F,